Multicenter Study
. 2021 Sep 14;12(1):5417.
doi: 10.1038/s41467-021-25509-3.

New-onset IgG autoantibodies in hospitalized patients with COVID-19

Affiliations
Multicenter Study

New-onset IgG autoantibodies in hospitalized patients with COVID-19

Sarah Esther Chang et al. Nat Commun. .

Abstract

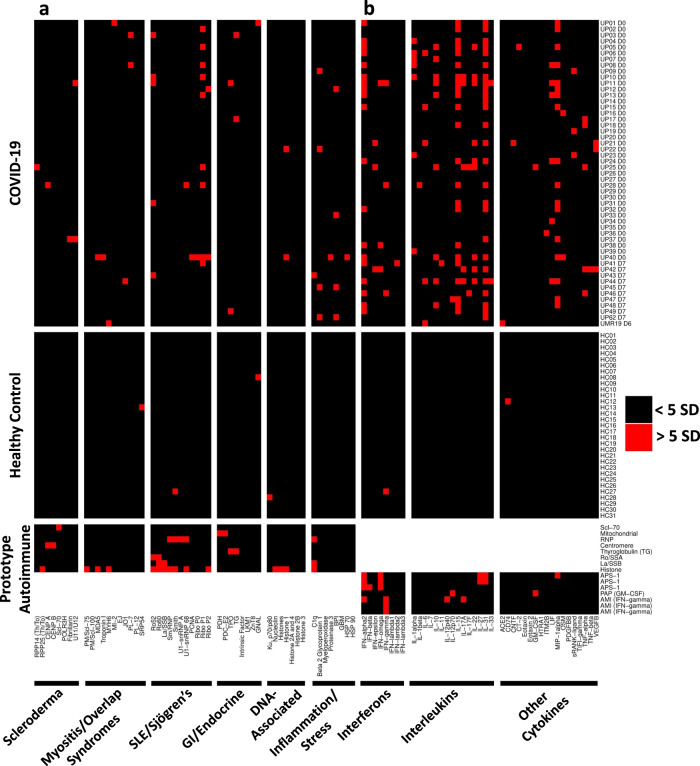
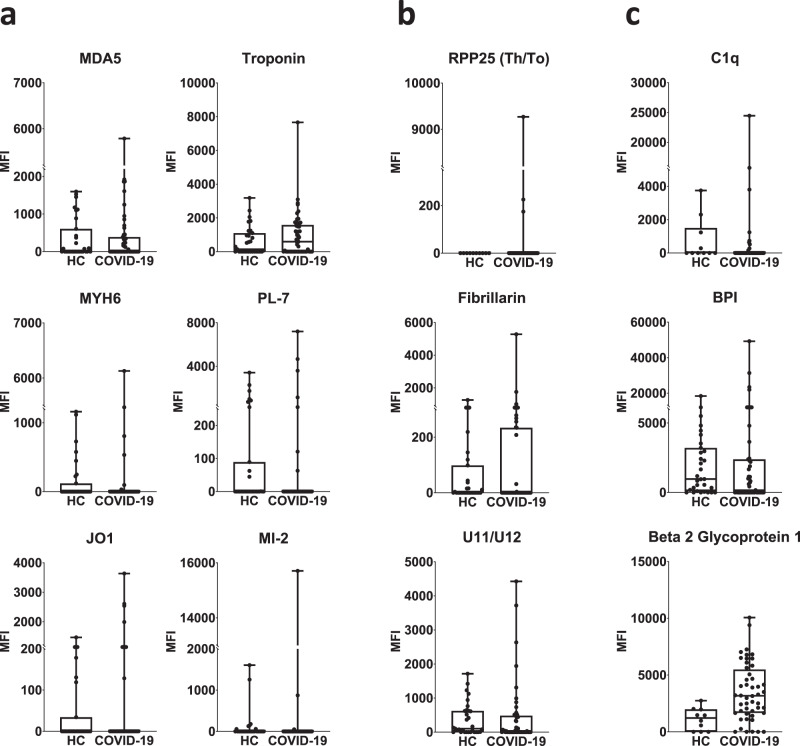
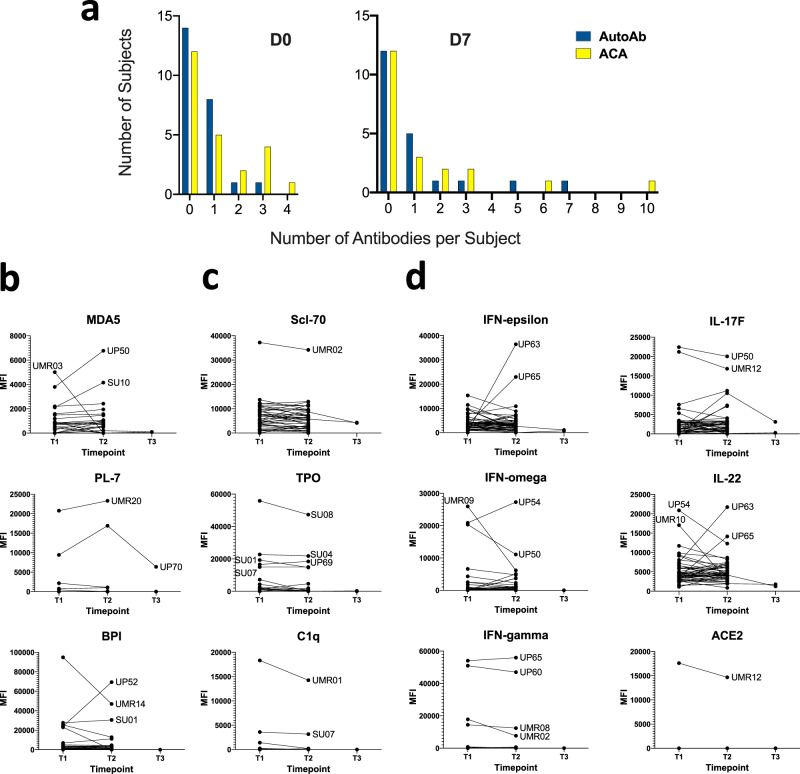
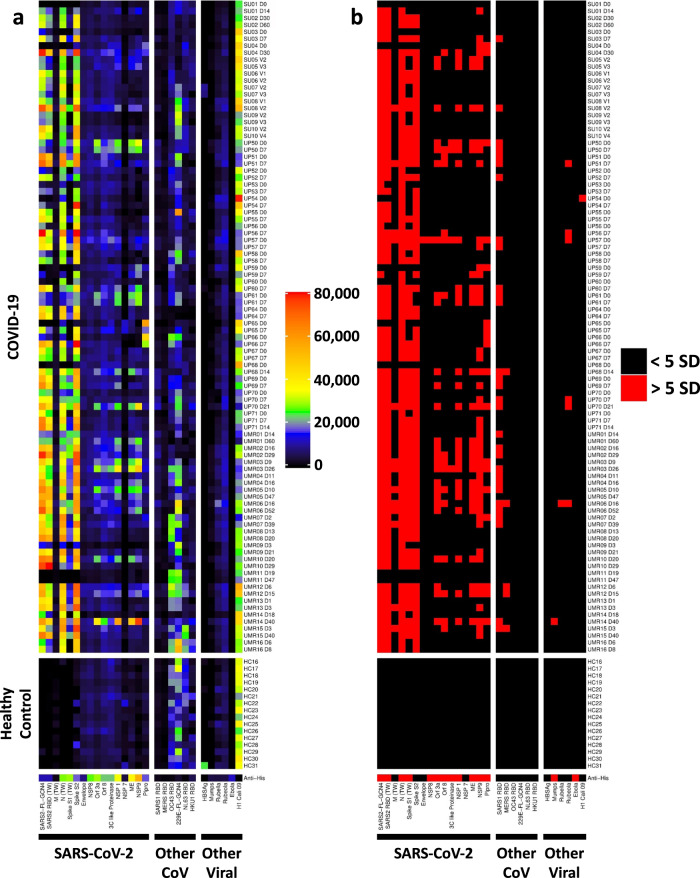
COVID-19 is associated with a wide range of clinical manifestations, including autoimmune features and autoantibody production. Here we develop three protein arrays to measure IgG autoantibodies associated with connective tissue diseases, anti-cytokine antibodies, and anti-viral antibody responses in serum from 147 hospitalized COVID-19 patients. Autoantibodies are identified in approximately 50% of patients but in less than 15% of healthy controls. When present, autoantibodies largely target autoantigens associated with rare disorders such as myositis, systemic sclerosis and overlap syndromes. A subset of autoantibodies targeting traditional autoantigens or cytokines develop de novo following SARS-CoV-2 infection. Autoantibodies track with longitudinal development of IgG antibodies recognizing SARS-CoV-2 structural proteins and a subset of non-structural proteins, but not proteins from influenza, seasonal coronaviruses or other pathogenic viruses. We conclude that SARS-CoV-2 causes development of new-onset IgG autoantibodies in a significant proportion of hospitalized COVID-19 patients and are positively correlated with immune responses to SARS-CoV-2 proteins.


Conflict of interest statement

C.S. received consultancy fees and research funding from Hycor Biomedical and Thermo Fisher Scientific, research funding from Mead Johnson Nutrition (MJN), and consultancy fees from Bencard Allergie. E.J.W. has consulting agreements with and/or is on the scientific advisory board for Merck, Elstar, Janssen, Related Sciences, Synthekine, and Surface Oncology. E.J.W. is a founder of Surface Oncology and Arsenal Biosciences. E.J.W. has a patent licensing agreement on the PD-1 pathway with Roche/Genentech. E.M. received consultancy fees from Roche. E.T.L.P. receives research funding from Janssen Research and Development, consultancy fees, and research funding from Roche Diagnostics, is a paid consultant for Enpicom, and serves on the scientific advisory boards of the Antibody Society, the Immune Epitope Database, and the American Autoimmune Related Diseases Association. N.J.M. reports funding to her institution from Athersys Inc, Biomarck Inc, and Quantum Leap Healthcare Collaborative, outside of the funded work. S. Chinthrajah reports grants from NIAID, CoFAR, Aimmune, DBV Technologies, Astellas, Regeneron, FARE, and is an Advisory Board member for Alladapt, Genentech, Novartis, Sanofi, and received personal fees from Nutricia. All remaining authors declare no competing interests with the research reported in this paper.

Figures

Fig. 1
Fig. 1. High prevalence of autoantibodies in hospitalized COVID-19 patients.
a Heatmap depicting serum IgG antibodies discovered using a 53-plex bead-based protein array containing the indicated autoantigens (x-axis). Autoantigens are grouped based on disease (scleroderma, myositis, and overlap syndromes such as mixed connective tissue disease (MCTD), SLE/Sjögren’s, gastrointestinal and endocrine disorders), DNA-associated antigens, and antigens associated with tissue inflammation or stress responses. COVID-19 patients (top panel), HC (n = 31, middle panel), and 8 prototype autoimmune disorders (bottom panel) are shown. Colors indicate autoantibodies whose MFI measurements are >5 SD (red) or <5 SD (black) above the average MFI for HC. MFIs <3000 were excluded. b Heatmap using a 41-plex array of cytokines, chemokines, growth factors, and receptors. The same samples in Panel A were also analyzed for anti-cytokine antibodies (ACA). Cytokines are grouped on the x-axis by category (interferons, interleukins, and other cytokines/growth factors/receptors). Prototype samples from patients with immunodeficiency disorders include three patients with Autoimmune Polyendocrine Syndrome Type 1 (APS-1), one patient with Pulmonary Alveolar Proteinosis (PAP), and three patients with Atypical Mycobacterial Infections (AMI). Colors indicate autoantibodies whose MFI measurements are >5 SD (red) or <5 SD (black) above the average MFI for HC. MFIs <3000 were excluded. Source data are provided as a Source Data file.
Fig. 2
Fig. 2. Serum autoantibodies in COVID-19 patients recognize antigens targeted in rare connective tissue diseases, and antigens associated with pathogenicity.
Boxplots of twelve antigens corresponding to Fig. 1. a Antigens associated with autoimmune myositis and myocarditis (MDA5, troponin 1, MYH6 (alpha-myosin), PL-7, Jo-1, and Mi-2). b RNA-containing antigens associated with systemic sclerosis (RPP25 Th/To, Fibrillarin, and U11/U12). c Antigens that may be pathogenic (C1q and β2GP1) and associated with vasculitis (BPI). MFI data in ac are represented as boxplots where the middle line is the median, the lower and upper hinges correspond to the first and third quartiles, the upper whisker extends from the hinge to the largest value, and the lower whisker extends from the hinge to the smallest value. Individual MFI values are displayed as dots. MFI is shown on the y-axis. Subjects are shown on the x-axis (n = 51 unpaired UPenn and Marburg COVID-19 patients and n = 31 HC). Source data are provided as a Source Data file.
Fig. 3
Fig. 3. Autoantibodies are triggered by SARS-CoV-2 infection.
a Autoantibody (AutoAb, blue) and anti-cytokine antibody (ACA, yellow) counts are shown at Day 0 (n = 24 patients, left) and Day 7 (n = 21 patients, right). Counts were based on antibodies that were present at levels at or exceeding 5 SD above the average MFI for healthy control samples. b Examples of transient or fluctuating autoantibodies against MDA5, the tRNA synthetase PL-7, and the vasculitis antigen BPI are shown. c Examples of antigens (Scl-70, TPO, and C1q) that are likely to have been present at the time of infection and are unaffected by SARS-CoV-2 infection, are shown. d Examples of ACA that are inducible (e.g., IFN-ε), fluctuate (e.g., IFN-ω), or are present at baseline with little change over time (e.g., IFN-γ), are shown. Additional examples (IL-17, IL-22, and ACE-2) are also included. MFI is shown on the y-axis. Serum was collected at three time points (T1, T2, and T3) for two COVID-19 subjects, while serum was collected at two time points (T1 and T2) for all other COVID-19 subjects. COVID-19 subjects with notably high MFI at any time point are labeled. Source data are provided as a Source Data file.
Fig. 4
Fig. 4. Measurement of anti-viral IgG responses using a COVID-19 viral array.
a Heatmap depicting IgG antibodies using a 28-plex bead-based protein array. Viral protein antigens are grouped based on sixteen proteins from SARS-CoV-2 (left panel), other coronaviruses (middle panel), and other viruses (right panel), labeled on the x-axis. Most recombinant viral proteins were engineered to include a 6X-His-tag, which was used to validate conjugation to beads using an anti-epitope monoclonal antibody (bottom of the panel). The same COVID-19 patients from Fig. 3 (see Supplementary Figures 9 and 10) were analyzed (top panel, n = 94 longitudinal COVID-19 samples, including paired samples from 44 subjects and 2 subjects who had 3 available time points each, subjects UP70 and UP71). HC (n = 16, middle panel). Two patient sample pairs (UP63 and UMR20) were excluded from analysis due to technical failure on the viral array assay. Colors correspond to the MFI values shown at right. b Heatmap depicting statistically significant anti-viral IgG responses. Colors indicate IgG antibodies whose MFI measurements are >5 SD (red) or <5 SD (black) above the average MFI for HC samples collected prior to the COVID-19 pandemic. Source data are provided as a Source Data file.
Fig. 5
Fig. 5. New-onset autoantibodies correlate with anti-SARS-CoV-2 IgG responses over time in recently infected patients who developed COVID-19.
Twelve patients were identified who had low or absent anti-SARS-CoV-2 RBD or spike S1 protein responses at baseline and who went on to develop high MFI IgG SARS-CoV-2 antibodies at the next available time point. Autoantigen data (a) and ACA data (b) from Supplementary Figures 9 and 10 (using 5 SD and MFI > 3000 cutoffs) for these 12 patients and HC has been combined with anti-viral heatmap data from Fig. 4 (c). Multiple new autoantibodies are depicted with white boxes. Antigens are shown on the x-axis. Patients and HC are shown on the y-axis. Colors for viral IgG levels correspond to the MFI values shown at the far right. d Line graphs comparing MFI for IgG antibodies against four viral proteins at Early (D0) and Late (D7) time points for the same 12 patients in ac. e Line graphs comparing MFI for IgG autoantibodies against eight autoantigens or cytokines at Early (D0) and Late (D7) time points for 4 patients in ad. Source data are provided as a Source Data file.

Update of

  • New-Onset IgG Autoantibodies in Hospitalized Patients with COVID-19.
    Chang SE, Feng A, Meng W, Apostolidis SA, Mack E, Artandi M, Barman L, Bennett K, Chakraborty S, Chang I, Cheung P, Chinthrajah S, Dhingra S, Do E, Finck A, Gaano A, Geßner R, Giannini HM, Gonzalez J, Greib S, Gündisch M, Hsu AR, Kuo A, Manohar M, Mao R, Neeli I, Neubauer A, Oniyide O, Powell AE, Puri R, Renz H, Schapiro JM, Weidenbacher PA, Wittman R, Ahuja N, Chung HR, Jagannathan P, James J, Kim PS, Meyer NJ, Nadeau K, Radic M, Robinson WH, Singh U, Wang TT, Wherry EJ, Skevaki C, Prak ETL, Utz PJ. Chang SE, et al. medRxiv [Preprint]. 2021 Jan 29:2021.01.27.21250559. doi: 10.1101/2021.01.27.21250559. medRxiv. 2021. Update in: Nat Commun. 2021 Sep 14;12(1):5417. doi: 10.1038/s41467-021-25509-3. PMID: 33532787 Free PMC article. Updated. Preprint.

References

    1. Guan WJ, et al. Clinical characteristics of coronavirus disease 2019 in China. N. Engl. J. Med. 2020;382:1708–1720. doi: 10.1056/NEJMoa2002032. - DOI - PMC - PubMed
    1. Chen N, et al. Epidemiological and clinical characteristics of 99 cases of 2019 novel coronavirus pneumonia in Wuhan, China: a descriptive study. Lancet. 2020;395:507–513. doi: 10.1016/S0140-6736(20)30211-7. - DOI - PMC - PubMed
    1. Machhi J, et al. The natural history, pathobiology, and clinical manifestations of SARS-CoV-2 infections. J. Neuroimmune Pharm. 2020;15:359–386. doi: 10.1007/s11481-020-09944-5. - DOI - PMC - PubMed
    1. Asfuroglu Kalkan E, Ates I. A case of subacute thyroiditis associated with Covid-19 infection. J. Endocrinol. Invest. 2020;43:1173–1174. doi: 10.1007/s40618-020-01316-3. - DOI - PMC - PubMed
    1. Brancatella, A. et al. Subacute thyroiditis after Sars-COV-2 infection. J. Clin. Endocrinol Metab.10.1210/clinem/dgaa276 (2020). - PMC - PubMed

Publication types

MeSH terms