. 2022 Mar;16(3):666-675.
doi: 10.1038/s41396-021-01106-6. Epub 2021 Sep 15.

Microdiversity characterizes prevalent phylogenetic clades in the glacier-fed stream microbiome

Affiliations

Microdiversity characterizes prevalent phylogenetic clades in the glacier-fed stream microbiome

Stilianos Fodelianakis et al. ISME J. 2022 Mar.

Abstract

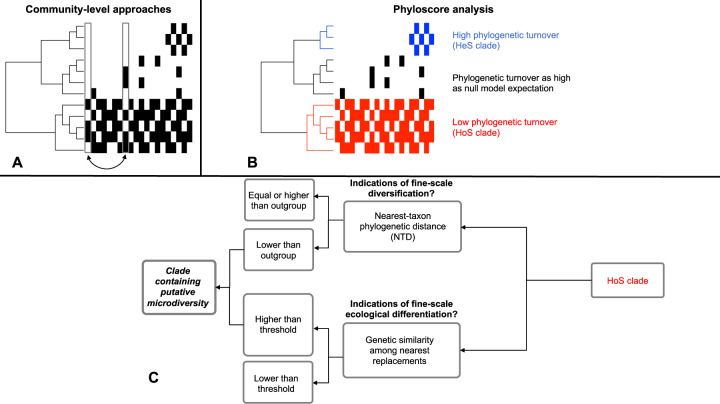
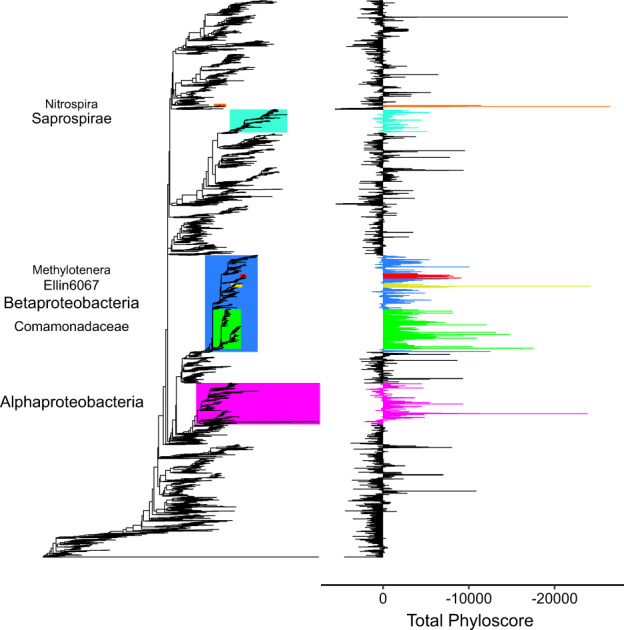
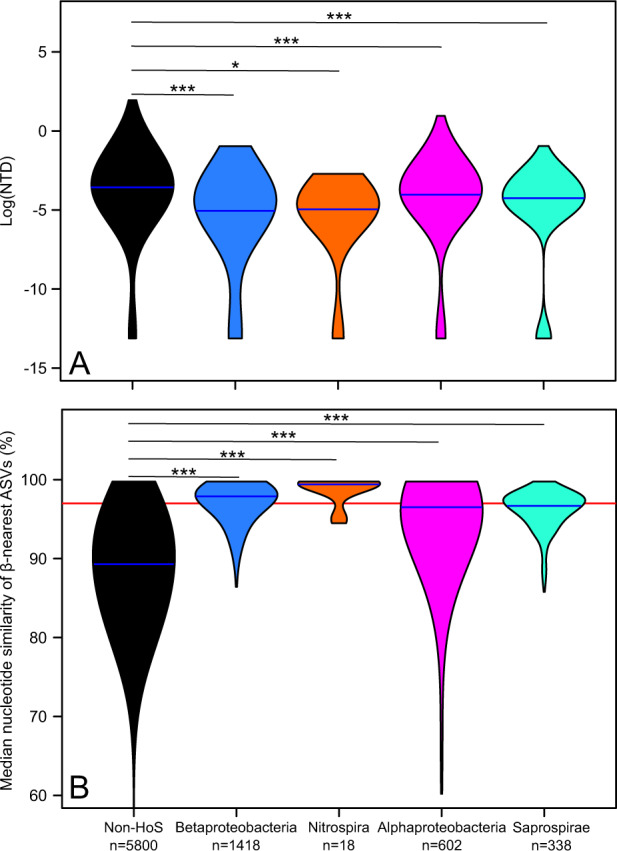
Glacier-fed streams (GFSs) are extreme and rapidly vanishing ecosystems, and yet they harbor diverse microbial communities. Although our understanding of the GFS microbiome has recently increased, we do not know which microbial clades are ecologically successful in these ecosystems, nor do we understand potentially underlying mechanisms. Ecologically successful clades should be more prevalent across GFSs compared to other clades, which should be reflected as clade-wise distinctly low phylogenetic turnover. However, methods to assess such patterns are currently missing. Here we developed and applied a novel analytical framework, "phyloscore analysis", to identify clades with lower spatial phylogenetic turnover than other clades in the sediment microbiome across twenty GFSs in New Zealand. These clades constituted up to 44% and 64% of community α-diversity and abundance, respectively. Furthermore, both their α-diversity and abundance increased as sediment chlorophyll a decreased, corroborating their ecological success in GFS habitats largely devoid of primary production. These clades also contained elevated levels of putative microdiversity than others, which could potentially explain their high prevalence in GFSs. This hitherto unknown microdiversity may be threatened as glaciers shrink, urging towards further genomic and functional exploration of the GFS microbiome.


Conflict of interest statement

The authors declare no competing interests.

Figures

Fig. 1
Fig. 1. Community-wide and per-taxon phylogenetic turnover, and the subsequent search for putative microdiversity in specific phylogenetic clades.
A A conceptual microbiome survey with the phylogenetic tree of the microbiome on the left and the respective presence/absence matrix on the right. Arrows indicate an example comparison such as it is currently performed with existing community-wide methods between two samples (columns), allowing comparisons across samples but not across clades. B The same survey, but analyzed following phyloscore analysis that allows comparisons of phylogenetic turnover across clades. The red clade (HoS clade) has high clade-wide prevalence; when a red taxon is not present other red taxa are present. This will result in low phylogenetic turnover (β-nearest taxon distances -βNTDs) clade-wise. Similarly, because the blue clade has low prevalence and the black clade is sparsely present in the ecosystem, the blue clade will have higher-than-expected phylogenetic turnover and the black clade will have similar phylogenetic turnover to the null model expectation. C HoS clades identified by phyloscore analysis can subsequently be examined for indications of microdiversity, by assessing the degree of within-clade fine-scale diversification and ecological differentiation.
Fig. 2
Fig. 2. Homogeneous selection is the dominant assembly process at the community level.
The histogram shows the distribution of βNTI values for sample comparisons across GFSs and the proportion of community pairs under each community assembly processes. Vertical dashed red lines are drawn at βNTI values of −2 and +2, which are the cutoff values for lower and higher than expected phylogenetic community turnover, respectively, the former indicating homogeneous selection and the latter indicating variable selection at the community level. The assembly processes governing the sample pairs in between are estimated from compositional turnover patterns based on the RCBray index.
Fig. 3
Fig. 3. The identified phylogenetic clades under homogeneous ecological selection (HoS clades) that have lower within-clade total phyloscores compared to outgroups.
HoS clades with >15 ASVs are color-coded on the phylogenetic tree, and the consensus taxonomy is given for each clade on the left with font size proportional to taxonomic depth. Clades nested within Betaproteobacteria are colored individually. The total phyloscore of each ASV (i.e., the sums of the phyloscores across community pairs) is shown to the right as bars with colors matching the clades’ colors.
Fig. 4
Fig. 4. The core microbiome at the genus level and the HoS clades overlap highly.
The overall core microbiome, i.e., taxonomic units found across all the sampled GFS reaches, is represented as a hierarchy tree (dark green edges) within the overall taxonomic tree (dark green and gray edges). The node color and size are proportional to the node’s abundance (cells per gram of dry sediment) and diversity (number of ASVs), respectively, as per the legend on the upper right. Only core genera, phyla, and classes within the Proteobacteria phylum are labeled to improve visualization with colors according to the legend on the upper left. Red asterisks indicate genera that reside in HoS clades.
Fig. 5
Fig. 5. HoS clades thrive in sediments with low chlorophyll a that also have low total bacterial cell abundance.
A The cumulative relative abundance of the HoS clades as a function of the sediment chlorophyll a. B The ratio of ASVs in HoS clades over the total ASVs as a function of the sediment chlorophyll a. C The total bacterial cell abundance as a function of the sediment chlorophyll a. For all panels, n = 119.
Fig. 6
Fig. 6. HoS clades are hotspots for microdiversity.
A Violin plots showing the distribution of the nearest taxon distance (i.e., the phylogenetic distance between a given ASV and its closest relative—NTD, y axis in log-scale) in non-HoS clades and in each HoS clade. B Violin plots showing the distribution of the median nucleotide similarity of β-nearest ASVs (i.e., per-ASV median similarity between a given ASV a and its closest relatives in communities where a is not present, y axis in %) in non-HoS clades and in each HoS clade. Blue horizontal lines represent medians. Color-coding of HoS clades is as in Fig. 3. Asterisks correspond to the significance level of Wilcoxon tests (* and *** for levels of 0.05 and <0.001, respectively). The number of ASVs per clade (n) is shown at the legend on the bottom.

References

    1. Milner AM, Khamis K, Battin TJ, Brittain JE, Barrand NE, Füreder L, et al. Glacier shrinkage driving global changes in downstream systems. Proc Nat Acad Sci USA. 2017;114:9770. - PMC - PubMed
    1. Battin TJ, Wille A, Sattler B, Psenner R. Phylogenetic and functional heterogeneity of sediment biofilms along environmental gradients in a glacial stream. Appl Environ Microbiol. 2001;67:799–807. - PMC - PubMed
    1. Wilhelm L, Singer GA, Fasching C, Battin TJ, Besemer K. Microbial biodiversity in glacier-fed streams. ISME J. 2013;7:1651. - PMC - PubMed
    1. Ren Z, Gao H, Elser JJ, Zhao Q. Microbial functional genes elucidate environmental drivers of biofilm metabolism in glacier-fed streams. Sci Rep. 2017;7:12668. - PMC - PubMed
    1. Dini-Andreote F, Stegen JC, van Elsas JD, Salles JF. Disentangling mechanisms that mediate the balance between stochastic and deterministic processes in microbial succession. Proc Nat Acad Sci USA. 2015;112:1326. - PMC - PubMed

Publication types