. 2021 Nov;18(11):2502-2515.
doi: 10.1038/s41423-021-00766-w. Epub 2021 Sep 14.

SRSF1 plays a critical role in invariant natural killer T cell development and function

Affiliations

SRSF1 plays a critical role in invariant natural killer T cell development and function

Jingjing Liu et al. Cell Mol Immunol. 2021 Nov.

Abstract

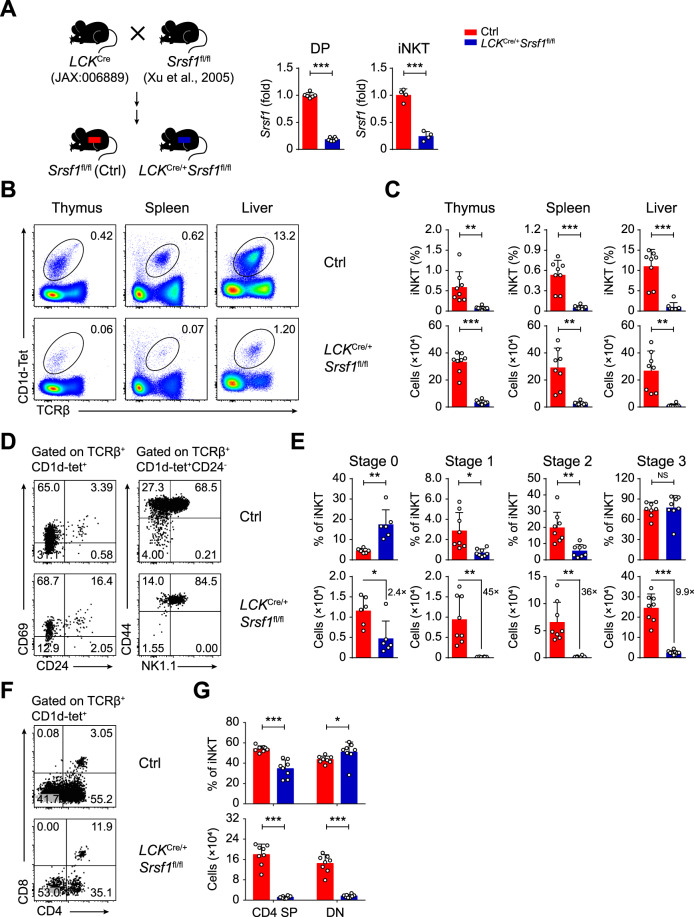
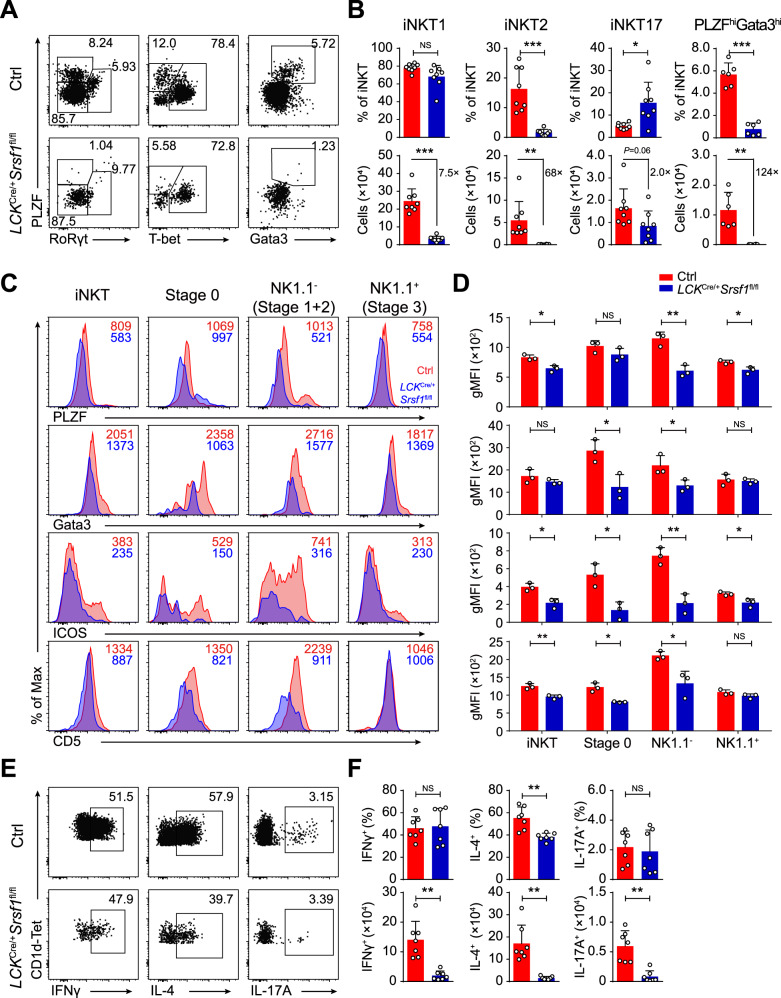
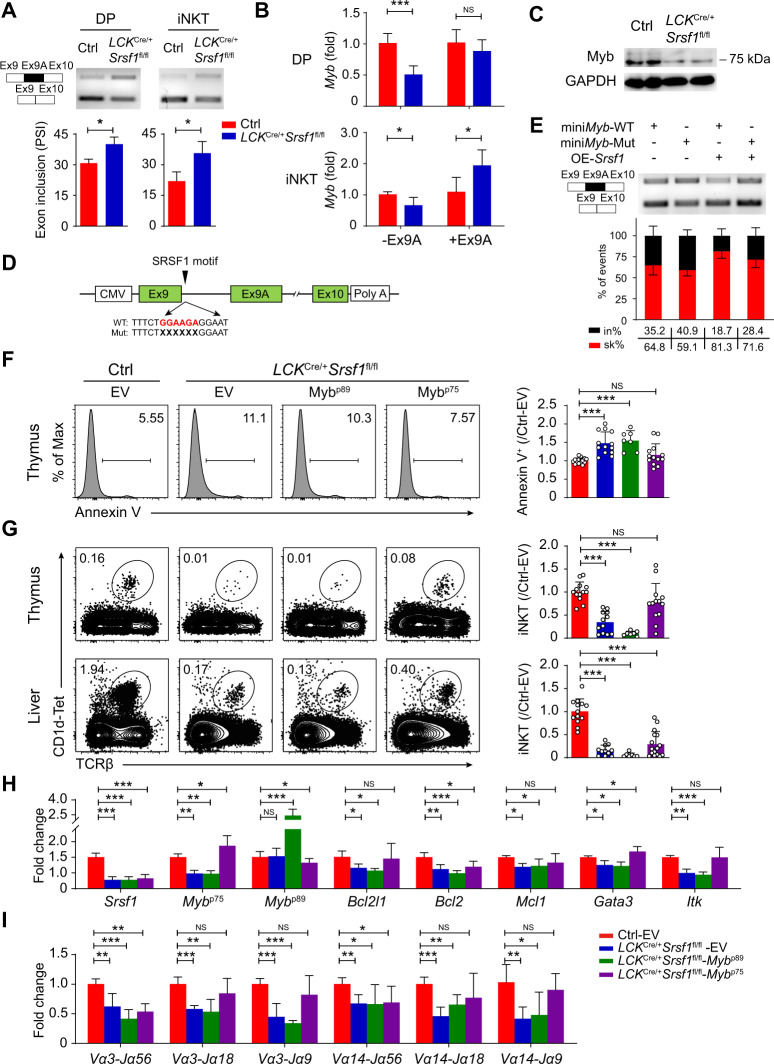
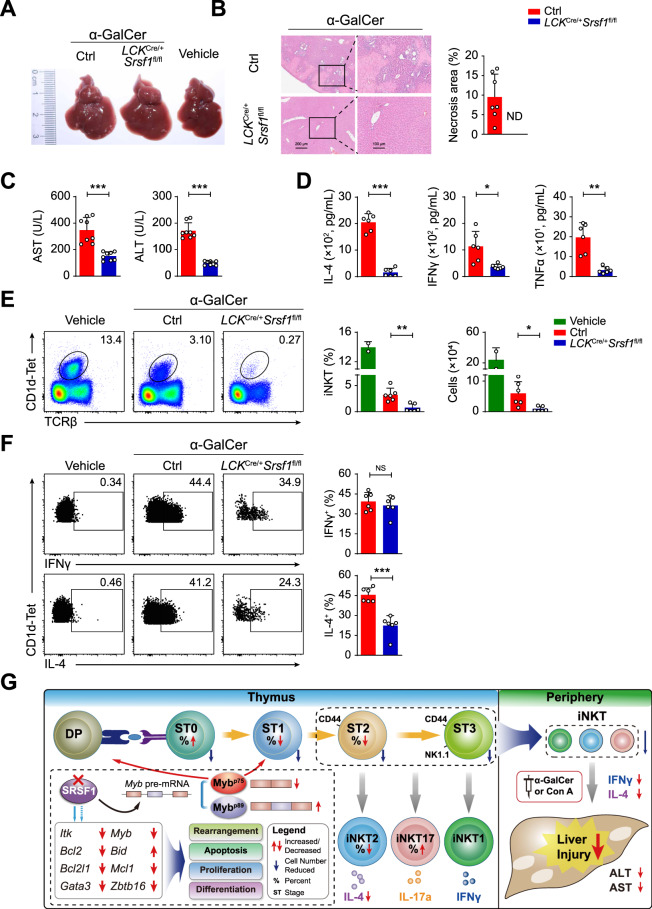
Invariant natural killer T (iNKT) cells are highly conserved innate-like T lymphocytes that originate from CD4+CD8+ double-positive (DP) thymocytes. Here, we report that serine/arginine splicing factor 1 (SRSF1) intrinsically regulates iNKT cell development by directly targeting Myb and balancing the abundance of short and long isoforms. Conditional ablation of SRSF1 in DP cells led to a substantially diminished iNKT cell pool due to defects in proliferation, survival, and TCRα rearrangement. The transition from stage 0 to stage 1 of iNKT cells was substantially blocked, and the iNKT2 subset was notably diminished in SRSF1-deficient mice. SRSF1 deficiency resulted in aberrant expression of a series of regulators that are tightly correlated with iNKT cell development and iNKT2 differentiation, including Myb, PLZF, Gata3, ICOS, and CD5. In particular, we found that SRSF1 directly binds and regulates pre-mRNA alternative splicing of Myb and that the expression of the short isoform of Myb is substantially reduced in SRSF1-deficient DP and iNKT cells. Strikingly, ectopic expression of the Myb short isoform partially rectified the defects caused by ablation of SRSF1. Furthermore, we confirmed that the SRSF1-deficient mice exhibited resistance to acute liver injury upon α-GalCer and Con A induction. Our findings thus uncovered a previously unknown role of SRSF1 as an essential post-transcriptional regulator in iNKT cell development and functional differentiation, providing new clinical insights into iNKT-correlated disease.

Keywords: Alternative splicing; Development; Function; Invariant natural killer T cell; SRSF1.


Conflict of interest statement

The authors declare no competing interests.

Figures

Fig. 1
Fig. 1
SRSF1 is dynamically expressed in iNKT cell subsets and potentially binds multiple iNKT-related genes. A Analysis of Srsf1 expression in various T cell subsets by published microarray data (GSE15907). B The expression level of Srsf1 in thymic iNKT cells is illustrated in dot plots by published single-cell RNA-seq data (GSE152786). Left: Uniform manifold approximation and projection (UMAP) of iNKT cells was colored by inferred cluster identity; middle: The expression of Srsf1 is plotted along a colorimetric gradient, with red corresponding to high expression; right: Violin plots showing the aggregate expression level of Srsf1 from Cluster 0 to Cluster 10. C Overlapping SRSF1-binding genes in thymocytes (GSE141349) and iNKT-related genes. Sixty overlapping genes were identified, and iNKT-associated regulators in each category are shown
Fig. 2
Fig. 2
Ablation of SRSF1 impairs the development of iNKT cells. A Schematic graphs showing the strategy for generating the mouse model (left). The source of each strain was marked. The LCKCre/+Srsf1fl/fl mice with conditional ablation of SRSF1 and littermate Srsf1fl/fl mice (ctrl) were used throughout the study. Srsf1 mRNA expression in thymic DP and iNKT cells (right) was analyzed with qPCR. The relative expression of Srsf1 (after normalization to Hprt1) in cells from the ctrl mice was arbitrarily set to one, and its relative expression in cells from the LCKCre/+Srsf1fl/fl mice was normalized accordingly (n ≥ 4). B, C Representative pseudocolor plots (B) showing TCRβ+CD1d-Tet+ iNKT cells from thymi, spleens, and livers. The frequency and numbers of each population are shown in (C) (n = 8). D, E Developmental stage analysis. A representative dot plot (D) shows CD24 and CD69 expression in total thymic iNKT cells; TCRβ+CD1d-Tet+CD24 cells were further analyzed by CD44 and NK1.1. The frequency and numbers of each stage are shown in (E) (n ≥ 6). F, G Flow cytometric analysis of CD4 and CD8 expression among TCRβ+CD1d-Tet+ cells in the thymus of the ctrl and LCKCre/+Srsf1fl/fl mice (F). Frequency and cell numbers of each subset were shown in (G) (n = 8). Data were pooled from at least three independent experiments. Statistical significance was determined by unpaired two-sided Student’s t test for normally distributed data, or an unpaired two-sided Welch’s t test was used when the variance between the groups was unequal. *P < 0.05; **P < 0.01; ***P < 0.001; NS denotes not significant. Data are the mean ± SD
Fig. 3
Fig. 3
SRSF1 is indispensable for iNKT cell functional differentiation. A, B Analysis of functional subsets in thymic iNKT cells. Representative dot plots (A) show iNKT1, iNKT2, iNKT17, and PLZFhiGata3hi cells. The frequency and numbers of the indicated subsets are shown in (B) (n ≥ 6). C, D Representative histograms (C) show the expression of PLZF, Gata3, ICOS, and CD5 in iNKT cells at distinct developmental stages by flow cytometry. The geometric mean fluorescence intensity (gMFI) of PLZF, Gata3, ICOS, and CD5 is shown in (D) (n = 3). E, F Representative dot plots (E) showing IFNγ+, IL-4+, and IL-17A+ populations in thymic iNKT cells stimulated in vitro with PMA and ionomycin for 4 h. Frequency and numbers are shown in (F) (n = 7). Data were pooled from at least two independent experiments. Statistical significance was determined by unpaired two-sided Student’s t test for normally distributed data, or an unpaired two-sided Welch’s t test was used when variance between the groups was unequal. *P < 0.05; **P < 0.01; ***P < 0.001; NS denotes not significant. Data are the mean ± SD
Fig. 4
Fig. 4
SRSF1 deficiency impairs proliferation, survival, and TCRα rearrangement in iNKT and DP cells. A, B Proliferation assay. Representative dot plot (A) and frequency (B) of BrdU+ cells are shown in DP thymocytes and total; stage 0, NK1.1 (stage 1 and 2), and NK1.1+ (stage 3) thymic iNKT cells, respectively (n = 6). C, D Apoptosis assay. Representative histogram (C) and frequency (D) of Annexin V+ cells are shown in DP thymocytes and total; stage 0, NK1.1 (stage 1 and 2), and NK1.1+ (stage 3) thymic iNKT cells, respectively (n = 6). E Apoptosis-related gene expression in DP thymocytes. The relative expression of each transcript was normalized as described in Fig. 2A (n = 6). F Analysis of the expression of genes related to the TCR signaling response in thymic iNKT cells. The relative expression of each transcript was normalized accordingly as described in Fig. 2A (n = 6). G Schematic graph showing selected proximal, central, and distal Vα and Jα segments. H Analysis of transcripts of Vα to Jα rearrangements (constant α-region) segments and Vα14 and Vα3 rearrangements to Jα56, Jα18, or Jα9 by sorted DP thymocytes, presented relative to the expression of Hprt1 transcript (n = 6). I qPCR analysis of rearrangement-related gene expression in DP thymocytes. The relative expression of each transcript was normalized accordingly as described above (n = 6). Data were pooled from at least three independent experiments. Statistical significance was determined by unpaired two-sided Student’s t test for normally distributed data, or an unpaired two-sided Welch’s t test was used when variance between the groups was unequal. *P < 0.05; **P < 0.01; ***P < 0.001; NS denotes not significant. Data are the mean ± SD
Fig. 5
Fig. 5
SRSF1 modulates the expression of a series of iNKT cell-related genes. A Volcano plot depicting SRSF1-regulated genes in DP thymocytes. Differentially expressed genes (DEGs) were identified from LCKCre/+Srsf1fl/fl versus ctrl samples (blue: downregulated; red: upregulated; gray: unchanged). B Representative Gene Ontology (GO) terms of the biological process categories enriched in DEGs. C Heatmap showing representative DEGs. D Quantification of selected DEGs in DP thymocytes. The relative expression of each transcript was normalized accordingly as described in Fig. 2A (n = 6). Data were pooled from three independent experiments. Statistical significance was determined by unpaired two-sided Student’s t test for normally distributed data, or an unpaired two-sided Welch’s t test was used when variance between the groups was unequal. *P < 0.05; **P < 0.01; ***P < 0.001; NS denotes not significant. Data are the mean ± SD. E Bar chart showing SRSF1-regulated alternative splicing (AS) events in DP thymocytes, classified into five categories: skipped exon (SE), retained intron (RI), mutually exclusive exon (MXE), alternative 5’ splice site (A5SS), and alternative 3’ splice site (A3SS). F Venn diagram showing the overlapping genes of DEGs in (A) and AS genes in (E) and SRSF1-binding genes in Fig. 1C. G Analysis of Myb expression and exon-exon junctions. “Sashimi plots” show read coverage and exon-exon junctions (numbers on arches indicate junction reads), and the alternative exons are shaded with yellow columns. The lower panel indicates SRSF1-binding sites identified by CLIP-seq. The black inverted triangle denotes the SRSF1-binding site in introns 9–10 of Myb pre-mRNA. H Analysis of Myb-binding genes (ChIP-seq, GSE66122) correlated with iNKT cells. Red dots represent iNKT cell development-related genes, green dots represent iNKT cell function- and effector differentiation-related genes, and blue dots denote apoptosis-related genes
Fig. 6
Fig. 6
SRSF1-mediated alternative splicing of Myb mRNA controls iNKT cell formation. A Semiquantitative PCR validation of AS of Myb in DP and iNKT cells. The structure of PCR products is indicated schematically on the left. Alternative exon 9A is marked with black. Cumulative data are shown in the lower panel (n = 3). B qPCR analysis of the ratio of Myb transcripts with exon 9A (+Ex9A) and without exon 9A (−Ex9A) in DP and iNKT cells. The relative expression of each transcript was normalized accordingly as described in Fig. 2A (n ≥ 5). C Western blot analysis of the protein level of Myb in DP thymocytes. D Graphical representation of Myb minigenes. The black arrow denotes the SRSF1-binding site in intron 9 of Myb. The potential SRSF1-binding motif is marked in red characters, and the specific deletion mutations are indicated with multiple “X”. E Constructs with (WT) or without (Mut) SRSF1-binding site were applied for splicing assays with/without SRSF1 overexpression (OE) in HEK293T cells. The percentages of inclusion (in%, black) and skipping (sk%, red) within exon 9A of Myb transcripts are presented (n = 5). F Apoptosis of DP thymocytes in chimeras with forced expression of Mybp75 or Mybp89. Annexin V+ donor-derived DP cells in thymi from recipients were detected. Representative dot plot and the ratio (the frequency of ctrl-EV was set to one) of Annexin V+ cells in DP thymocytes are shown (n ≥ 7). G Analysis of iNKT cells in chimeras with forced expression of Mybp75 or Mybp89. Donor-derived iNKT cells in thymi and livers from recipients were detected. Representative dot plot and the ratio (the frequency of ctrl-EV was set to one) of iNKT cells are shown (n ≥ 7). H, I Analysis of the expression of genes impaired by ablation of SRSF1 (H) and TCRα rearrangement (I) in chimeric DP thymocytes. The relative expression of each transcript was normalized accordingly as described in Fig. 2A (n = 5). Data are pooled from at least three independent experiments. Statistical significance was determined by unpaired two-sided Student’s t test for normally distributed data, or an unpaired two-sided Welch’s t test was used when variance between the groups was unequal. For multiple comparisons, data were analyzed by one-way ANOVA. *P < 0.05; **P < 0.01; ***P < 0.001; NS denotes not significant. Data are the mean ± SD
Fig. 7
Fig. 7
SRSF1-deficient mice exhibit resistance to α-GalCer-induced liver injury. A Representative images of livers at 3 d post-α-GalCer injection. The white spots are indicative of severe necrosis observed in the ctrl. B H&E staining of liver sections at 24 h post-α-GalCer injection. The percentages of necrotic areas are shown on the right (n = 7). C AST and ALT levels in serum were measured at 12 h post-α-GalCer injection (n = 8). D IL-4, IFNγ, and TNFα levels in serum were measured by ELISA at 2 h post i.v. injection with 30 ng α-GalCer (n = 6). E Representative pseudocolor plots showing iNKT cells in livers at 2 h post-injection with α-GalCer or vehicle. The frequency and numbers of iNKT cells are shown accordingly (vehicle: n = 2; Ctrl: n = 6; LCKCre/+Srsf1fl/fl: n = 6). F IL-4 and IFNγ in liver iNKT cells were measured by ICS. The frequency was shown accordingly (n = 6). G Proposed working model. A schematic illustration showed that SRSF1 promotes iNKT cell development via post-transcriptionally regulating genes involved in TCRα arrangement, survival, proliferation, and functional differentiation. In particular, SRSF1-mediated AS of Myb pre-mRNA is crucial for normal iNKT cell development. Due to a diminished iNKT cell pool in the periphery and reduced cytokine secretion, SRSF1-deficient mice exhibit slight clinical symptoms in acute liver injury upon α-GalCer or Con An induction. Data were pooled from at least two independent experiments. Statistical significance was determined by unpaired two-sided Student’s t test for normally distributed data, or an unpaired two-sided Welch’s t test was used when variance between the groups was unequal. *P < 0.05; **P < 0.01; ***P < 0.001; NS denotes not significant. Data are the mean ± SD

References

    1. Pellicci DG, Koay HF, Berzins SP. Thymic development of unconventional T cells: how NKT cells, MAIT cells and gammadelta T cells emerge. Nat Rev Immunol. 2020;12:756–70. doi: 10.1038/s41577-020-0345-y. - DOI - PubMed
    1. Lantz O, Bendelac A. An invariant T cell receptor alpha chain is used by a unique subset of major histocompatibility complex class I-specific CD4+ and CD4-8- T cells in mice and humans. J Exp Med. 1994;180:1097–106. doi: 10.1084/jem.180.3.1097. - DOI - PMC - PubMed
    1. Adachi Y, Koseki H, Zijlstra M, Taniguchi M. Positive selection of invariant V alpha 14+ T cells by non-major histocompatibility complex-encoded class I-like molecules expressed on bone marrow-derived cells. Proc Natl Acad Sci USA. 1995;92:1200–4. doi: 10.1073/pnas.92.4.1200. - DOI - PMC - PubMed
    1. Kawano T, Cui J, Koezuka Y, Toura I, Kaneko Y, Motoki K, et al. CD1d-restricted and TCR-mediated activation of valpha14 NKT cells by glycosylceramides. Science. 1997;278:1626–9. doi: 10.1126/science.278.5343.1626. - DOI - PubMed
    1. Beckman EM, Porcelli SA, Morita CT, Behar SM, Furlong ST, Brenner MB. Recognition of a lipid antigen by CD1-restricted alpha beta+ T cells. Nature. 1994;372:691–4. doi: 10.1038/372691a0. - DOI - PubMed

Publication types

MeSH terms

Substances