

Plasma Metabolomic Profiles in Recovered COVID-19 Patients without Previous Underlying Diseases 3 Months After Discharge
- PMID: 34522117
- PMCID: PMC8434912
- DOI: 10.2147/JIR.S325853
Plasma Metabolomic Profiles in Recovered COVID-19 Patients without Previous Underlying Diseases 3 Months After Discharge
Abstract
Background: It remains unclear whether discharged COVID-19 patients have fully recovered from severe complications, including the differences in the post-infection metabolomic profiles of patients with different disease severities.
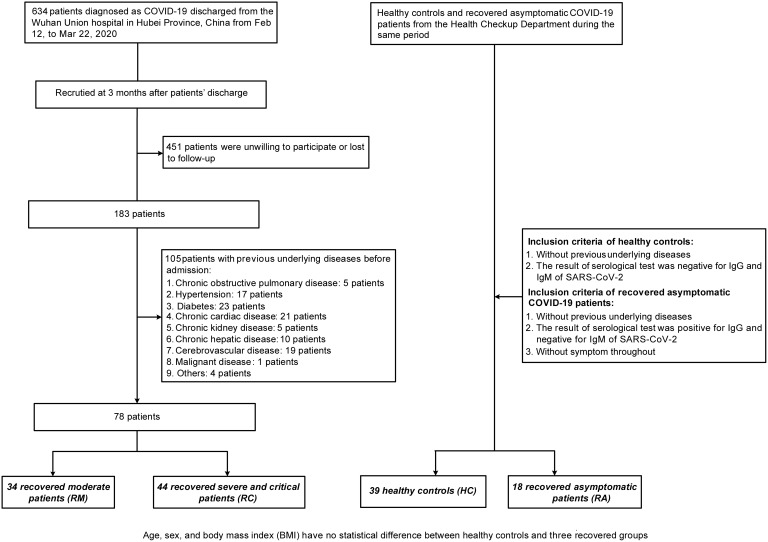
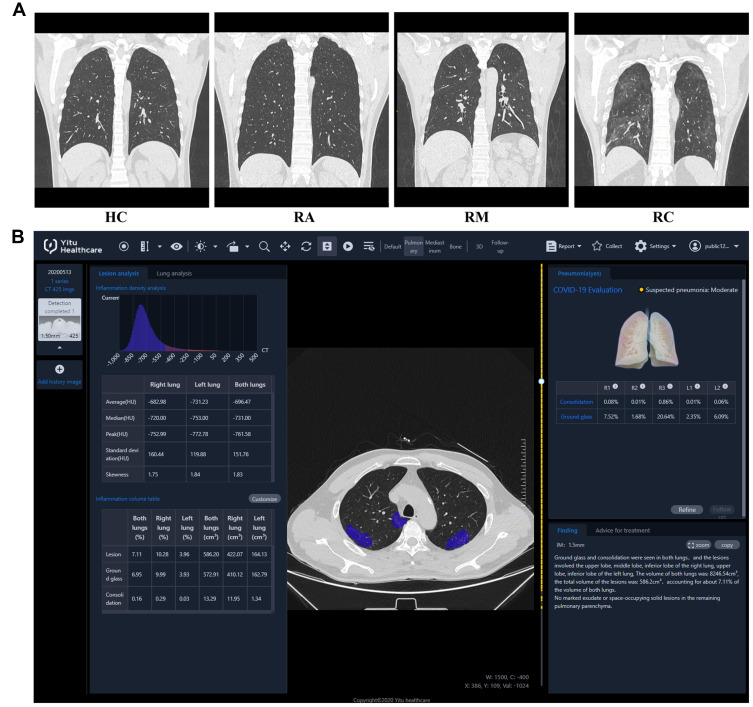
Methods: COVID-19-recovered patients, who had no previous underlying diseases and were discharged from Wuhan Union Hospital for 3 months, and matched healthy controls (HCs) were recruited in this prospective cohort study. We examined the blood biochemical indicators, cytokines, lung computed tomography scans, including 39 HCs, 18 recovered asymptomatic (RAs), 34 recovered moderate (RMs), and 44 recovered severe/ critical patients (RCs). A liquid chromatography-mass spectrometry-based metabolomics approach was employed to profile the global metabolites of fasting plasma of these participants.
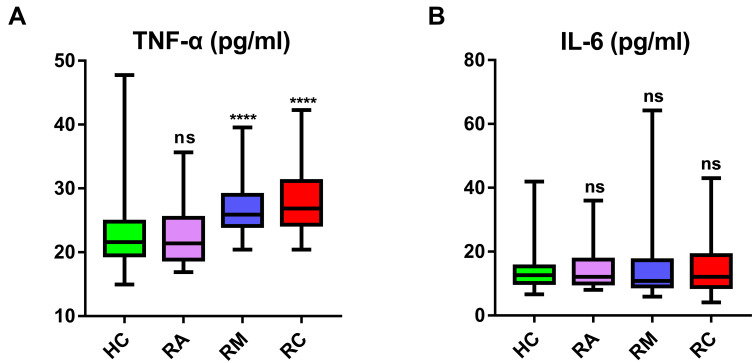
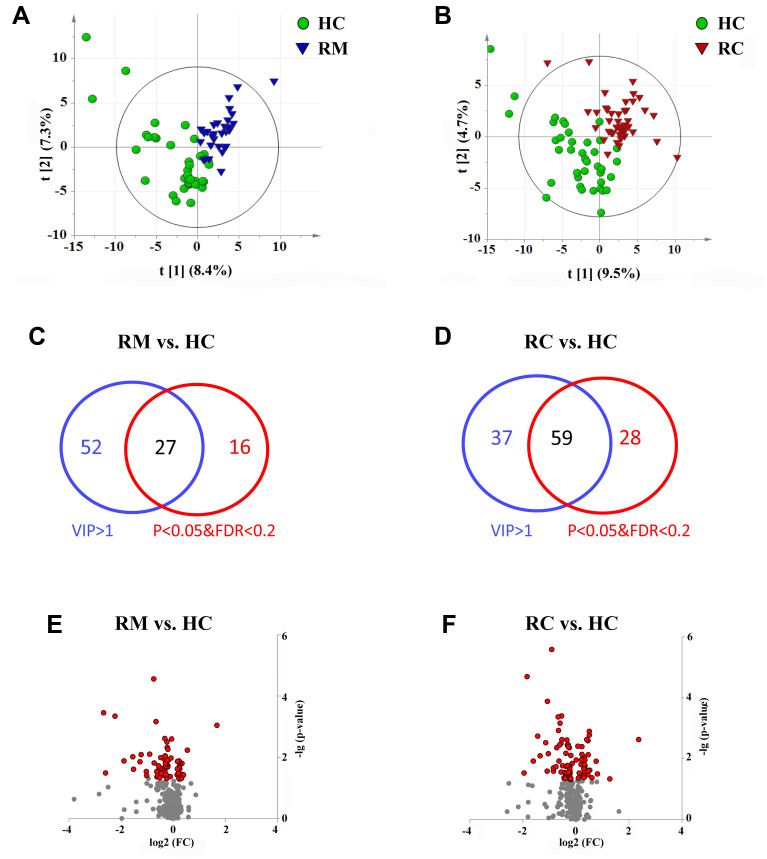
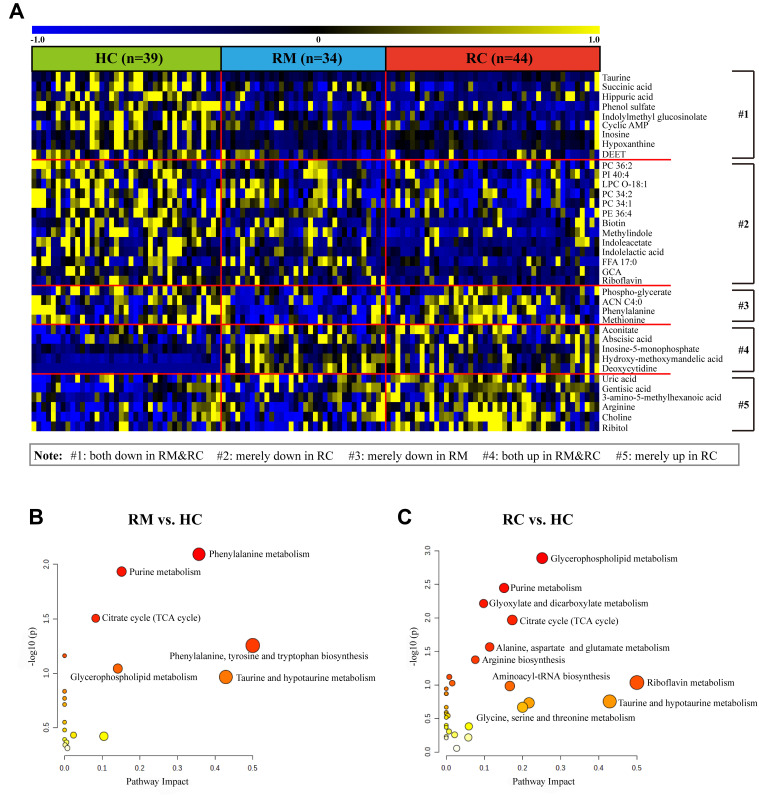
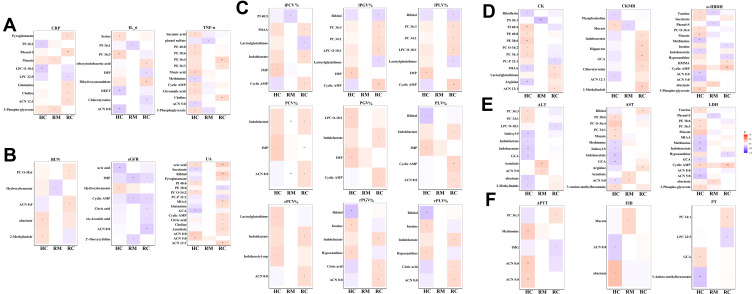
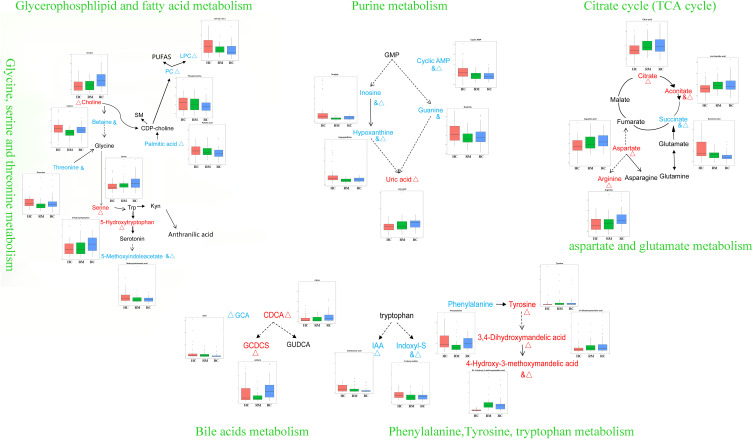
Results: Clinical data and metabolomic profiles suggested that RAs recovered well, but some clinical indicators and plasma metabolites in RMs and RCs were still abnormal as compared with HCs, such as decreased taurine, succinic acid, hippuric acid, some indoles, and lipid species. The disturbed metabolic pathway mainly involved the tricarboxylic cycle, purine, and glycerophospholipid metabolism. Moreover, metabolite alterations differ between RMs and RCs when compared with HCs. Correlation analysis revealed that many differential metabolites were closely associated with inflammation and the renal, pulmonary, heart, hepatic, and coagulation system functions.
Conclusion: We uncovered metabolite clusters pathologically relevant to the recovery state in discharged COVID-19 patients which may provide new insights into the pathogenesis of potential organ damage in recovered patients.
Keywords: COVID-19; metabolomics; recovery.
© 2021 Zhang et al.
Conflict of interest statement
The authors declare there is no conflict of interest or financial relationships to disclose.
Figures
Similar articles
-
Lipid metabolism of plasma-derived small extracellular vesicles in COVID-19 convalescent patients.Sci Rep. 2023 Oct 3;13(1):16642. doi: 10.1038/s41598-023-43189-5. Sci Rep. 2023. PMID: 37789017 Free PMC article.
-
Plasma Metabolomic Profiling of Patients Recovered From Coronavirus Disease 2019 (COVID-19) With Pulmonary Sequelae 3 Months After Discharge.Clin Infect Dis. 2021 Dec 16;73(12):2228-2239. doi: 10.1093/cid/ciab147. Clin Infect Dis. 2021. PMID: 33596592 Free PMC article.
-
Inflammatory Profiles and Clinical Features of Coronavirus 2019 Survivors 3 Months After Discharge in Wuhan, China.J Infect Dis. 2021 Nov 16;224(9):1473-1488. doi: 10.1093/infdis/jiab181. J Infect Dis. 2021. PMID: 33822106 Free PMC article.
-
Comparison of Residual Pulmonary Abnormalities 3 Months After Discharge in Patients Who Recovered From COVID-19 of Different Severity.Front Med (Lausanne). 2021 Jun 25;8:682087. doi: 10.3389/fmed.2021.682087. eCollection 2021. Front Med (Lausanne). 2021. PMID: 34249973 Free PMC article.
-
Convalescent plasma or hyperimmune immunoglobulin for people with COVID-19: a rapid review.Cochrane Database Syst Rev. 2020 May 14;5(5):CD013600. doi: 10.1002/14651858.CD013600. Cochrane Database Syst Rev. 2020. Update in: Cochrane Database Syst Rev. 2020 Jul 10;7:CD013600. doi: 10.1002/14651858.CD013600.pub2. PMID: 32406927 Free PMC article. Updated.
Cited by
-
Metabolomic Profile, Plasmatic Levels of Losartan and EXP3174, Blood Pressure Control in Hypertensive Patients and Their Correlation with COVID-19.Pharmaceuticals (Basel). 2023 Sep 13;16(9):1290. doi: 10.3390/ph16091290. Pharmaceuticals (Basel). 2023. PMID: 37765098 Free PMC article.
-
The impact of supervised physical exercise on chemokines and cytokines in recovered COVID-19 patients.Front Immunol. 2023 Jan 4;13:1051059. doi: 10.3389/fimmu.2022.1051059. eCollection 2022. Front Immunol. 2023. PMID: 36685603 Free PMC article.
-
What might COVID-19 patients experience after recovery? A comprehensive review.Int J Pharm Pract. 2022 Nov 4;30(5):404-413. doi: 10.1093/ijpp/riac026. Int J Pharm Pract. 2022. PMID: 35881153 Free PMC article. Review.
-
Serum metabolomic abnormalities in survivors of non-severe COVID-19.Heliyon. 2022 Sep;8(9):e10473. doi: 10.1016/j.heliyon.2022.e10473. Epub 2022 Sep 1. Heliyon. 2022. PMID: 36065322 Free PMC article.
-
A metabolic readout of the urine metabolome of COVID-19 patients.Metabolomics. 2023 Jan 24;19(2):7. doi: 10.1007/s11306-023-01971-6. Metabolomics. 2023. PMID: 36694097 Free PMC article.
References
-
- WHO. Coronavirus disease (COVID-19) dashboard; 2021. Available from:https://covid19.who.int. Accessed August16, 2021.
LinkOut - more resources
Full Text Sources
