. 2021 Jul 25;11(18):8624-8639.
doi: 10.7150/thno.48561. eCollection 2021.

Angiotensin IV attenuates diabetic cardiomyopathy via suppressing FoxO1-induced excessive autophagy, apoptosis and fibrosis

Affiliations

Angiotensin IV attenuates diabetic cardiomyopathy via suppressing FoxO1-induced excessive autophagy, apoptosis and fibrosis

Meng Zhang et al. Theranostics. .

Abstract

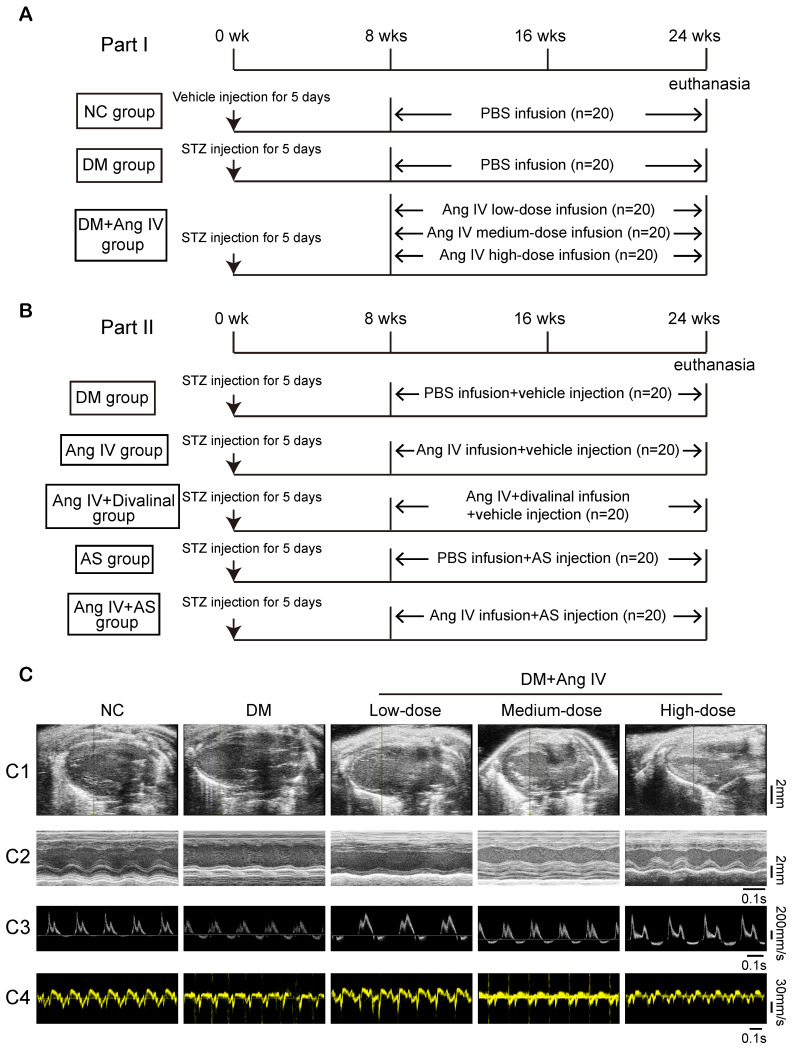
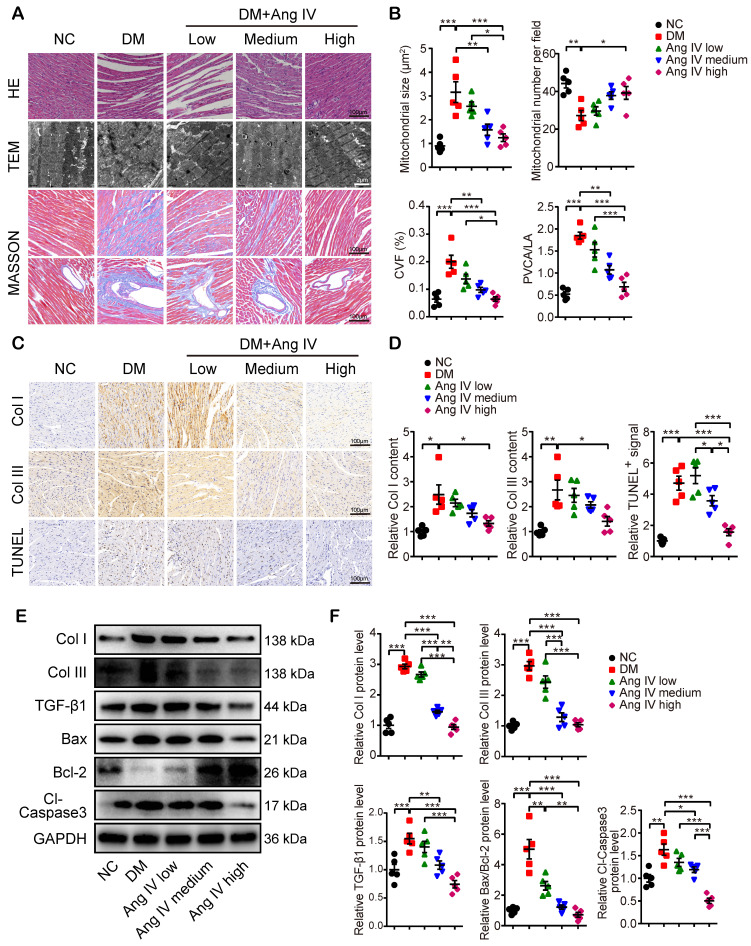
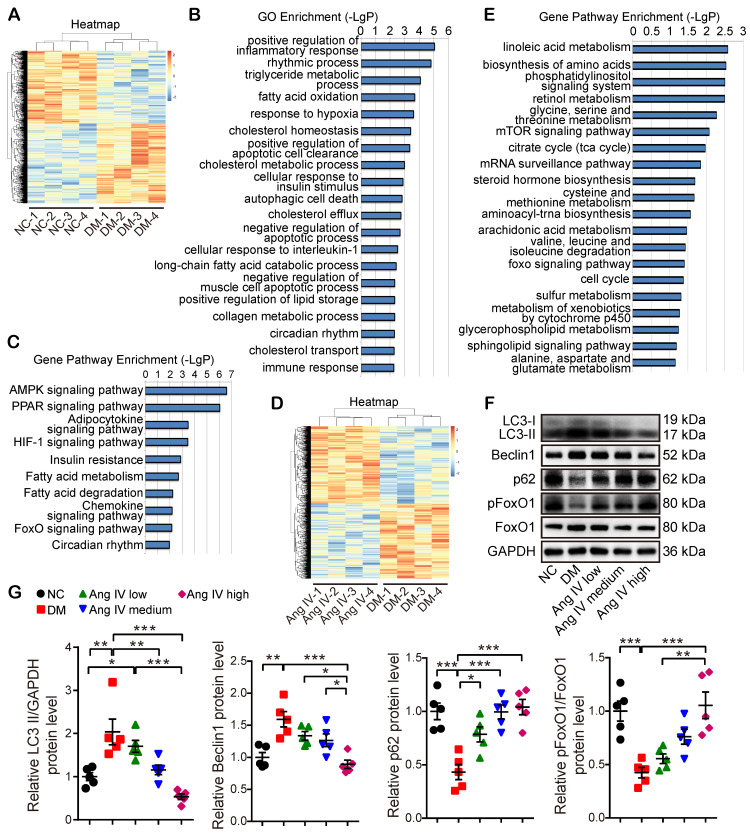
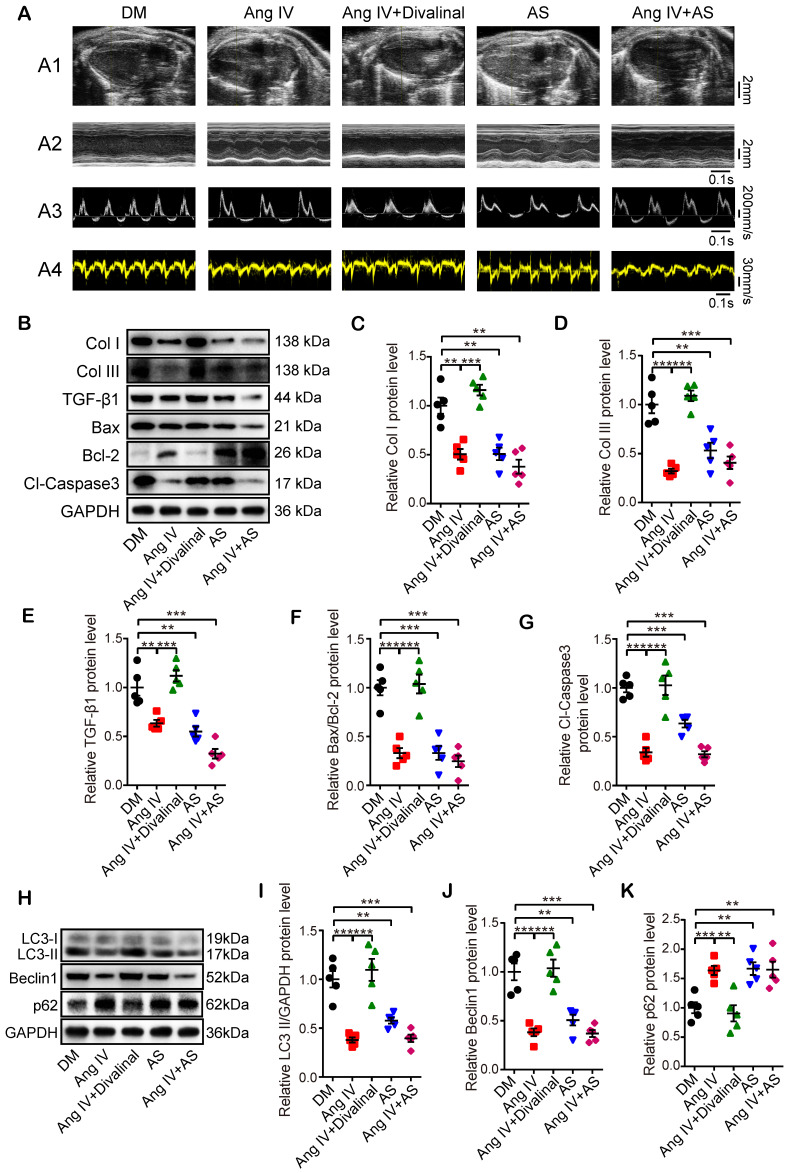
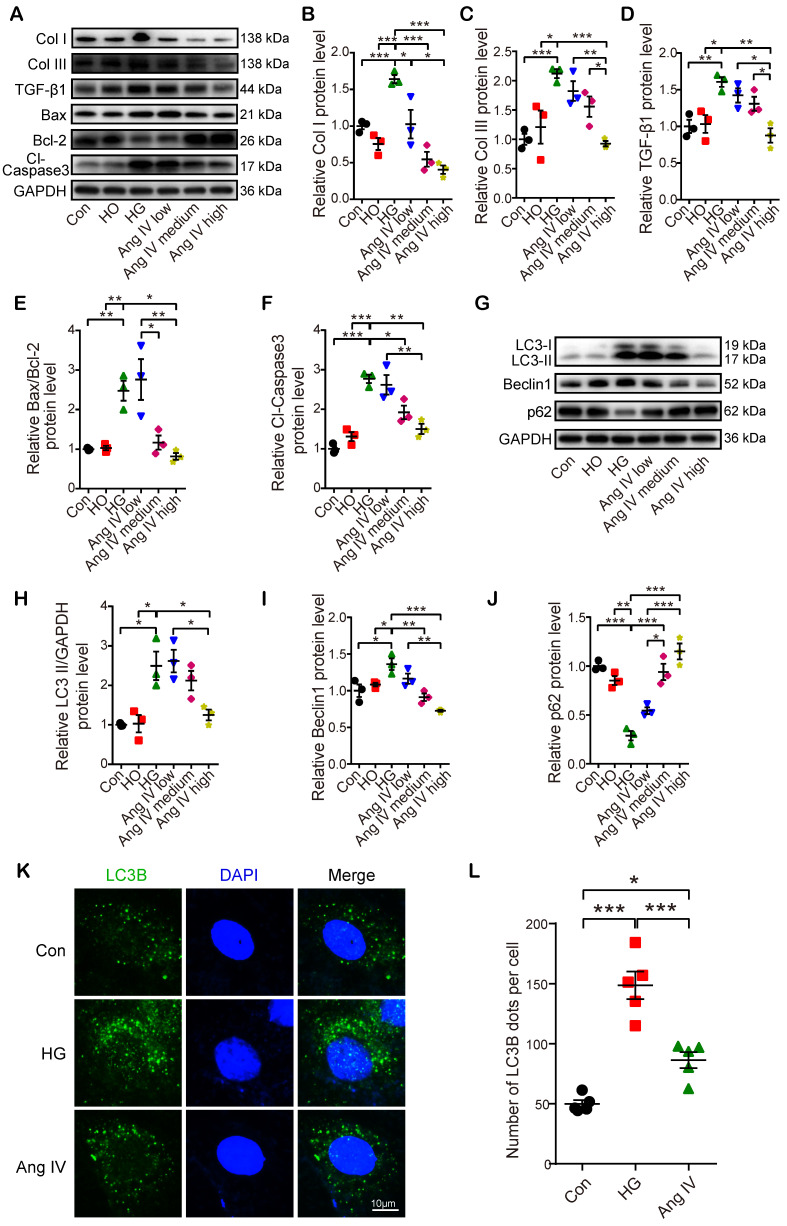
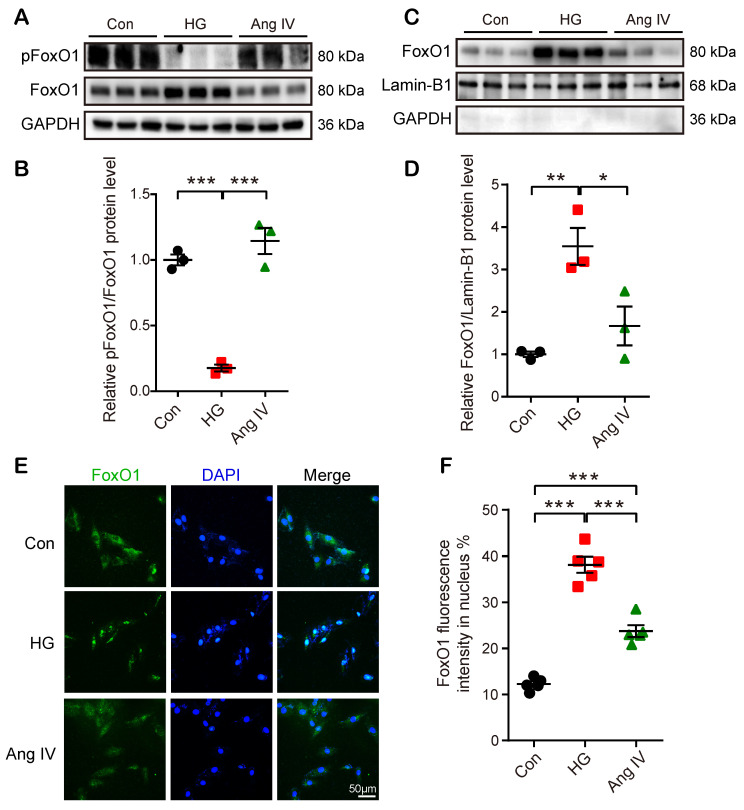
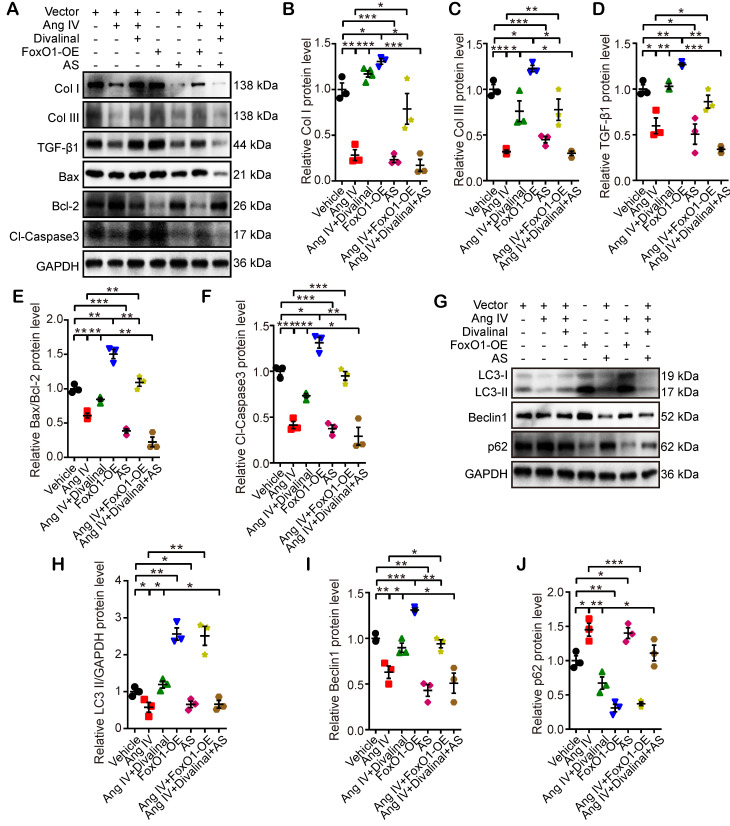
Rationale: The rennin-angiotensin-aldosterone system (RAAS) plays a critical role in the pathogenesis of diabetic cardiomyopathy, but the role of a member of RAAS, angiotensin IV (Ang IV), in this disease and its underlying mechanism are unclear. This study was aimed to clarify the effects of Ang IV and its downstream mediator forkhead box protein O1 (FoxO1) on diabetic cardiomyopathy. Methods:In vivo, diabetic mice were treated with low-, medium- and high-dose Ang IV, AT4R antagonist divalinal, FoxO1 inhibitor AS1842856 (AS), or their combinations. In vitro, H9C2 cardiomyocytes and cardiac fibroblasts were treated with different concentrations of glucose, low-, medium- and high-dose Ang IV, divalinal, FoxO1-overexpression plasmid (FoxO1-OE), AS, or their combinations. Results: Ang IV treatment dose-dependently attenuated left ventricular dysfunction, fibrosis, and myocyte apoptosis in diabetic mice. Besides, enhanced autophagy and FoxO1 protein expression by diabetes were dose-dependently suppressed by Ang IV treatment. However, these cardioprotective effects of Ang IV were completely abolished by divalinal administration. Bioinformatics analysis revealed that the differentially expressed genes were enriched in autophagy, apoptosis, and FoxO signaling pathways among control, diabetes, and diabetes+high-dose Ang IV groups. Similar to Ang IV, AS treatment ameliorated diabetic cardiomyopathy in mice. In vitro, high glucose stimulation increased collagen expression, apoptosis, overactive autophagy flux and FoxO1 nuclear translocation in cardiomyocytes, and upregulated collagen and FoxO1 expression in cardiac fibroblasts, which were substantially attenuated by Ang IV treatment. However, these protective effects of Ang IV were completely blocked by the use of divalinal or FoxO1-OE, and these detrimental effects were reversed by the additional administration of AS. Conclusions: Ang IV treatment dose-dependently attenuated left ventricular dysfunction and remodeling in a mouse model of diabetic cardiomyopathy, and the mechanisms involved stimulation of AT4R and suppression of FoxO1-mediated fibrosis, apoptosis, and overactive autophagy.

Keywords: FoxO1; angiotensin IV; autophagy; diabetic cardiomyopathy.


Conflict of interest statement

Competing Interests: The authors have declared that no competing interest exists.

Figures

Figure 1
Figure 1
The protocol of in vivo experiments and effect of Ang IV on left ventricular function in 5 groups of mice. (A) Animal grouping and timeline of the first part of the in vivo experiment. (B) Animal grouping and timeline of the second part of the in vivo experiment. (C) Representative echocardiographic images in 5 groups of mice. (C1) Two-dimensional echocardiograms showing left ventricular long-axis views, scale bar in mm on the right; (C2) M-mode echocardiograms showing left ventricular dimensions and scale bar in mm on the right, and time stamp in seconds at the bottom; (C3) Pulse-wave Doppler echocardiograms depicting mitral inflow velocities, scale bar in mm/s on the right, and time stamp in seconds at the bottom; (C4) Tissue Doppler echocardiograms displaying mitral annular velocities, scale bar in mm/s on the right, and time stamp in seconds at the bottom. Ang IV: angiotensin IV; AS: FoxO1 inhibitor AS1842856; DM: diabetes mellitus; NC: normal control; STZ: streptozotocin; wks: weeks.
Figure 2
Figure 2
Effects of Ang IV on myocardial morphology, fibrosis and apoptosis in 5 groups of mice. (A) Representative images of H&E staining, TEM, and Masson's trichrome staining of the myocardium in 5 groups of mice. (B) Quantification of mitochondrial size, mitochondrial number per field, CVF and PVCA/LA in 5 groups of mice. (C) Representative immunohistochemical staining of Col I, Col III, and TUNEL in the myocardium of 5 groups of mice. (D) Quantification of immunohistochemical staining of Col I, Col III, and TUNEL in the myocardium of 5 groups of mice. (E) Representative Western blot images of Col I, Col III, TGF-β1, Bax, Bcl-2 and Cl-caspase3 expressions in the myocardium of the 5 groups of mice. (F) Quantification of the protein expressions of Col I, Col III, TGF-β1, Bax/Bcl-2 and Cl-caspase3 in the myocardium of the 5 groups of mice. n=5 per group. Ang IV: angiotensin IV; Cl-caspase3: cleaved caspase 3; Col I: collagen I; Col III: collagen III; DM: diabetes mellitus; NC: normal control. *p < 0.05, **p < 0.01, ***p < 0.001.
Figure 3
Figure 3
Transcriptome profiles of the myocardium in 3 groups of mice and effects of Ang IV on the expressions of autophagy-associated proteins in the myocardium of 5 groups of mice. (A) Hierarchical clustering heatmap to identify differentially expressed genes in NC and DM groups of mice. (B) The top 20 biological processes from the GO enrichment analysis of differentially expressed genes in NC and DM groups of mice. (C) The top 10 gene pathways from KEGG pathway enrichment analysis of differentially expressed genes in NC and DM groups of mice. (D) Hierarchical clustering heatmap to identify differentially expressed genes in DM and DM+high-dose Ang IV groups of mice. (E) The top 20 gene pathways from KEGG pathway enrichment analysis of differentially expressed genes in DM and DM+high-dose Ang IV groups of mice. n=4 per group. (F) Representative Western blot images of LC3, Beclin1, p62, pFoxO1 and FoxO1 protein expression in the myocardium of the 5 groups of mice. (G) Quantification of LC3-II, Beclin1, p62 and pFoxO1/FoxO1 protein expression in the myocardium of the 5 groups of mice. n=5 per group. Ang IV: angiotensin IV; DM: diabetes mellitus; NC: normal control. *p < 0.05, **p < 0.01, ***p < 0.001.
Figure 4
Figure 4
Effects of AT4R and FoxO1 on left ventricular function and expressions of fibrosis-, apoptosis- and autophagy-associated proteins in the myocardium of 5 groups of mice. (A) Representative echocardiographic images in 5 groups of mice. (A1) Two-dimensional echocardiograms showing left ventricular long-axis views and scale bar in mm on the right; (A2) M-mode echocardiograms showing left ventricular dimensions, scale bar in mm on the right, and time stamp in seconds at the bottom; (A3) Pulse-wave Doppler echocardiograms depicting mitral inflow velocities, scale bar in mm/s on the right, and time stamp in seconds at the bottom; (A4) Tissue Doppler echocardiograms displaying mitral annular velocities, scale bar in mm/s on the right, and time stamp in seconds at the bottom. n≥8 per group. (B) Representative Western blot images of Col I, Col III, TGF-β1, Bax, Bcl-2 and Cl-caspase3 protein expressions in the myocardium of 5 groups of mice. (C-G) Quantifications of Col I, Col III, TGF-β1, Bax/Bcl-2 and Cl-caspase3 protein expressions in the myocardium of 5 groups of mice. (H) Representative Western blot images of LC3, Beclin1 and p62 expressions in the myocardium of 5 groups of mice. (I-K) Quantification of LC3-II, Beclin1 and p62 expressions in the myocardium of 5 groups of mice. After DM was successfully induced, mice were divided into the following 5 groups: DM group that received an infusion of vehicle alone, Ang IV group that received an infusion of high-dose Ang IV, Ang IV+divalinal group that received an infusion of high-dose Ang IV plus AT4R antagonist divalinal, AS group that received an infusion of FoxO1 inhibitor AS1842856, and Ang IV+AS group that received an infusion of Ang IV plus AS1842856. n=5 per group. Ang IV: angiotensin IV; AS: AS1842856; Cl-caspase3: cleaved caspase 3; Col I: collagen I; Col III: collagen III. *p < 0.05, **p < 0.01, ***p < 0.001.
Figure 5
Figure 5
Effects of Ang IV on the expressions of fibrosis-, apoptosis- and autophagy-associated markers and autophagy flux in cardiomyocytes. (A) Representative Western blot images of Col I, Col III, TGF-β1, Bax, Bcl-2 and Cl-caspase3 in 6 groups of cells. (B-F) Quantification of Col I, Col III, TGF-β1, Bax/Bcl-2 and Cl-caspase3 expressions in 6 groups of cells. (G) Representative Western blot images of LC3, Beclin1 and p62 in 6 groups of cells. (H-J) Quantification of LC3-II, Beclin1 and p62 expressions in 6 groups of cells. n=3 per group. (K) Representative images of immunofluorescent staining of LC3B in 3 groups of cells. (L) Quantification of immunofluorescent staining of LC3B in 3 groups of cells. n=5 per group. Ang IV: angiotensin IV; Cl-caspase3: cleaved caspase 3; Con: normal glucose control; Col I: collagen I; Col III: collagen III; HG: high glucose; HO: high osmotic control. *p < 0.05, **p < 0.01, ***p < 0.001.
Figure 6
Figure 6
Effects of Ang IV on FoxO1 phosphorylation and nuclear translocation in cardiomyocytes. (A) Representative Western blot images of pFoxO1 and FoxO1 expression in 3 groups of cells. (B) Quantification of pFoxO1/FoxO1 ratio in 3 groups of cells. n=3 per group. (C) Representative Western blot images of nuclear FoxO1 and nuclear internal control expressions in 3 groups of cells. (D) Quantification of nuclear FoxO1 in 3 groups of cells. n=3 per group. (E) Representative images of immunofluorescent staining of FoxO1 in 3 groups of cells. (F) Quantification of immunofluorescent staining of FoxO1 in 3 groups of cells. n=5 per group. Ang IV: angiotensin IV; Con: normal glucose control; HG: high glucose. *p < 0.05, **p < 0.01, ***p < 0.001.
Figure 7
Figure 7
Effects of FoxO1 and AT4R on the expressions of fibrosis-, apoptosis- and autophagy-associated proteins in cardiomyocytes. (A) Representative Western blot images of Col I, Col III, TGF-β1, Bax, Bcl-2 and Cl-caspase3 in 7 groups of cells. (B-F) Quantification of Col I, Col III, TGF-β1, Bax/Bcl-2 and Cl-caspase3 expressions in 7 groups of cells. (G) Representative Western blot images of LC3, Beclin1 and p62 in 7 groups of cells. (H-J) Quantification of LC3-II, Beclin1 and p62 expressions in 7 groups of cells. n=3 per group. Ang IV: angiotensin IV; AS: AS1842856; Cl-caspase3: cleaved caspase 3; Col I: collagen I; Col III: collagen III; FoxO1-OE: FoxO1 overexpression. *p < 0.05, **p < 0.01, ***p < 0.001.

References

    1. Lehrke M, Marx N. Diabetes mellitus and heart failure. Am J Med. 2017;130:S40–S50. - PubMed
    1. Weng J, Zhou Z, Guo L, Zhu D, Ji L, Luo X. et al. Incidence of type 1 diabetes in China, 2010-13: population based study. BMJ. 2018;360:j5295. - PMC - PubMed
    1. Li X, Wu Y, Zhao J, Wang H, Tan J, Yang M. et al. Distinct cardiac energy metabolism and oxidative stress adaptations between obese and non-obese type 2 diabetes mellitus. Theranostics. 2020;10:2675–95. - PMC - PubMed
    1. Evangelista I, Nuti R, Picchioni T, Dotta F, Palazzuoli A. Molecular dysfunction and phenotypic derangement in diabetic cardiomyopathy. Int J Mol Sci. 2019. 20. - PMC - PubMed
    1. Hu L, Ding M, Tang D, Gao E, Li C, Wang K. et al. Targeting mitochondrial dynamics by regulating Mfn2 for therapeutic intervention in diabetic cardiomyopathy. Theranostics. 2019;9:3687–706. - PMC - PubMed

Publication types

MeSH terms

Substances