. 2021 Aug 28;11(18):9162-9176.
doi: 10.7150/thno.59605. eCollection 2021.

PRMT5 disruption drives antitumor immunity in cervical cancer by reprogramming T cell-mediated response and regulating PD-L1 expression

Affiliations

PRMT5 disruption drives antitumor immunity in cervical cancer by reprogramming T cell-mediated response and regulating PD-L1 expression

Yongshuai Jiang et al. Theranostics. .

Abstract

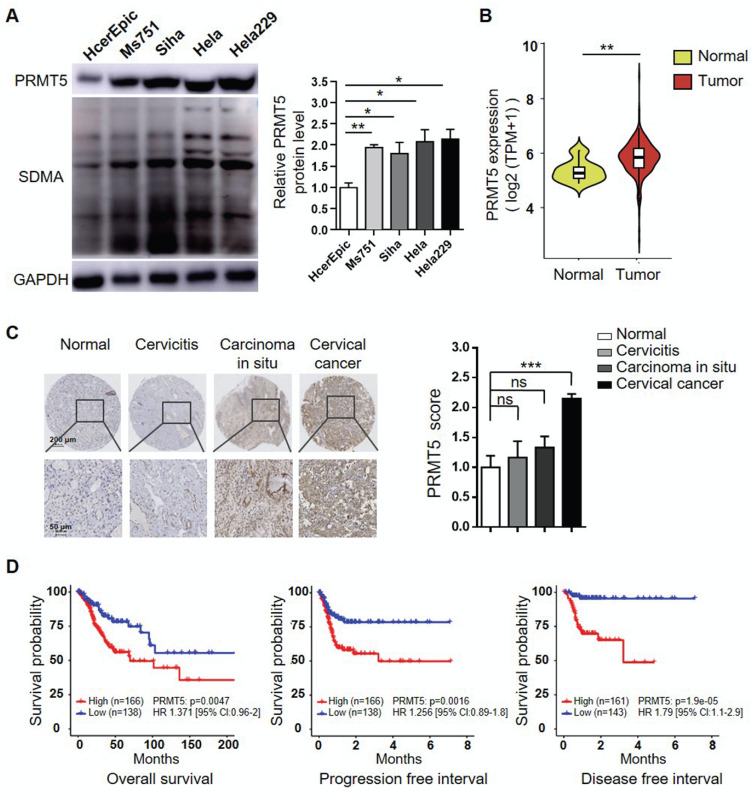
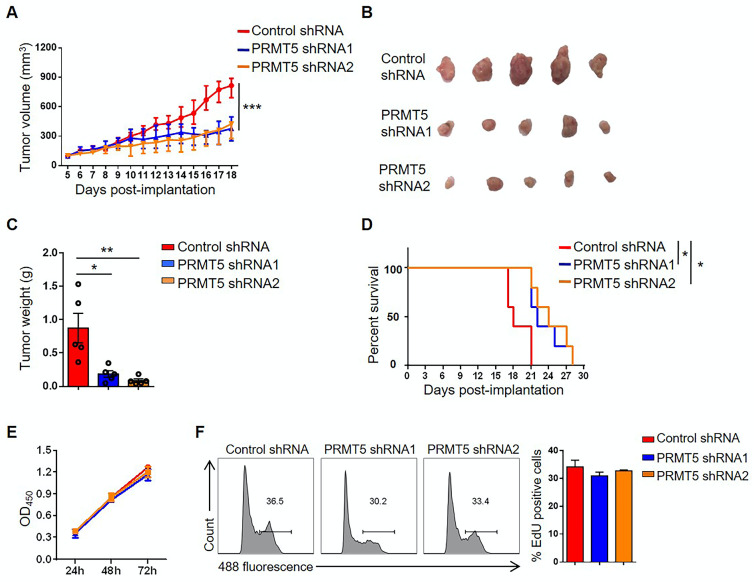
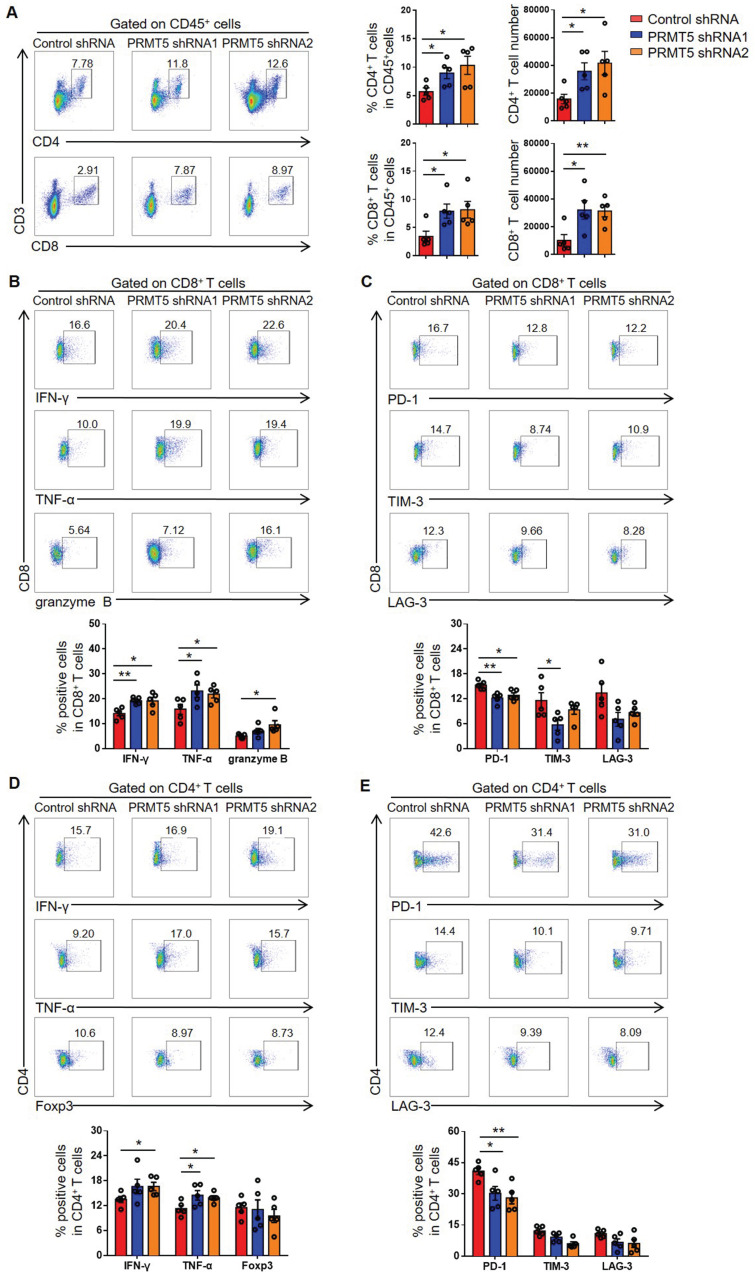
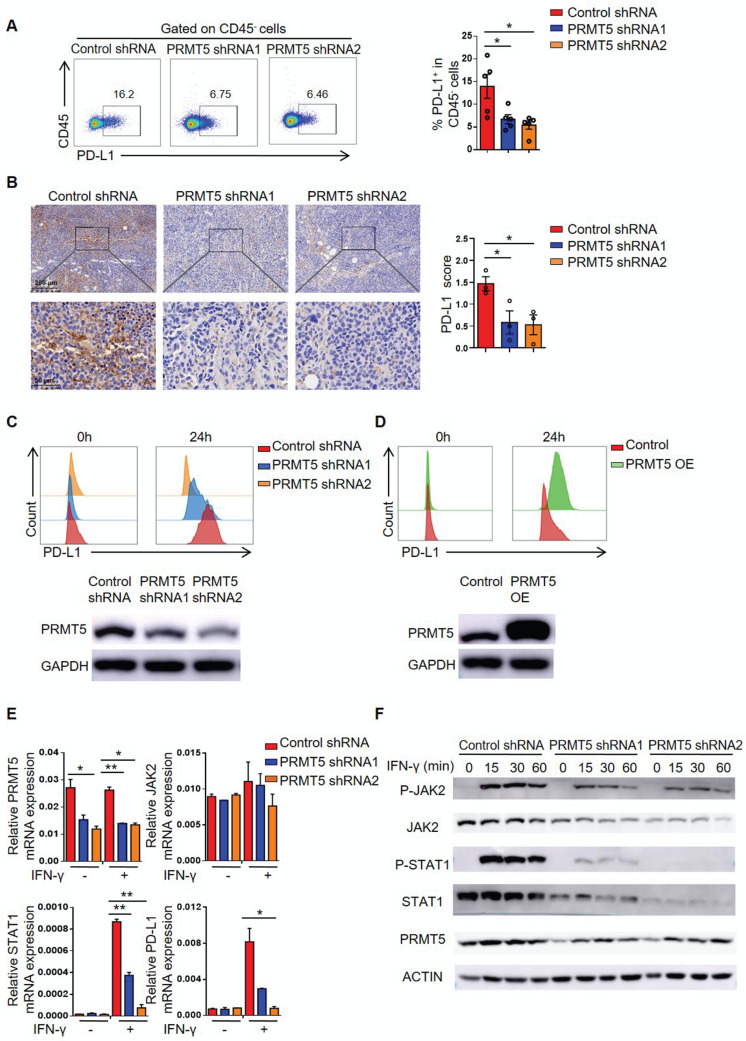
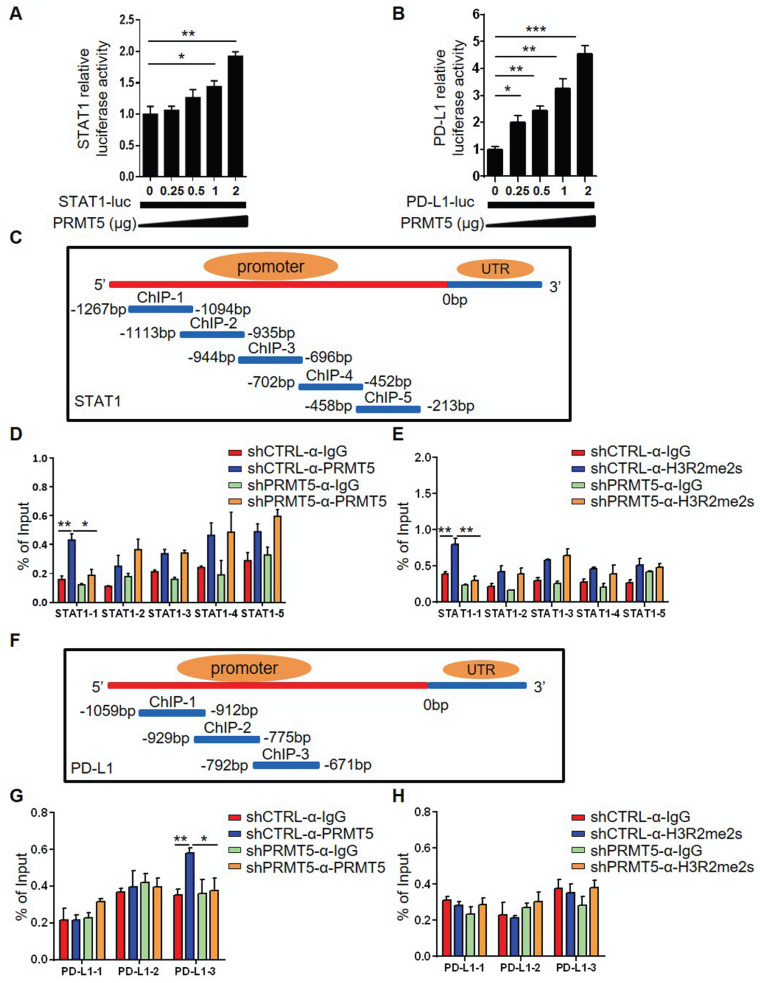
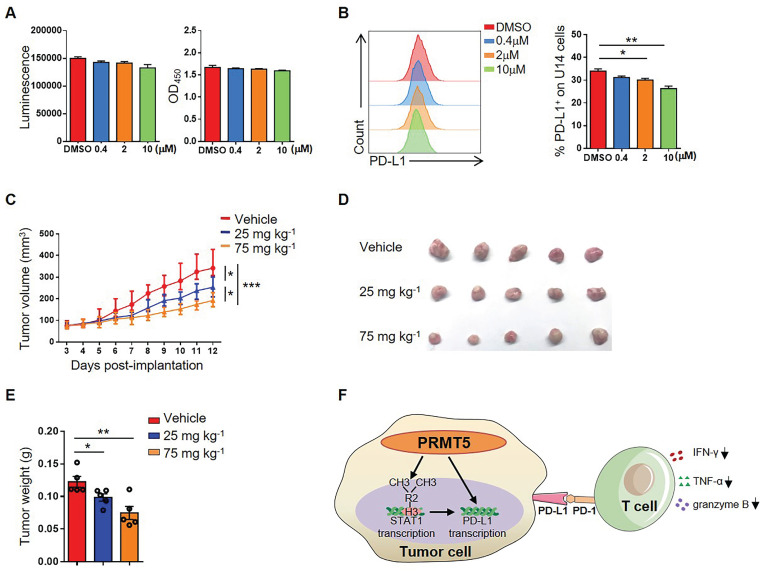
Rationale: Protein arginine methyltransferase 5 (PRMT5) is an oncogene that promotes tumor cell proliferation, invasion and metastasis. However, the underlying mechanisms by which PRMT5 contributes to the progression of cervical cancer and especially the tumor microenvironment remain poorly understood. Methods: PRMT5 expression level was analyzed by Q-PCR, western blot, immunohistochemistry, and TCGA database. The role of PRMT5 in tumor growth was observed by transplanted tumor models, and the function of T cells in tumor microenvironment and in vitro co-culture system was investigated through flow cytometry. The transcriptional regulation of PRMT5 was analyzed using luciferase reporter and chromatin immunoprecipitation (ChIP) assay. The therapeutic effect of PRMT5 inhibitor was evaluated in a cervical cancer cell line transplanted tumor model. Results: We observed that the mRNA and protein expression levels of PRMT5 were increased in cervical cancer tissues, and the high expression of PRMT5 was associated with poor outcomes in cervical cancer patients. The absence of PRMT5 significantly inhibited tumor growth in a cervical cancer transplanted tumor model, and importantly, PRMT5 absence in tumors led to increase the number and enhance the function of tumor infiltrating T cells. Mechanistically, PRMT5 enhanced the transcription of STAT1 through symmetric dimethylation of histone H3R2 and thus promoted PD-L1 expression in cervical cancer cells. Moreover, in an in vitro co-culture system, knockdown of PRMT5 in tumor cells could directly enhance the expression of IFN-γ, TNF-α and granzyme B in T cells. These results suggested that PRMT5 promoted the development of cervical cancer by the crosstalk between tumor cells and T cells. Furthermore, the PRMT5 inhibitor EPZ015666 treatment could suppress tumor growth in a cervical cancer transplanted tumor model. Conclusion: Our results clarify a new mechanism which PRMT5 knockdown in cervical cancer cells drives an antitumor function via reprogramming T cell-mediated response and regulating PD-L1 expression. Thus, our study highlights that PRMT5 may be a potential target for cervical cancer therapy.

Keywords: PD-L1; PRMT5; STAT1; cervical cancer; tumor microenvironment.


Conflict of interest statement

Competing Interests: The authors have declared that no competing interest exists.

Figures

Figure 1
Figure 1
Increases of PRMT5 expression correlated with poor prognosis in cervical cancer. (A) PRMT5 expression and SDMA levels in a normal human cervical cell line and four human cervical cancer cell lines were analyzed using western blot (left panel), and the protein expression of PRMT5 was quantified by ImageJ (right panel). Values are presented as the mean ± SEM. (B) Violin plot showed PRMT5 expression of normal cervical tissues (n = 13) and cervical tumor tissues (n = 306) from TCGA database (Kruskal-Wallis test). (C) PRMT5 expression levels of tissue array from normal cervix (n = 4), cervicitis (n = 3), carcinoma in situ (n = 3) and cervical cancer (n = 35) were analyzed using immunohistochemistry method. Values are presented as the mean ± SEM. (D) OS (left panel), PFI (middle panel) and DFI (right panel) of cervical cancer patients with different PRMT5 levels were analyzed from TCGA database. The "maxstat.test" function in R package maxstat was used to dichotomy gene expression, and all potential cutting points were repeatedly tested to find the maximum rank statistic, and then the patients were divided into the PRMT5-high group and the PRMT5-low group according to the maximum selected log-rank statistics, so as to reduce the calculated batch effect. Survival curves were generated using the Kaplan-Meier method, and the log-rank test was used to determine the significance of the differences. Univariate Cox regression model was used to calculate the hazard ratio (HR). *P < 0.05, **P < 0.01, and ***P < 0.001.
Figure 2
Figure 2
Downregulation of PRMT5 inhibited tumor growth. (A-C) Control cells and PRMT5 knockdown U14 cells were subcutaneously injected into 6-week-old female C57BL/6 mice (n = 5 for each group). (A) A line graph shows the tumor growth curve of mice. Images (B) and weight (C) of the resected tumor at day 18 after inoculation. Data are representative of at least two independent experiments. Values are presented as the mean ± SEM. (D) Survival curve of tumor-bearing mice subcutaneously injected with control cells and PRMT5 knockdown U14 cells (n = 5 for each group) (log-rank test). (E-F) Proliferation of control cells and PRMT5 knockdown U14 cells were analyzed by CCK-8 assay (E) and EdU staining (F). Data are representative of at least two independent experiments. Values are presented as the mean ± SEM. *P < 0.05, **P < 0.01, and ***P < 0.001.
Figure 3
Figure 3
PRMT5 deficiency in tumor cells affected tumor infiltrating T cells. Control cells and PRMT5 knockdown U14 cells were subcutaneously injected into 6-week-old female C57BL/6 mice (n = 5 for each group). Mice were euthanized at day 8 after inoculation. The tumor single cell suspension was prepared and analyzed by flow cytometry. (A) The percentage of CD4+ and CD8+ T cells in CD45+ cells, and the absolute number of the two T cell subsets in tumors. (B) Expression of IFN-γ, TNF-α and granzyme B in CD8+ T cells. (C) Expression of PD-1, TIM-3 and LAG-3 on the surface of CD8+ T cells. (D) Expression of IFN-γ, TNF-α and Foxp3 in CD4+ T cells. (E) Expression of PD-1, TIM-3 and LAG-3 on the surface of CD4+ T cells. Values are presented as the mean ± SEM. *P < 0.05 and **P < 0.01.
Figure 4
Figure 4
PRMT5 promoted STAT1 and PD-L1 expression. (A-B) Control cells and PRMT5 knockdown U14 cells were subcutaneously injected into 6-week-old female C57BL/6 mice. Mice were euthanized at day 8 after inoculation. (A) The tumor single cell suspension was prepared and the percentage of PD-L1 expression on CD45- cells was analyzed by flow cytometry (n = 5 for each group). (B) Immunohistochemical staining and statistical analysis of PD-L1 in tumor tissues (n = 3 for each group). (C-E) Control cells, PRMT5 knockdown U14 cells and PRMT5-overexpressing U14 cells were stimulated with IFN-γ for 24 h. PD-L1 expression on PRMT5 knockdown U14 cells (C) and PRMT5-overexpressing U14 cells (D) was analyzed using flow cytometry. (E) Real-time PCR experiments were used to test the expression of the indicated genes. (F) Western blot experiments were used to test the expression of the indicated proteins after IFN-γ stimulation for different time. Data are representative of at least two independent experiments (C-F). Values are presented as the mean ± SEM. *P < 0.05 and **P < 0.01.
Figure 5
Figure 5
PRMT5 regulated STAT1 transcription through H3R2me2s. Effect of PRMT5 on STAT1 (A) and PD-L1 (B) transcription was analyzed through dual-luciferase reporter assays. (C) The primer design scheme for the STAT1 promoter and its fragment in the ChIP assay. (D-E) Enrichment of PRMT5, H3R2me2s or IgG at the STAT1 promoter was assessed by ChIP Q-PCR. (F) The primer design scheme for the PD-L1 promoter and its fragment in the ChIP assay. (G-H) Enrichment of PRMT5, H3R2me2s or IgG at the PD-L1 promoter was assessed by ChIP Q-PCR. Data are representative of at least two independent experiments. Values are presented as the mean ± SEM. *P < 0.05, **P < 0.01, and *** P < 0.001.
Figure 6
Figure 6
PRMT5 inhibitor EPZ015666 suppressed cervical cancer growth. (A-B) U14 cells were cultured in the indicated concentrations of EPZ015666 for 72 h. (A) Effect of EPZ015666 on the viability and proliferation of U14 cells was analyzed by CellTiter-Glo luminescent assay and CCK-8 Cell Counting assay, respectively. (B) Expression of PD-L1 on U14 cells was analyzed by flow cytometry after IFN-γ stimulation. (C-E) On day 3 after inoculation of U14 cells, EPZ015666 was intraperitoneally injected into 6-week-old female C57BL/6 mice every day (n = 5 for each group). (C) A line graph shows the tumor growth curve of mice. Images (D) and weight (E) of the resected tumor at day 12 after inoculation. Data are representative of two independent experiments. Values are presented as the mean ± SEM. (F) Schematic diagram of the mechanism of PRMT5 in promoting the development of cervical cancer. *P < 0.05, **P < 0.01, and *** P < 0.001.

References

    1. Cohen PA, Jhingran A, Oaknin A, Denny L. Cervical cancer. Lancet. 2019;393:169–82. - PubMed
    1. Melnikow J, Henderson JT, Burda BU, Senger CA, Durbin S, Weyrich MS. Screening for cervical cancer with high-risk human papillomavirus testing: updated evidence report and systematic review for the US preventive services task force. JAMA. 2018;320:687–705. - PubMed
    1. Szymonowicz KA, Chen J. Biological and clinical aspects of HPV-related cancers. Cancer Biol Med. 2020;17:864–78. - PMC - PubMed
    1. Roden RBS, Stern PL. Opportunities and challenges for human papillomavirus vaccination in cancer. Nat Rev Cancer. 2018;18:240–54. - PMC - PubMed
    1. Wolford JE, Tewari KS. Rational design for cervical cancer therapeutics: cellular and non-cellular based strategies on the horizon for recurrent, metastatic or refractory cervical cancer. Epert Opin Drug Discov. 2018;13:445–57. - PMC - PubMed

Publication types

MeSH terms