. 2021 Aug 31:24:100299.
doi: 10.1016/j.pacs.2021.100299. eCollection 2021 Dec.

All-optical dynamic analysis of the photothermal and photoacoustic response of a microcantilever by laser Doppler vibrometry

Affiliations

All-optical dynamic analysis of the photothermal and photoacoustic response of a microcantilever by laser Doppler vibrometry

Yang Liu et al. Photoacoustics. .

Abstract

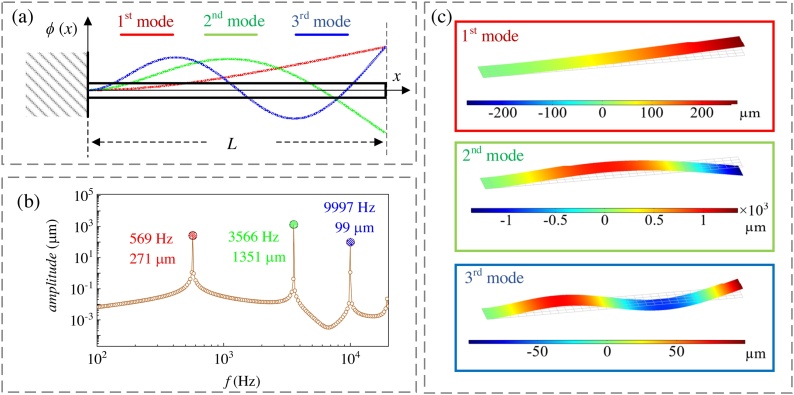
Light absorption induced thermoelastic and photoacoustic excitation, combined with laser Doppler vibrometry, was utilized to analyze the dynamic mechanical behavior of a microcantilever. The measured frequency response, modal shapes, and acoustic coupling effects were interpreted in the framework of a simple Bernouilli-Euler model and quantitative 3D finite element method (FEM) analysis. Three opto-mechanical generation mechanisms, each initiated by modulated optical absorption and heating, were identified both by an analytical and finite element model. In decreasing order of importance, optically induced cantilever bending is found to be caused by: (i) differences in photoacoustically induced pressure oscillations in the air adjacent to the illuminated and dark side of the cantilever, resulting from heat transfer from the illuminated cantilever to the nearby air, acting as a volume velocity piston, and (ii) thermoelastic stresses accompanying temperature and thermal expansion gradients in the cantilever, (iii) photoacoustically induced pressure oscillations in the air adjacent to the illuminated cantilever holder and frame.

Keywords: Cantilever; Modal analysis; Mode shape; Photoacoustic; Photothermal.


Conflict of interest statement

The authors declare that there are no conflicts of interest.

Figures

Fig. 1
Fig. 1
Modes of the cantilever bending and coupling with the acoustic waves. (a) Geometrical features of the considered cantilever and snapshots of the simplest 3 vibration modes of the cantilever. (b) FEM simulation of the displacement frequency response (at the free top of the cantilever) actuated by 1 Pa airborne plane sound waves and (c) the correspondent displacement maps along the cantilever.
Fig. 2
Fig. 2
Experimental setup and noise analysis. (a) Schematic diagram of the experimental setup. An intensity-modulated LED source (driver for current modulation: LEDD1B, Thorlabs) with a wavelength of 450 nm (M450LP1, Thorlabs®) was used to generate photo-thermo-elastic and photo-acoustic effects. The velocity of the cantilever, normal to its surface, was measured by a commercial laser Doppler vibrometer (LDV) (OFV-3001, Polytec®). A sound card (UCA222, Behringer®) with a sampling rate of 44.1 kHz and a bit-depth of 16 bits was used for the synchronous acquisition of the applied modulation and the LDV signal. (b) Noise spectrum at different positions (bottom spectrogram) and averaged along the cantilever (top graph) obtained by scanning the LDV probe spot along the long cantilever axis in the absence of optical excitation.
Fig. 3
Fig. 3
Response analysis with the LDV probe spot at 96 μm from the free end of the cantilever: (a) impulse response from cross-correlation between LDV signal and LED noise excitation, (b) frequency response derived by Fourier transforming (FT) the impulse response. The red curve was obtained from a moving average of 10 data points from the FT curve. (For interpretation of the references to colour in the Figure, the reader is referred to the web version of this article).
Fig. 4
Fig. 4
Spatially resolved (b) and averaged (a) amplitude spectrum of the vibrational response of the cantilever to modulated illumination, and spatially resolved phase (c).
Fig. 5
Fig. 5
Color maps of modal vibration patterns in frequency bands around the 3 resonant modes.
Fig. 6
Fig. 6
Experimental mode shapes (amplitude of the displacement) and theoretical curves fitted by Eq. (1).
Fig. 7
Fig. 7
Excitation analysis. Different vibration origins (panel a) and 3-layer model (panel b). Analytically calculated photo-thermo-mechanical amplitude and phase spectra of temperature (panel c), stress/pressure (panel d) and displacement (panel e) oscillations for two cantilever bending generation mechanisms: (i) photothermally generated thermal expansion (PTE) gradients in the cantilever, (ii) difference in photoacoustically (PA) generated pressure between the illuminated and dark side of the cantilever. The assumed wavenumber was 838 rad/m, i.e. the one of the experimentally observed lowest cantilever resonance mode. Since the generation efficiency strongly depends on the normal gradient of stress and temperature, in panels (c, d), curves are shown for the illuminated (front) and dark (rear) side of the cantilever. Stresses (panel (d)) and displacements (panel (e)) are plotted for the photo-thermo-elastic (PTE) and nearby photoacoustic (PA) contribution, and for the two summed.
Fig. 8
Fig. 8
Comparative FEM simulation of photo-thermo-elastic effect in the cantilever and photoacoustic effect in the air adjacent to the holder and frame, with the experimentally measured displacement of the cantilever. (a) Meshing of the model and loading interfaces of the heat flux are respectively colored red, green and blue for the cantilever, holder and frame. (b) Local heat transfer FEM model for estimating the heat flux into the air layer adjacent to the holder/frame, which was driving the photoacoustic pressure changes and (c) resulting frequency dependence of the ϕh heat flux into the holder/frame material and ϕa into the air, with ϕa/(ϕa+ϕh) its relative contribution. (d) Comparison between FEM-calculated displacement amplitudes resulting from photoacoustic (PA) excitation at the holder/frame and photo-thermo-elastic (PTE) excitation in the cantilever, the directions of x, y and z are as shown in Fig. 8a. (e) Actual displacement of the cantilever, excited by chirp modulated LED with the experiment setup described in section III and derived from the envelope of the cantilever displacement at different frequencies. (For interpretation of the references to colour in the Figure, the reader is referred to the web version of this article).

References

    1. Johnson B.N., Mutharasan R. Biosensing using dynamic-mode cantilever sensors: a review. Biosens. Bioelectron. 2012;32(1):1–18. - PubMed
    1. Nazemi H., Joseph A., Park J. Advanced micro-and nano-gas sensor technology: a review. Sensors. 2019;19(6):1285. - PMC - PubMed
    1. Shen J., Zhang D., Zhang F.H. AFM tip-sample convolution effects for cylinder protrusions. Appl. Surf. Sci. 2017;422:482–491.
    1. Chavan D., Andres D., Iannuzzi D. Note: Ferrule-top atomic force microscope. II. Imaging in tapping mode and at low temperature. Rev. Sci. Instrum. 2011;82(4) - PubMed
    1. Tamayo J., García R. Deformation, contact time, and phase contrast in tapping mode scanning force microscopy. Langmuir. 2012;66(18):309–312.

LinkOut - more resources