. 2021 Nov 1;321(5):G449-G460.
doi: 10.1152/ajpgi.00482.2020. Epub 2021 Sep 15.

Single-cell analyses of human pancreas: characteristics of two populations of acinar cells in chronic pancreatitis

Affiliations

Single-cell analyses of human pancreas: characteristics of two populations of acinar cells in chronic pancreatitis

Brandon M Blobner et al. Am J Physiol Gastrointest Liver Physiol. .

Abstract

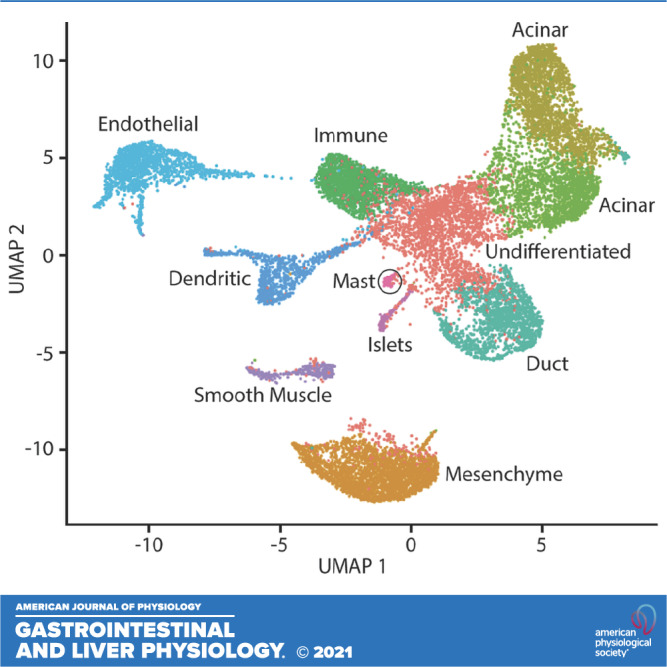
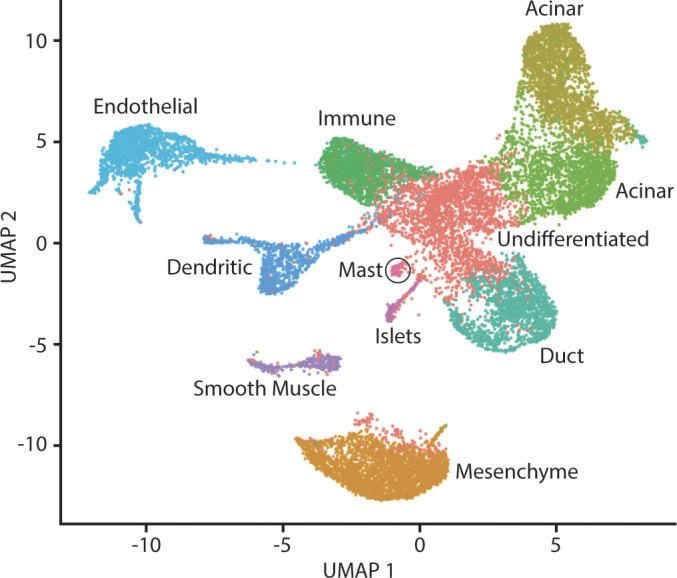
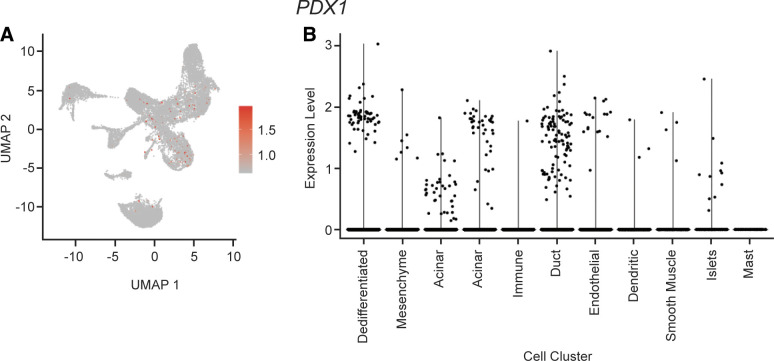
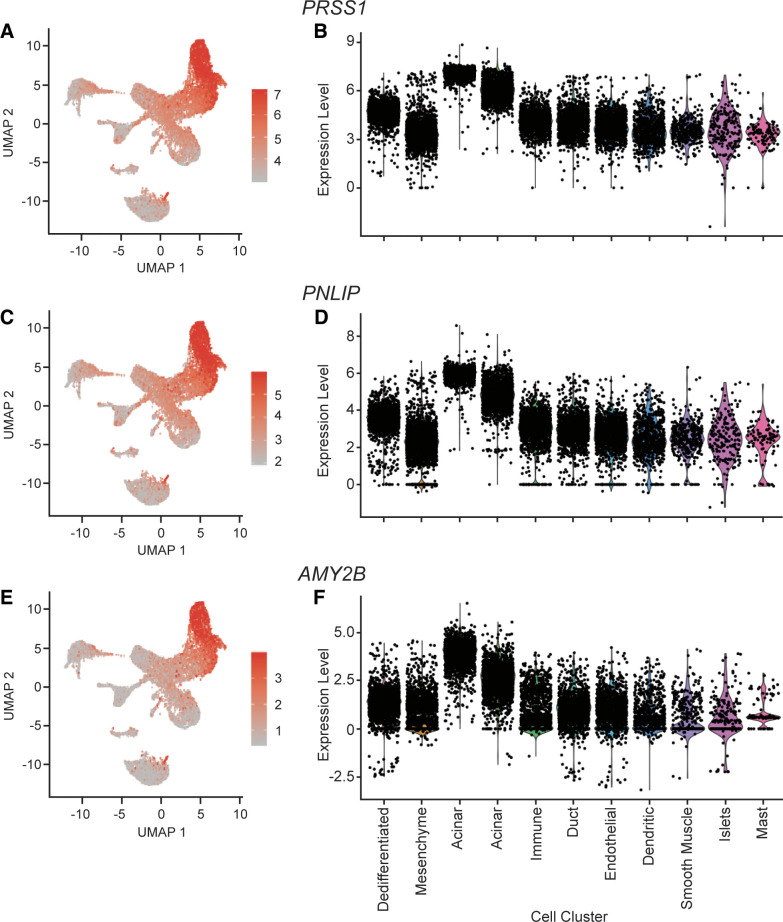
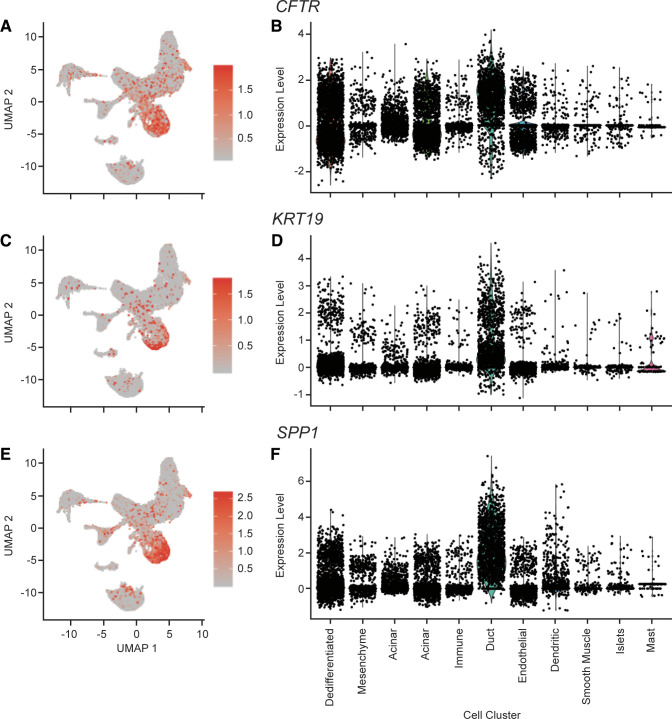
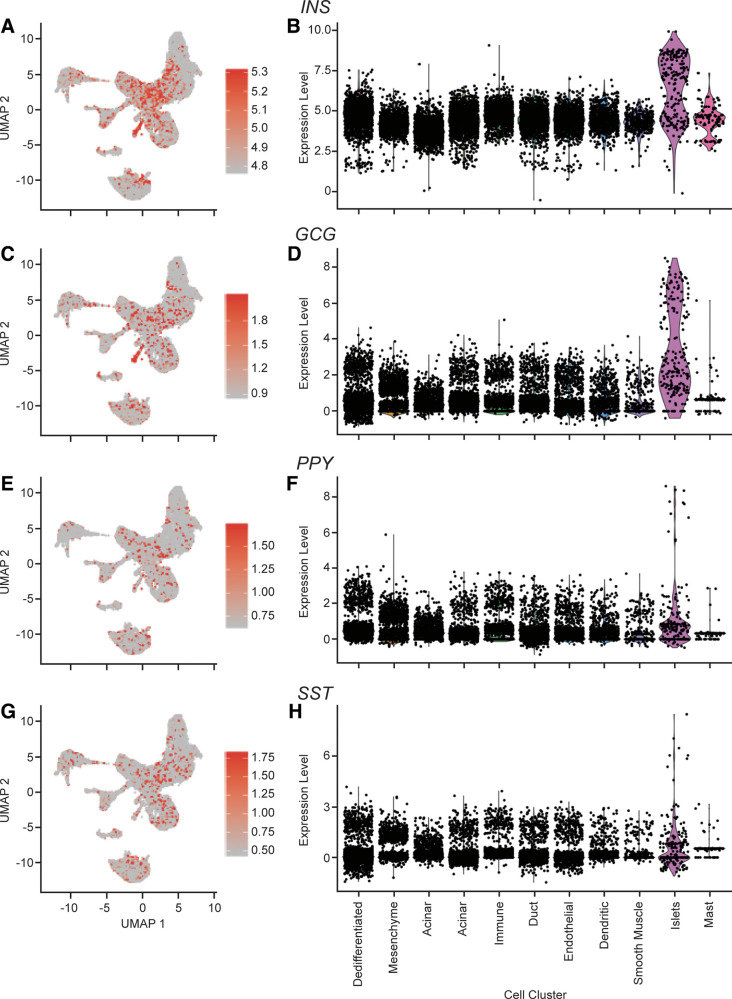
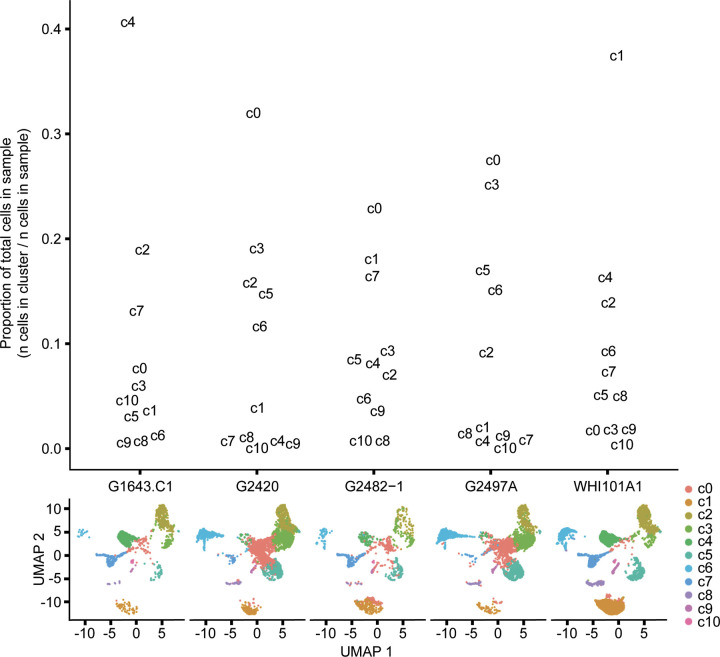
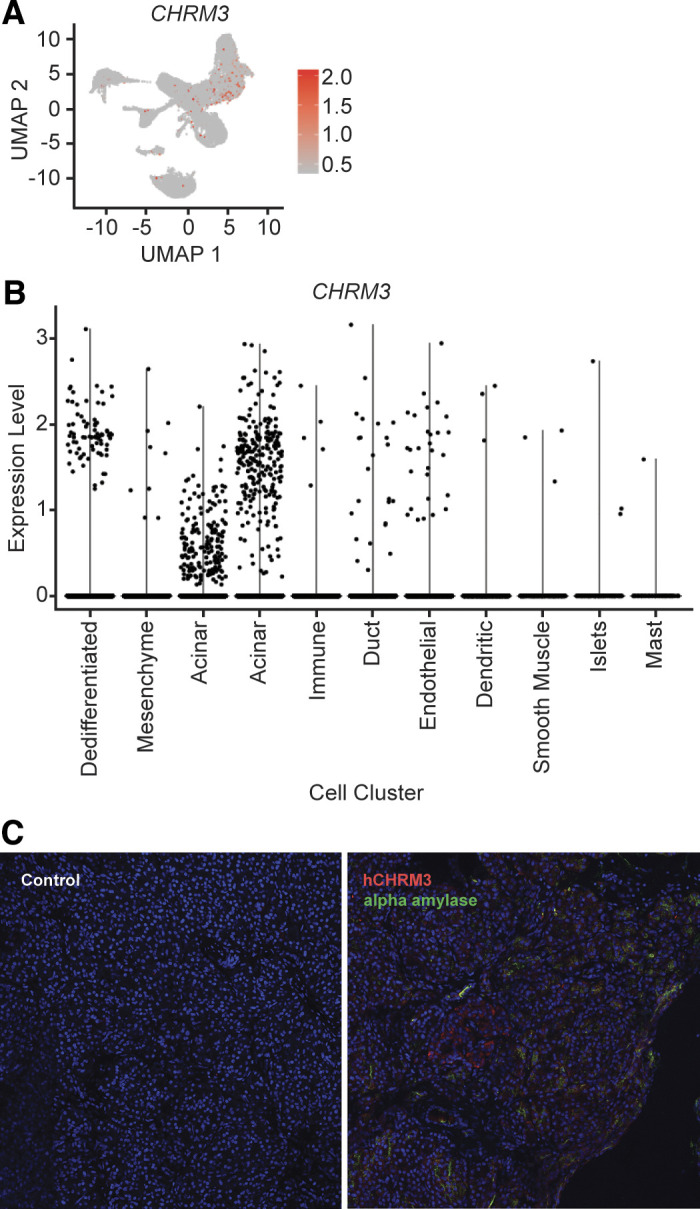
Chronic pancreatitis (CP) is a complex inflammatory disorder with numerous associated genetic and environmental risk factors. The most distressing characteristic of CP is recalcitrant pain, often requiring surgical resection including total pancreatectomy with islet autotransplantation (TPIAT). We studied five consented subjects undergoing pancreatic resection and processed isolated cells for single-cell RNA sequencing (scRNA-Seq). Using high-dimensional transcriptomic cluster analysis, we identified 11 unique cell clusters in the pancreas tissue. These cell clusters include a cluster of undifferentiated/dedifferentiated cells and two unique clusters of acinar cells, one of which appears to be in a transitional stage. To determine the cellular response to protease inhibitor and stimulation, we treated aliquots of cells from one subject with a protease inhibitor cocktail with and without bethanechol (a muscarinic receptor agonist) at 100 and 400 µM and compared gene expression profiles. The protease inhibitors appeared to reduce cell stress. Pancreatic digestive enzymes and islet hormones were upregulated in both doses of bethanechol-treated cells compared with naïve cells. High-dose bethanechol appeared to be toxic and consistent with hyperstimulation. These studies demonstrate the feasibility of investigating human acinar cell physiology at the single-cell level and initial evidence that these cells retain responsiveness to agonist stimulation with predicted second messenger and transcriptomic responses.NEW & NOTEWORTHY We conducted single cell RNA sequencing on pancreas tissue from five individuals. We identified eleven unique cell clusters including a large population of dedifferentiated cells as well as two unique clusters of acinar cells, one of which appears to exist in a transitional state. We also examined the cellular response of pancreas tissue to stimulation and identified affected genes and pathways, including pancreatic digestive enzymes.

Keywords: RNA-Seq; pancreas; pancreatitis; single cell.


Conflict of interest statement

No conflicts of interest, financial or otherwise, are declared by the authors with data use under National Insitutes of Health guidelines.

Figures

None
Graphical abstract
Figure 1.
Figure 1.
Uniform Manifold Approximation and Projection (UMAP) plot of combined pancreas cell samples. A UMAP plot was generated using cell clusters identified in Seurat. Unique cell clusters vary in color. The cell type of each cluster was determined from differentially expressed genes in the cell cluster using PanglaoDB or from expression of cell type markers (e.g., PRSS1, CFTR, INS).
Figure 2.
Figure 2.
PDX1 expression. A: cellular expression of PDX1. The expression of PDX1 in each cell overlaid onto the combined UMAP plot. Cells with the greatest relative expression are red and cells with the lowest relative expression are gray. B: violin plot of PDX1 expression. Expression level of PDX1 in each cell (y-axis), stratified by cell cluster (x-axis). UMAP, Uniform Manifold Approximation and Projection.
Figure 3.
Figure 3.
Expression of acinar cell markers PRSS1, PNLIP, and AMY2B. A: cellular expression of PRSS1. The expression of PRSS1 in each cell overlaid onto the combined Uniform Manifold Approximation and Projection (UMAP) plot. Cells with the greatest relative expression are red and cells with the lowest relative expression are gray. B: violin plot of PRSS1 expression. Expression level of PRSS1 in each cell (y-axis), stratified by cell cluster (x-axis). C: cellular expression of PNLIP. The expression of PNLIP in each cell overlaid onto the combined UMAP plot. Cells with the greatest relative expression are red and cells with the lowest relative expression are gray. D: violin plot of PNLIP expression. Expression level of PNLIP in each cell (y-axis), stratified by cell cluster (x-axis). E: cellular expression of AMY2B. The expression of AMY2B in each cell overlaid onto the combined UMAP plot. Cells with the greatest relative expression are red and cells with the lowest relative expression are gray. F: violin plot of AMY2B expression. Expression level of AMY2B in each cell (y-axis), stratified by cell cluster (x-axis).
Figure 4.
Figure 4.
Expression of duct cell markers CFTR, KRT19, and SPP1. A: cellular expression of CFTR. The expression of CFTR in each cell overlaid onto the combined Uniform Manifold Approximation and Projection (UMAP) plot. Cells with the greatest relative expression are red and cells with the lowest relative expression are gray. B: violin plot of CFTR expression. Expression level of CFTR in each cell (y-axis), stratified by cell cluster (x-axis). C: cellular expression of KRT19. The expression of KRT19 in each cell overlaid onto the combined UMAP plot. Cells with the greatest relative expression are red and cells with the lowest relative expression are gray. D: violin plot of KRT19 expression. Expression level of KRT19 in each cell (y-axis), stratified by cell cluster (x-axis). E: cellular expression of SPP1. The expression of SPP1 in each cell overlaid onto the combined UMAP plot. Cells with the greatest relative expression are red and cells with the lowest relative expression are gray. F: violin plot of SPP1 expression. Expression level of SPP1 in each cell (y-axis), stratified by cell cluster (x-axis).
Figure 5.
Figure 5.
Expression of acinar cell markers INS, GCG, PPY, and SST. A: cellular expression of INS. The expression of INS in each cell overlaid onto the combined Uniform Manifold Approximation and Projection (UMAP) plot. Cells with the greatest relative expression are red and cells with the lowest relative expression are gray. B: violin plot of INS expression. Expression level of INS in each cell (y-axis), stratified by cell cluster (x-axis). C: cellular expression of GCG. The expression of GCG in each cell overlaid onto the combined UMAP plot. Cells with the greatest relative expression are red and cells with the lowest relative expression are gray. D: violin plot of GCG expression. Expression level of GCG in each cell (y-axis), stratified by cell cluster (x-axis). E: cellular expression of PPY. The expression of PPY in each cell overlaid onto the combined UMAP plot. Cells with the greatest relative expression are red and cells with the lowest relative expression are gray. F: violin plot of PPY expression. Expression level of PPY in each cell (y-axis), stratified by cell cluster (x-axis). G: cellular expression of SST. The expression of SST in each cell overlaid onto the combined UMAP plot. Cells with the greatest relative expression are red and cells with the lowest relative expression are gray. H: violin plot of SST expression. Expression level of SST in each cell (y-axis), stratified by cell cluster (x-axis).
Figure 6.
Figure 6.
Proportion of cell clusters by sample and individual sample Uniform Manifold Approximation and Projection (UMAP) plots. Top: the proportion of each cell cluster (by number) from the total cells of each sample. Bottom: individual UMAP plots for each sample.
Figure 7.
Figure 7.
CHRM3 expression. A: cellular expression of CHRM3. The expression of CHRM3 in each cell overlaid onto the combined Uniform Manifold Approximation and Projection (UMAP) plot. Cells with the greatest relative expression are red and cells with the lowest relative expression are gray. B: violin plot of CHRM3 expression. Expression level of CHRM3 in each cell (y-axis), stratified by cell cluster (x-axis). C: immunofluorescence of hCHRM3 expression in human acinar cells. Immunofluorescence imaging control without primary antibodies (left) and immunofluorescence with primary antibodies (right) for hCHRM3 (red) and α-amylase (green).

References

    1. Whitcomb DC, Frulloni L, Garg P, Greer JB, Schneider A, Yadav D, Shimosegawa T. Chronic pancreatitis: an international draft consensus proposal for a new mechanistic definition. Pancreatology 16: 218–224, 2016. doi:10.1016/j.pan.2016.02.001. - DOI - PMC - PubMed
    1. Amann ST, Yadav D, Barmada MM, O’Connell M, Kennard ED, Anderson M, Baillie J, Sherman S, Romagnuolo J, Hawes RH, AlKaade S, Brand RE, Lewis MD, Gardner TB, Gelrud A, Money ME, Banks PA, Slivka A, Whitcomb DC. Physical and mental quality of life in chronic pancreatitis: a case-control study from the North American Pancreatitis Study 2 cohort. Pancreas 42: 293–300, 2013. doi:10.1097/MPA.0b013e31826532e7. - DOI - PMC - PubMed
    1. Anderson MA, Akshintala V, Albers KM, Amann ST, Belfer I, Brand R, Chari S, Cote G, Davis BM, Frulloni L, Gelrud A, Guda N, Humar A, Liddle RA, Slivka A, Gupta RS, Szigethy E, Talluri J, Wassef W, Wilcox CM, Windsor J, Yadav D, Whitcomb DC. Mechanism, assessment and management of pain in chronic pancreatitis: recommendations of a multidisciplinary study group. Pancreatology 16: 83–94, 2016. doi:10.1016/j.pan.2015.10.015. - DOI - PMC - PubMed
    1. Machicado JD, Amann ST, Anderson MA, Abberbock J, Sherman S, Conwell DL, Cote GA, Singh VK, Lewis MD, Alkaade S, Sandhu BS, Guda NM, Muniraj T, Tang G, Baillie J, Brand RE, Gardner TB, Gelrud A, Forsmark CE, Banks PA, Slivka A, Wilcox CM, Whitcomb DC, Yadav D. Quality of life in chronic pancreatitis is determined by constant pain, disability/unemployment, current smoking, and associated co-morbidities. Am J Gastroenterol 112: 633–642, 2017. doi:10.1038/ajg.2017.42. - DOI - PMC - PubMed
    1. Mullady DK, Yadav D, Amann ST, O'Connell MR, Barmada MM, Elta GH, Scheiman JM, Wamsteker EJ, Chey WD, Korneffel ML, Weinman BM, Slivka A, Sherman S, Hawes RH, Brand RE, Burton FR, Lewis MD, Gardner TB, Gelrud A, DiSario J, Baillie J, Banks PA, Whitcomb DC, Anderson MA; NAPS2 Consortium. Type of pain, pain-associated complications, quality of life, disability and resource utilisation in chronic pancreatitis: a prospective cohort study. Gut 60: 77–84, 2011. doi:10.1136/gut.2010.213835. - DOI - PMC - PubMed

Publication types

MeSH terms

LinkOut - more resources