. 2022 Jan 20;34(1):273-286.
doi: 10.1093/plcell/koab227.

Super-resolution imaging illuminates new dynamic behaviors of cellulose synthase

Affiliations

Super-resolution imaging illuminates new dynamic behaviors of cellulose synthase

Sydney G Duncombe et al. Plant Cell. .

Abstract

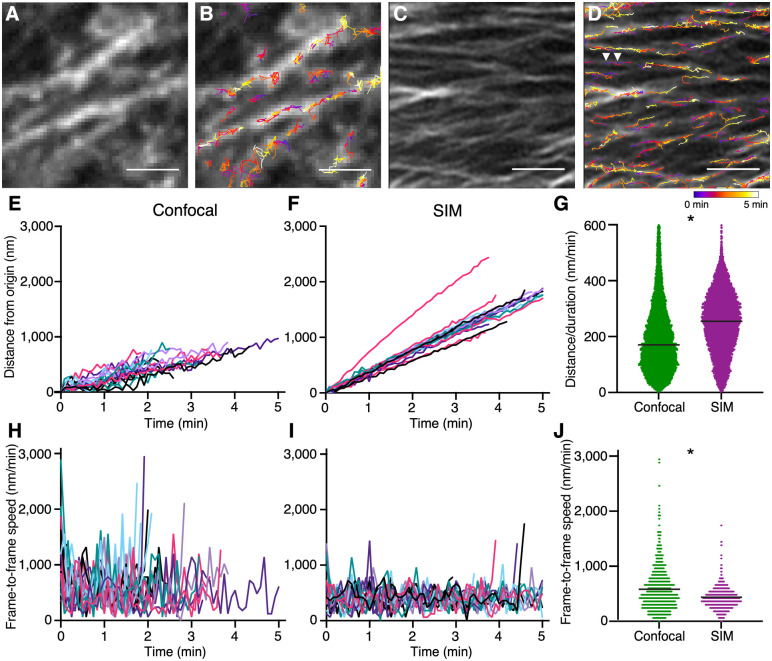
Confocal imaging has shown that CELLULOSE SYNTHASE (CESA) particles move through the plasma membrane as they synthesize cellulose. However, the resolution limit of confocal microscopy circumscribes what can be discovered about these tiny biosynthetic machines. Here, we applied Structured Illumination Microscopy (SIM), which improves resolution two-fold over confocal or widefield imaging, to explore the dynamic behaviors of CESA particles in living plant cells. SIM imaging reveals that Arabidopsis thaliana CESA particles are more than twice as dense in the plasma membrane as previously estimated, helping explain the dense arrangement of cellulose observed in new wall layers. CESA particles tracked by SIM display minimal variation in velocity, suggesting coordinated control of CESA catalytic activity within single complexes and that CESA complexes might move steadily in tandem to generate larger cellulose fibrils or bundles. SIM data also reveal that CESA particles vary in their overlaps with microtubule tracks and can complete U-turns without changing speed. CESA track patterns can vary widely between neighboring cells of similar shape, implying that cellulose patterning is not the sole determinant of cellular growth anisotropy. Together, these findings highlight SIM as a powerful tool to advance CESA imaging beyond the resolution limit of conventional light microscopy.


Figures

Figure 1
Figure 1
CESA particle density is higher in SIM images. A, Four-sided slide chamber used for SIM imaging. Yellow rectangles are tape, light blue is half-strength MS medium, and the blue rectangle represents the coverslip. B, Cotyledon petiole cells that were imaged in the epidermal layer of 5-day-old light-grown cotyledons. C, Fifteen raw images were taken with SIM, with each column’s grating pattern represented above the corresponding five images. D, GFP–CESA3 image taken by confocal microscopy and scaled to fit the size of a SIM image. E, Zoomed-in region of (D). The green line traces a GFP–CESA3 track used to make a plot profile of CESA particles. F, Imaris automated particle tracking of (E), green circles are tracked particles. G, GFP–CESA3 image taken with near-TIRF microscopy and scaled to fit the size of a SIM image. H, Zoomed-in region of (G). The blue line traces a GFP–CESA3 track used to make a plot profile of CESA particles. I, Imaris automated particle tracking of (H), blue circles are tracked particles. J, GFP–CESA3 image taken by SIM. K, Zoomed-in region of (J). The purple line traces a GFP–CESA3 track used to make a plot profile of CESA particles. L, Imaris particle tracking of (K). The purple circles are tracked particles. M, Plot profiles from (E), (H), and (K). Black arrowheads mark peaks that were counted as particles. N, Number of particles along a track for confocal, near-TIRF, and SIM, n ≥ 15 cells, black horizontal lines indicate mean, different letters indicate significance, P < 0.0001, one-way ANOVA and Mann–Whitney test. O, Particle density determined by Imaris, n ≥ 15 cells, black horizontal lines indicate mean, different letters indicate significance, P < 0.0001, one-way ANOVA and Mann–Whitney test. Scale bar = 2 µm.
Figure 2
Figure 2
SIM allows for more precise CESA particle tracking. A, Average projection of GFP–CESA3 from a confocal time-lapse movie. B, Imaris particle tracks overlaying (A), see Movie 1. The color of the tracks indicates the time point in the movie of the particle along its track, as seen in the heatmap below (D). C, Average projection of GFP–CESA3 from a SIM time-lapse movie. D, Imaris particle tracks overlaying (C), see Movie 1; white arrowheads indicate two particles moving in tandem. The color of the tracks indicates the time point in the movie of the particle along its track as seen in the heatmap below (D). E, Twenty confocal particle positions plotted as particle distance from particle origin, n ≥ 3 seedlings. Line colors are arbitrary and used solely to identify one particle track from another in (E), (F), (H), and (I). (F) Twenty SIM particle positions, plotted as particle distance from particle origin, n ≥ 3 seedlings. G, Particle speeds calculated as distance over duration, n = 12 cells from 12 different seedlings, black bars indicate mean, P < 0.0001, Student’s t test. H, Frame-to-frame speed calculated for 20 confocal particles, n ≥ 3 seedlings. I, Frame-to-frame speed calculated for 20 SIM particles, n ≥ 3 seedlings. J, Plot of instantaneous speed from every time point of particles in (H) and (I), black horizontal lines indicate mean, P < 0.0001, Student’s t test. Scale bar = 2 µm.
Figure 3
Figure 3
A subset of CESA particles make U-turns. A, Average projection of a time-lapse movie of GFP–CESA3 and mCherry-TUB6 containing a particle that performs a U-turn (see Movie 2). The cyan arrowhead marks the start of the U-turn, the white arrowhead marks the end of the U-turn. B, Imaris tracks overlaid on (A). Color bar indicates the time point in the movie of the particle along its track. C, Model depicting microtubule polarity and stability influence on CESA particle U-turn behavior. D, Model depicting previously deposited cellulose as an influence on CESA particle U-turn behavior. E, Model depicting an obstruction in the plasma membrane as a driver for particle U-turn behavior. F, Colocalization analysis showing the number of particles moving along tracks that were on top of the microtubule, partially overlapping the microtubule, or separated from the microtubule. Particles are separated based on the distance between their measured fluorescent peak from a plot profile to the fluorescent peak of the microtubule. Black horizontal lines indicate mean. G, Duration of all 20 U-turn particles from the start of the U-turn to the return to linear movement. Black horizontal line indicates mean. Scale bar = 1 µm.
Figure 4
Figure 4
Varied CESA trajectory patterns in epidermal petiole cells do not affect CESA speed. A–D, Representative images of the four most common track patterns seen in the epidermal cells of the cotyledon petiole. Scale bar = 2 µm. E, Depiction of the variety of track patterns seen in neighboring cells of the cotyledon petiole. F, Comparison of the average particle speeds of the 20 cells with the most transversely oriented and most longitudinally oriented CESA particle tracks. Black horizontal lines indicate mean. P = 0.093, Student’s t test. G, Comparison of the average particle speeds of the 20 cells with the highest and lowest anisotropy scores for CESA particle tracks, as determined by FibrilTool. Black bars indicate mean. P = 0.437, Student’s t test.
None

Comment in

References

    1. Allen H, Wei D, Gu Y, Li S (2021) A historical perspective on the regulation of cellulose biosynthesis. Carbohydr Polymers 252: 117022 - PubMed
    1. Anderson CT (2018) Finding order in a bustling construction zone: quantitative imaging and analysis of cell wall assembly in plants. Curr Opin Plant Biol 46: 62–67 - PubMed
    1. Anderson CT, Kieber JJ (2020) Dynamic construction, perception, and remodeling of plant cell walls. Ann Rev Plant Biol 71: 39–69 - PubMed
    1. Barnes WJ, Anderson CT (2018) Cytosolic invertases contribute to cellulose biosynthesis and influence carbon partitioning in seedlings of Arabidopsis thaliana. Plant J Cell Mol Biol 94: 956–974 - PubMed
    1. Bashline L, Li S, Anderson CT, Lei L, Gu Y (2013) The endocytosis of cellulose synthase in Arabidopsis is dependent on μ2, a clathrin-mediated endocytosis adaptin. Plant Physiol 163: 150–160 - PMC - PubMed

Publication types

MeSH terms

LinkOut - more resources