Review
. 2021 Dec;226(9):2951-2966.
doi: 10.1007/s00429-021-02377-7. Epub 2021 Sep 15.

Vision for action: thalamic and cortical inputs to the macaque superior parietal lobule

Affiliations
Review

Vision for action: thalamic and cortical inputs to the macaque superior parietal lobule

Michela Gamberini et al. Brain Struct Funct. 2021 Dec.

Abstract

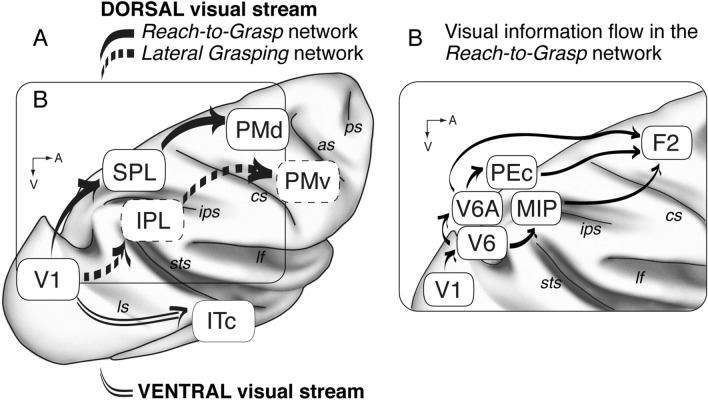
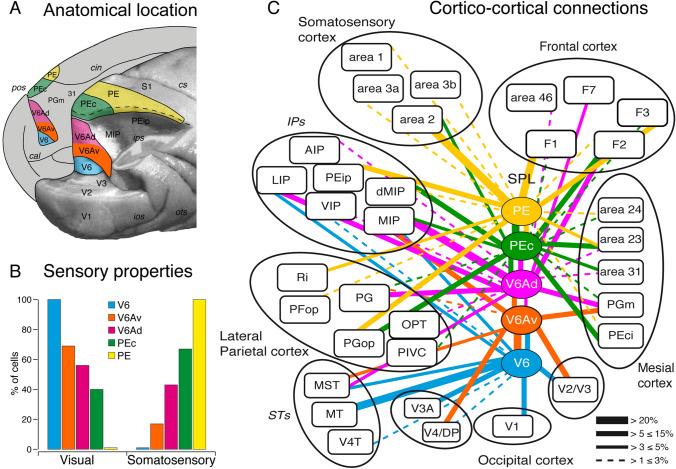
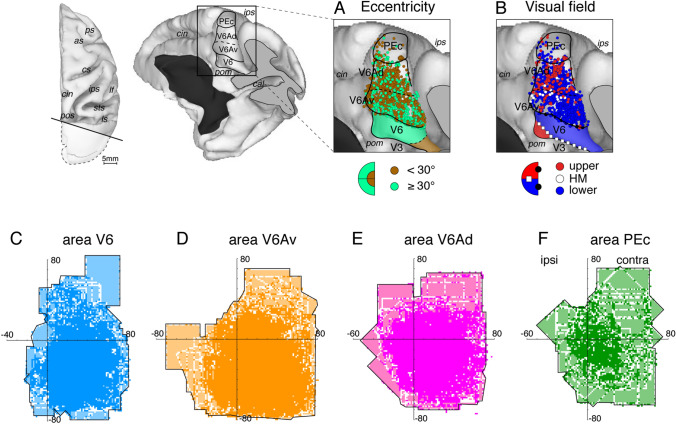
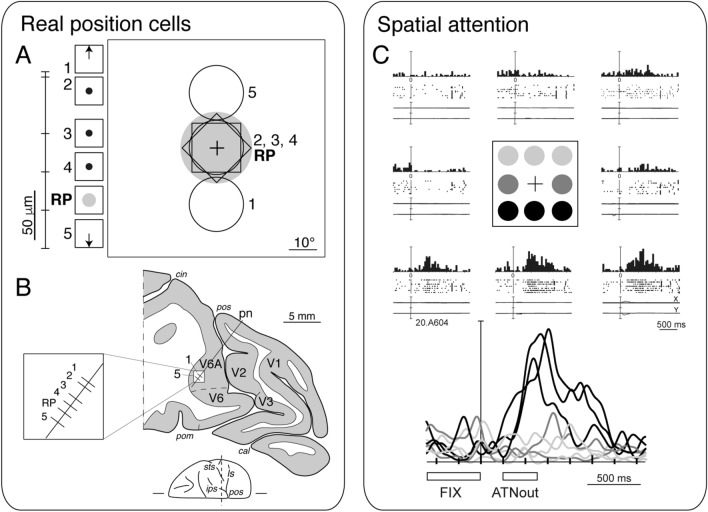
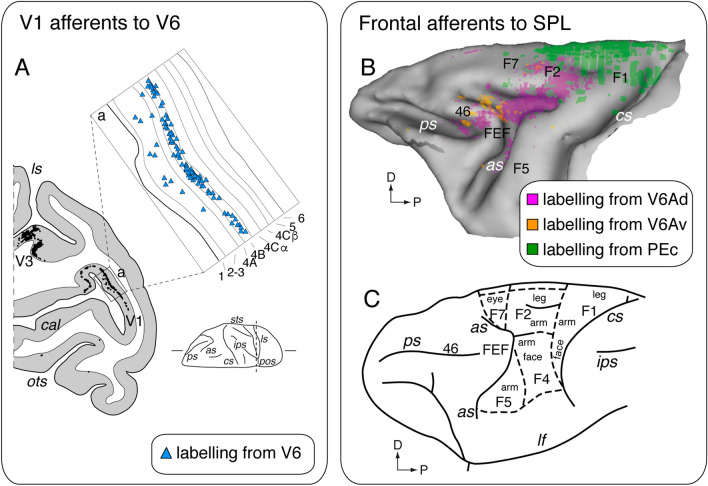
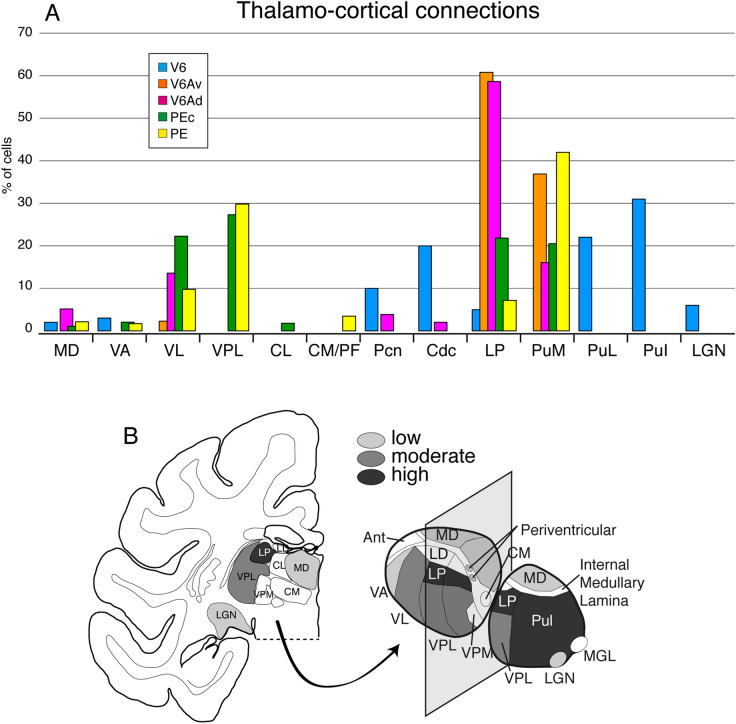
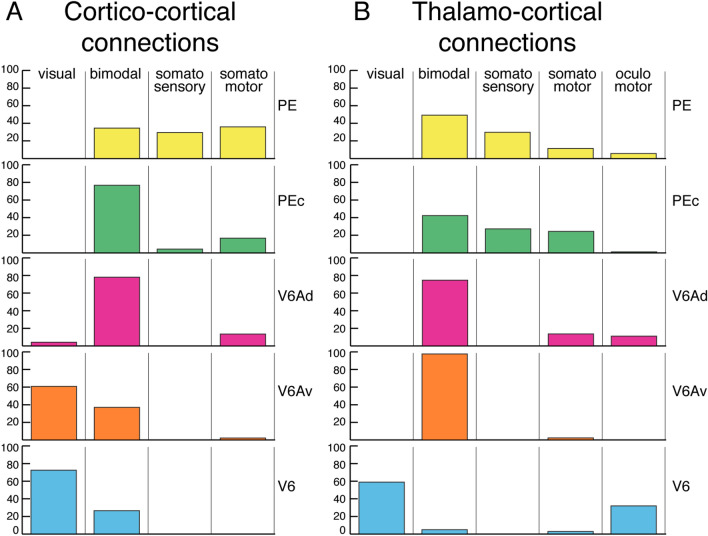
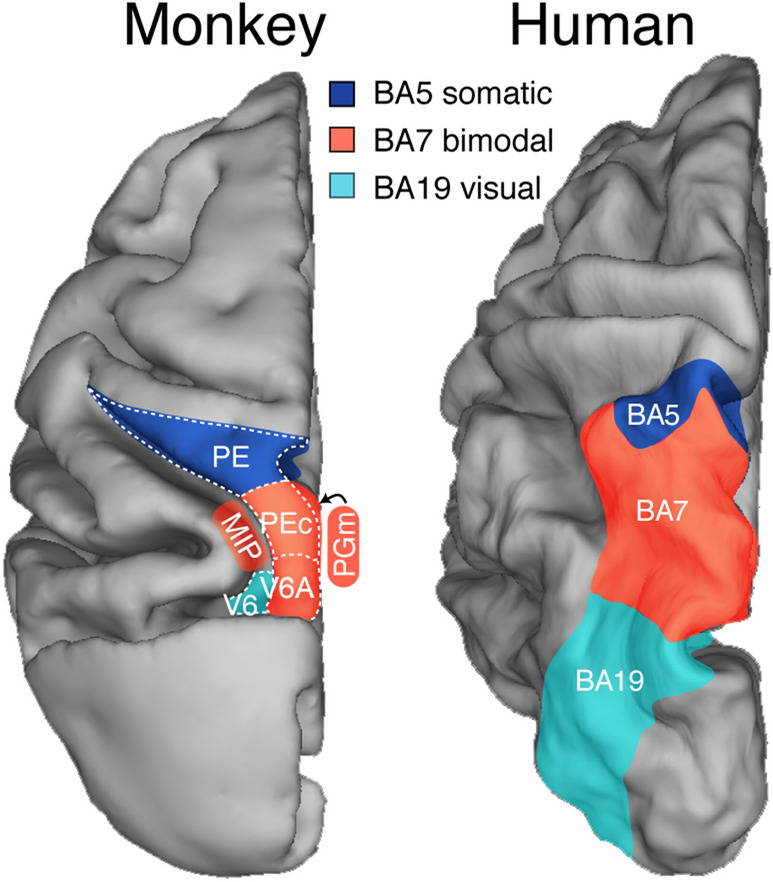
The dorsal visual stream, the cortical circuit that in the primate brain is mainly dedicated to the visual control of actions, is split into two routes, a lateral and a medial one, both involved in coding different aspects of sensorimotor control of actions. The lateral route, named "lateral grasping network", is mainly involved in the control of the distal part of prehension, namely grasping and manipulation. The medial route, named "reach-to-grasp network", is involved in the control of the full deployment of prehension act, from the direction of arm movement to the shaping of the hand according to the object to be grasped. In macaque monkeys, the reach-to-grasp network (the target of this review) includes areas of the superior parietal lobule (SPL) that hosts visual and somatosensory neurons well suited to control goal-directed limb movements toward stationary as well as moving objects. After a brief summary of the neuronal functional properties of these areas, we will analyze their cortical and thalamic inputs thanks to retrograde neuronal tracers separately injected into the SPL areas V6, V6A, PEc, and PE. These areas receive visual and somatosensory information distributed in a caudorostral, visuosomatic trend, and some of them are directly connected with the dorsal premotor cortex. This review is particularly focused on the origin and type of visual information reaching the SPL, and on the functional role this information can play in guiding limb interaction with objects in structured and dynamic environments.

Keywords: Area PEc; Area V6; Area V6A; Dorsal visual stream; Goal-directed arm movement; Sensorimotor integration.


Conflict of interest statement

The authors declare that they have no conflict of interest.

Figures

Fig. 1
Fig. 1
Subdivisions within the visual pathway from V1. Dorsal vs ventral visual streams and reach-to-grasp vs lateral grasping networks. A The dorsal visual stream is organized into two main routes: in the "reach-to-grasp" network (continuous thick arrows), visual information from V1 involves parietal areas of the superior parietal lobule (SPL) and reaches the dorsal premotor areas (PMd) (Fattori et al. 2017); the "lateral grasping" network (dashed arrows) involves parietal areas of the inferior parietal lobule (IPL) and reaches the ventral premotor areas (PMv) (Borra et al. 2017). In the ventral visual stream (double continuous thin arrows), the visual information from V1 reaches the inferior temporal cortex (ITc). B In the "reach-to-grasp" network, visual information, starting from V1, involves areas V6, V6A, PEc and MIP and reaches the premotor area F2. cs central sulcus, as arcuate sulcus, ips intraparietal sulcus, lf lateral fissure, ps principal sulcus, sts superior temporal sulcus, ls lunate sulcus, pos parieto-occipital sulcus, V1, V6, V6A, PEc, MIP, F2 areas V1, V6, V6A, PEc, MIP, F2, SPL superior parietal lobule, IPL inferior parietal lobule, ITc inferior temporal cortex, PMd dorsal premotor cortex, PMv ventral premotor cortex, A anterior, V ventral
Fig. 2
Fig. 2
Anatomical location, sensory properties and corticocortical connections of the SPL areas. A Posterior view of macaque occipital and parietal lobes. The right hemisphere (posterolateral view) has been partially dissected at the level of the fundus of intraparietal, parieto-occipital, and lunate sulci to show the hidden cortex of SPL. The medial surface of the left hemisphere is also visible. Continuous lines delimit the different SPL areas (in color) described in this work. B Incidence of visual and somatosensory cells in areas V6, V6A (V6Av and V6Ad), PEc, and PE. Data are obtained by the following studies (Galletti et al. ; Gamberini et al. , ; De Vitis et al. 2019). C Summary of cortical connections of areas V6, V6A (V6Av and V6Ad), PEc and PE modified from the following studies (Galletti et al. ; Gamberini et al. ; Bakola et al. , ; Passarelli et al. 2011). The boxes representing different areas are organized approximately in a caudal to rostral sequence, from the bottom part of the figure to the top. The proportion of neurons forming each connection is indicated by the thickness of the bars linking different areas. cal calcarine fissure, cin cingulate sulcus, V2, V3, V3A, V4/DP, V4T, MT, MST, V6Av, V6Ad, PEci, PGm, 31, 23, 24, PE, PEip, S1, PIVC, OPT, PGop, PG, PFop, Ri, dMIP, VIP, LIP, AIP, 2, 3b, 3a, 1, 46, F1, F3, F7 areas V2, V3, V3A, V4/DP, V4T, MT, MST, V6Av, V6Ad, PEci, PGm, 31, 23, 24, PE, PEip, S1, PIVC, OPT, PGop, PG, PFop, Ri, dMIP, VIP, LIP, AIP, 2, 3b, 3a, 1, 46, F1, F3, F7. Others abbreviations as in Fig. 1
Fig. 3
Fig. 3
Visuotopic organization and visual field representation in macaque areas V6, V6A and PEc. Dorsal and posteromedial views of a 3D reconstruction of a macaque right hemisphere showing the locations of areas V6, V6Av, and V6Ad in the anterior bank of POs, and the nearby area PEc on the dorsal surface of the SPL. The occipital pole (highlighted in white in the dorsal view) was cut away to show the anterior bank of POs. A Distribution in V6A and PEc of visual cells with receptive fields in the central (< 30°; brown dots) and peripheral (> 30°; teal dots) parts of the visual field, respectively. Brown and teal areas in V6 indicate the progression of receptive field eccentricity in the different parts of V6, according to the color coding shown at the bottom. B Distribution in V6A and PEc of visual cells with receptive fields in the lower (blue dots) or upper (red dots) visual field. White dots indicate receptive fields located on the horizontal meridian. Blue and red areas in V6 indicate the progression of visual field representation in different parts of V6 according to the color coding shown at the bottom. White squares and black circles represent the HM and VM meridians of area V6. Data obtained from the following studies (Gamberini et al. 2015, 2018). CF Distribution of receptive fields (light blue for V6 = 492, orange for V6Av = 585, pink for V6Ad = 324 and green for PEc = 56) with an outline of the most peripheral receptive field borders. The parts of the visual field where the receptive fields are more numerous and superimposed are represented with darker colors. Other abbreviations as in Fig. 1
Fig. 4
Fig. 4
Details of specific functional properties in area V6A. A Receptive field locations and preferred gaze directions of a cluster of cells recorded at different depths in area V6A, as indicated in (B), according to the scale reported on the left. The gray area indicates the screen location of the visually responsive region of the real-position cell. RP indicates a real-position cell. In the small squares, beside cell numbers on the left, the direction of the gaze modulation of visual responsiveness is reported: upward and downward arrows indicate that cells were visually responsive only when the animal looked upward and downward, respectively; point at the center indicates that cells were visually responsive only when the animal looked at the center of the screen. B Reconstruction of a microelectrode penetration through area V6A. Numbers 1–5 along the electrode track (pn) indicate the locations of the cluster of neurons grouped around a real-position cell. C Example of spatially tuned modulations of neural activity during outward attention epoch. Each inset contains the perievent time histogram, raster plots and eye position signals, and is positioned in the same relative position as the cue on the panel. In the bottom part of the figure, the spike density functions (SDFs) of the activity for each of the eight cue positions are superimposed and aligned on the cue onset. The mean duration of epochs FIX and outward attention is indicated below the SDFs. Neural activity and eye traces are aligned on the cue onset. Scale bar in perievent time histograms, 70 spikes/s. Bin width, 40 ms. Eye traces: scale bar, 60°. Data obtained from the following studies (Galletti et al. 1995, 2010)
Fig. 5
Fig. 5
Details of specific cortical connections. A Laminar pattern of labeling in V1 after V6 tracer injection. Caudal part of a parasagittal section taken at the level indicated on the brain silhouette at the bottom-right. Each single black dot represents a retrogradely labeled cell. The inset 'a' showing an enlargement of a part of the posterior branch of calcarine fissure (squared area on the section). Light blue triangles are single retrogradely labeled cells. Numbers and letters indicate the cortical layers in V1. B Frontal connections of areas PEc, V6Av, and V6Ad. Frontal lobe with cells (colored dots) labeled after retrograde tracer injection in areas PEc (green; three injections), V6Av (orange; two injections), and V6Ad (pink; three injections). Data obtained from Gamberini et al. (2009); Bakola et al. (2010); Passarelli et al. (2011) C Parcellation of agranular frontal cortex showing, overimposed, the representations of various body parts. Data modified from the following studies: Matelli et al. (1991); Luppino and Rizzolatti (2000). Other details and abbreviations as in Figs. 1 and 2
Fig. 6
Fig. 6
Thalamocortical connections of the SPL areas. A Average percentages of labeled cells in thalamic nuclei after tracer injections in areas V6, V6Av, V6Ad, PEc, and PE. Only labeling that represented > 1% of the thalamic afferents are reported. B Coronal section, left, taken approximately at the center of the thalamus shown on the right. Schematic representation of the thalamus with continuous lines delimiting the different thalamic nuclei: nuclei highlighted with different shades of gray are highly (more than 30% of thalamic afferents), moderately (> 5 < 30% of thalamic afferents), or weakly (less than 5% of thalamic afferents) connected with SPL areas. Data obtained from Gamberini et al. (2016) and Impieri et al. (2018). MD medial dorsal, VA ventral anterior, VL ventral lateral, VPL ventral posterior lateral, VPM ventral posterior medial, CL central lateral, CM/PF centromedian/parafascicular, Pcn paracentral, Cdc central densocellular, LD lateral dorsal, LP lateral posterior, PuM medial subdivision of pulvinar, PuL lateral subdivision of pulvinar, PuI inferior subdivision of pulvinar, LGN lateral geniculate nucleus, MGL medial geniculate nucleus. Other details and abbreviations as for Figs. 1 and 2
Fig. 7
Fig. 7
Patterns of cortical and thalamic input to SPL areas. A The pattern of cortical connections to SPL areas includes: "visual", striate and extrastriate visual areas; "bimodal", parietal areas located in the superior and inferior parietal lobule and on the mesial surface of the hemisphere; "somatosensory", somatosensory primary and secondary areas as well as multimodal areas in the insular cortex; "somatomotor", frontal, premotor and prefrontal cortex. B The pattern of thalamic afferents to SPL areas includes: "visual", the lateral and inferior subdivisions of pulvinar nucleus together with the lateral geniculate nucleus; "bimodal", the lateral posterior and the medial portion of the pulvinar nucleus; "somatosensory", the ventral posterior lateral nucleus; "somatomotor", the ventral lateral and ventral anterior nuclei; "oculomotor", medial nucleus together with intralaminar and periventricular nuclei with oculomotor related activity
Fig. 8
Fig. 8
Comparison between monkey and human SPLs. Left, dorsal view of the left hemisphere of macaque brain showing the location and extent of a number of SPL areas: the region colored in light blue is the visual cortex (that includes area V6) and belongs to Brodmann’s area 19; the region colored in orange, which includes areas PEc, V6A, MIP, and PGm, is responsive to both visual and somatosensory stimulations and belongs to Brodmann’s area 7; the region colored in blue (that includes area PE) is responsive to somatosensory stimulation but not to visual stimulation, and belongs to Brodmann’s area 5. Right, dorsal view of the left hemisphere of the human brain showing the location and extent of Brodmann’s areas 5 (blue), 7 (orange), and 19 (light blue). Modified from Gamberini et al. (2020)

References

    1. Andersen RA, Cui H. Intention, action planning, and decision making in parietal-frontal circuits. Neuron. 2009;63:568–583. doi: 10.1016/j.neuron.2009.08.028. - DOI - PubMed
    1. Andersen RA, Asanuma C, Essick G, Siegel RM. Corticocortical connections of anatomically and physiologically defined subdivisions within the inferior parietal lobule. J Comp Neurol. 1990;296:65–113. doi: 10.1002/cne.902960106. - DOI - PubMed
    1. Arcaro MJ, Pinsk MA, Li X, Kastner S. Visuotopic organization of macaque posterior parietal cortex: a functional magnetic resonance imaging study. J Neurosci. 2011;31:2064–2078. doi: 10.1523/JNEUROSCI.3334-10.2011. - DOI - PMC - PubMed
    1. Baizer JS, Ungerleider LG, Desimone R. Organization of visual inputs to the inferior temporal and posterior parietal cortex in macaques. J Neurosci. 1991;11:168–190. doi: 10.1523/JNEUROSCI.11-01-00168.1991. - DOI - PMC - PubMed
    1. Bakola S, Gamberini M, Passarelli L, et al. Cortical connections of parietal field PEc in the Macaque: linking vision and somatic sensation for the control of limb action. Cereb Cortex. 2010;20:2592–2604. doi: 10.1093/cercor/bhq007. - DOI - PubMed

LinkOut - more resources