. 2021 Sep 17;7(38):eabi5918.
doi: 10.1126/sciadv.abi5918. Epub 2021 Sep 15.

Biological resurfacing in a canine model of hip osteoarthritis

Affiliations

Biological resurfacing in a canine model of hip osteoarthritis

Bradley T Estes et al. Sci Adv. .

Abstract

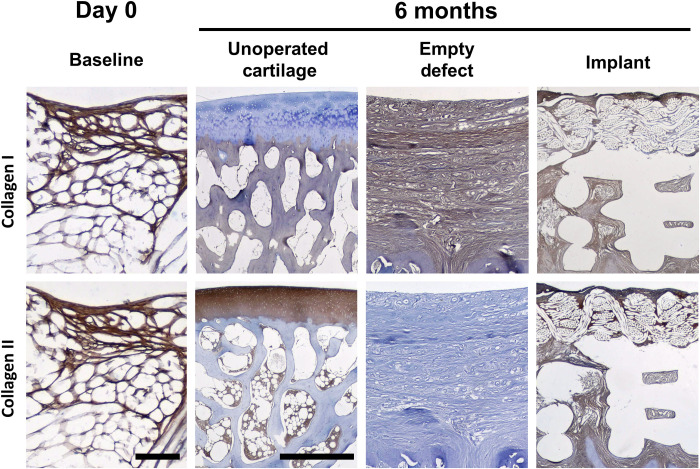
Articular cartilage has unique load-bearing properties but has minimal capacity for intrinsic repair. Here, we used three-dimensional weaving, additive manufacturing, and autologous mesenchymal stem cells to create a tissue-engineered, bicomponent implant to restore hip function in a canine hip osteoarthritis model. This resorbable implant was specifically designed to function mechanically from the time of repair and to biologically integrate with native tissues for long-term restoration. A massive osteochondral lesion was created in the hip of skeletally mature hounds and repaired with the implant or left empty (control). Longitudinal outcome measures over 6 months demonstrated that the implant dogs returned to normal preoperative values of pain and function. Anatomical structure and functional biomechanical properties were also restored in the implanted dogs. Control animals never returned to normal and exhibited structurally deficient repair. This study provides clinically relevant evidence that the bicomponent implant may be a potential therapy for moderate hip osteoarthritis.


Figures

Fig. 1.
Fig. 1.. Implant configuration and surgical procedure.
(A) The cartilage component is constructed of a 3D woven textile, and (B) additive manufacturing is used to make a printed base, which, when fused together, form the (C) final bicomponent implant (D) 10 mm in diameter by ~2 mm deep. (E) 3D schematic of the woven textile demonstrating orthogonality of the structure. (F and G) Scanning electron microscopy images demonstrate bonding and encapsulation (black arrow) of woven yarns (white arrows) in the first layer of the printed PCL component (black asterisks). Scale bars, 100 μm. (H) MSC seeding (green fluorescence) is followed by (I) expansion, differentiation, and tissue development ex vivo. (J) Control defect site and (K) implant disposition are shown at the time of surgery. (L) A capsulorrhaphy procedure, standard in the canine model, was used to stabilize the joint. Photo credit: Franklin Moutos, Cytex Therapeutics Inc.
Fig. 2.
Fig. 2.. Gait analysis.
Measured kinetic GRF indices including (A) PVF, (B) VI, (C) PPF, and (D) PI (all based on % BW) rapidly returned to baseline in the implant group; conversely, the empty defect group kinetic indices never returned to normal. (E) Body weight distribution of the operated limb in standing (measured by a pressure-sensitive walkway) showed a return to baseline in both groups. Data are presented as change from baseline, normalized by BW. (F) Change in limb circumference as measured by the difference between operated limb and contralateral unoperated limb indicates recovery of muscle volume in the implant group and persistent atrophy in the empty defect group, *P < 0.05. (G) Pain scores (CROPI-h) were consistently lower in the implant group compared to the control group; however, no time/treatment interaction was observed (P = 0.075). (H) Weights of animals throughout the study. Means ± SD with a two-factor (treatment and time) ANCOVA model were used with responses dijk and covariate xij: Overall time and treatment effect P values are noted on figures, no time*treatment interactive effects were observed in any of the measures. # indicates no difference from baseline in the implant group; $ indicates no difference from baseline in the control group, P < 0.05.
Fig. 3.
Fig. 3.. Actimetry data.
(A to H) Total activity count expressed as the average per minute activity over the preceding 2-week period, shown for each hour of the day (at baseline, 1, 2, 3, 4, 5, and 6 months postoperatively). Significant treatment effects were observed at each monthly interval (P = 0.0031). Significant interactive effects were also noted, particularly month*hour (P < 0.05) and treatment*hour (P < 0.0001) as observed by the different trends in the two peaks of activity measured when the animals were interacting with the care technicians. (H) Across the 6-month period, significant differences were noted between the hours of 7:00 a.m. and 4:00 p.m. (*P < 0.05 and +P < 0.0001). The implant group returned to baseline at hours 7 and 14 in month 1, while the control group never returned to baseline. # indicates no difference from baseline in the implant group at hours 7 and 14.
Fig. 4.
Fig. 4.. Radiographic and synovial inflammation suggests inhibition of OA progression in the treatment group.
Ventral-dorsal radiographic examples demonstrate (A) obvious bone loss and exostosis in ring form (white arrows), giving a slight conical appearance of the femoral head in the control animals and (B) what appears to be a radiographically healthy joint in the experimental implant group as noted by the absence of any extraarticular bone remodeling. (C) Radiographic OA severity shows a significant effect of time (P = 0.0005) but not treatment, although a trend was noted toward a treatment effect at the later time points (P > 0.05; # indicates no difference from baseline in the implant group). Histological sections showing (D) severe and (E) mild cases of synovial hyperplasia and chronic inflammation, respectively, with black arrows indicating examples of giant cells. H&E histology stain: Scale bars, 0.1 mm. (F) Semiquantitative scoring of synovial tissues (maximum score of 3: normal, 0; mild, 1; moderate, 2; and severe, 3) for chronic inflammation severity, synovial hyperplasia severity, and the presence of giant cells. Further details of the scoring matrix are provided in table S1.
Fig. 5.
Fig. 5.. Gross findings/histology.
(A to C) The smooth implant contour typically matched native anatomy (dog 6) (black arrows). Round ligament is visible (black arrowheads). (D to F) Empty defects (left to right: dogs 7, 2, and 7) (black arrows) showed significant fibrocartilage filling. (G) Mallory Aniline Blue (MAB) of empty defects (dog 13) showed unhealed fibrous-filled depressions (white asterisk − dotted line = ~original articular surface). Inset (millimeter scale): Magnification of defect. (H) Undecalcified implant section (dog 6) revealed host tissue integration and a smooth surface without irregularities (black triangle). Trichrome (millimeter scale) (I) with limited new bone formation (white asterisk). (J) Undecalcified section (dog 11) (trichrome) demonstrates congruency with native surfaces (black arrowhead). Z-fiber (black arrow) presence demonstrates implant integrity. (K) Representative Safranin O/Fast Green staining (dog 12) showed fibrous bonding to adjacent cartilage at defect margins (black arrows) (79×). (L) H&E (dog 11) showing fibrous tissue (white asterisk) around PCL struts (79×). (M) Representative microradiograph (dog 11) revealed limited bone formation within the base (white arrows). (N) Decalcified histology (dog 6) showed fibrous growth in/on the implant (MAB, 31×) (O) and few chondrocytes (dog 10) in the implant woven component (black arrows) (Alcian blue–periodic acid–Schiff, 79×). See figs. S2 to S8 and table S2 for all animal images. Photo credit: Bradley Estes, Cytex Therapeutics Inc.
Fig. 6.
Fig. 6.. Immunohistochemical labeling for collagen I and II at day 0 and after 6 months in vivo.
Scale bars, (day 0 implants) 0.1 mm and (6-month tissues/implants) 1 mm. Day 0 specimens are both from dog 12. Unoperated cartilage images are from the left femoral head of dog 13. Empty defect images are from the right femoral head of dog 13, and the implant images are from dog 11.
Fig. 7.
Fig. 7.. Modified O’Driscoll scoring per component and total score.
Higher scores indicate better healing. Maximum score is 20 points. Groups not sharing the same letter are statistically different (Student’s t test for comparisons of each pair, P < 0.05).
Fig. 8.
Fig. 8.. Instantaneous and equilibrium compressive moduli of implants at day of surgery and after 6 months in vivo.
Groups not sharing the same letter are statistically different [analysis of variance (ANOVA), P < 0.05].

References

    1. Keener J. D., Callaghan J. J., Goetz D. D., Pederson D. R., Sullivan P. M., Johnston R. C., Twenty-five-year results after charnley total hip arthroplasty in patients less than fifty years old—A concise follow-up of a previous report. J. Bone Joint Surg. Am. Vol. 85A, 1066–1072 (2003). - PubMed
    1. Hangody L., Dobos J., Balo E., Panics G., Hangody L. R., Berkes I., Clinical experiences with autologous osteochondral mosaicplasty in an athletic population: A 17-year prospective multicenter study. Am. J. Sports Med. 38, 1125–1133 (2010). - PubMed
    1. Saris D. B., Vanlauwe J., Victor J., Almqvist K. F., Verdonk R., Bellemans J., Luyten F. P.; TIG/ACT/01/2000&EXT Study Group , Treatment of symptomatic cartilage defects of the knee: Characterized chondrocyte implantation results in better clinical outcome at 36 months in a randomized trial compared to microfracture. Am. J. Sports Med. 37 ( Suppl. 1), 10S–19S (2009). - PubMed
    1. Filardo G., Vannini F., Marcacci M., Andriolo L., Ferruzzi A., Giannini S., Kon E., Matrix-assisted autologous chondrocyte transplantation for cartilage regeneration in osteoarthritic knees: Results and failures at midterm follow-up. Am. J. Sports Med. 41, 95–100 (2013). - PubMed
    1. Niemeyer P., Lenz P., Kreuz P. C., Salzmann G. M., Sudkamp N. P., Schmal H., Steinwachs M., Chondrocyte-seeded type I/III collagen membrane for autologous chondrocyte transplantation: Prospective 2-year results in patients with cartilage defects of the knee joint. Art Ther. 26, 1074–1082 (2010). - PubMed

LinkOut - more resources