. 2021 Sep 17;7(38):eabh1376.
doi: 10.1126/sciadv.abh1376. Epub 2021 Sep 15.

Nanoscale molecular architecture controls calcium diffusion and ER replenishment in dendritic spines

Affiliations

Nanoscale molecular architecture controls calcium diffusion and ER replenishment in dendritic spines

Kanishka Basnayake et al. Sci Adv. .

Abstract

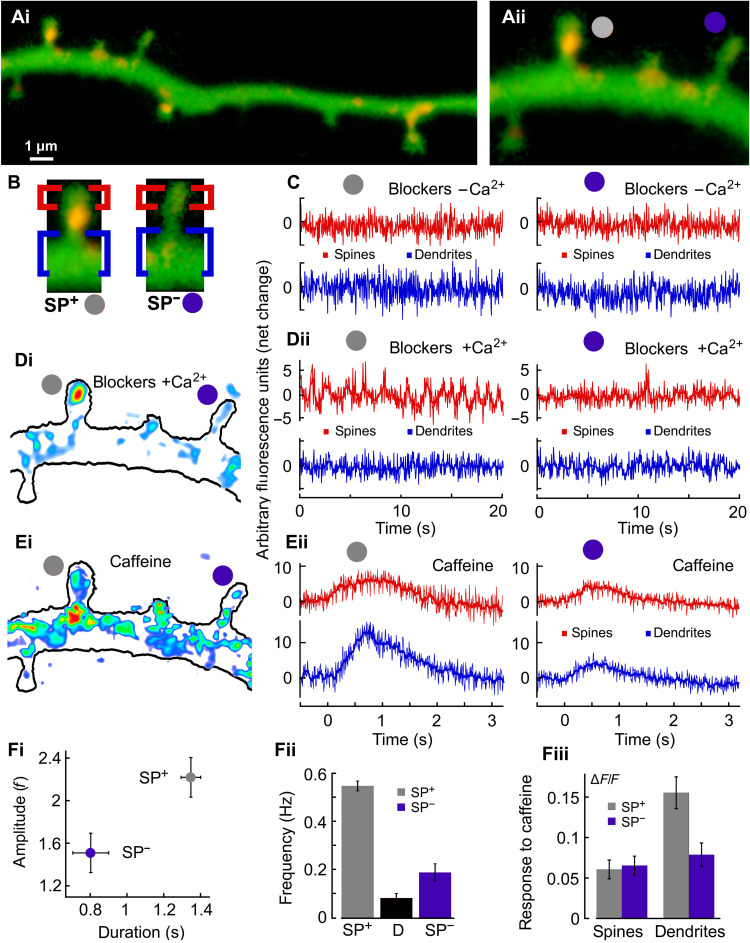
Dendritic spines are critical components of neuronal synapses as they receive and transform synaptic inputs into a succession of calcium-regulated biochemical events. The spine apparatus (SA), an extension of smooth endoplasmic reticulum, regulates slow and fast calcium dynamics in spines. Calcium release events deplete SA calcium ion reservoir rapidly, yet the next cycle of signaling requires its replenishment. How spines achieve this replenishment without triggering calcium release remains unclear. Using computational modeling, calcium and STED superresolution imaging, we show that the SA replenishment involves the store-operated calcium entry pathway during spontaneous calcium transients. We identified two main conditions for SA replenishment without depletion: a small amplitude and a slow timescale for calcium influx, and a close proximity between SA and plasma membranes. Thereby, spine’s nanoscale organization separates SA replenishment from depletion. We further conclude that spine’s receptor organization also determines the calcium dynamics during the induction of long-term synaptic changes.


Figures

Fig. 1.
Fig. 1.. Refilling or depleting the SA in dendritic spines with slow versus fast calcium transients.
(A) Top: Blue fluorescent protein (blue) and SP (red) cotransfected in hippocampal neurons, cultured for 3 weeks, and loaded with the Fluo-2 high-affinity calcium sensor. A large SP+ spine attached to an axon (blue arrowhead) and several SP spines can be seen. Bottom: Same region with a white contour and two regions of interest: behind (red) and in front of (blue) the SP-labeled SA are shown. Synaptic activity was blocked using tetrodotoxin (TTX; 1 μM), APV (50 μM), and DNQX (20 μM). Following a caffeine addition of 5 mM, release of calcium is observed toward the base of the spine but not in the spine head. (B) Top: Spontaneous calcium activity due to store-operated calcium entry (SOCE) only located in the spine head. Bottom: Time course of calcium activity in the head versus base following caffeine addition. Both are typical single realizations of the recordings. (C) Top: Segmented recording of spontaneous calcium activity in the spine head. Bottom: Overlapped average of the fluctuation segments larger than a predefined threshold of 1 SD (SD = 0.0457 in the example trial shown in the top). Bottom shows the average of 18 such sequences.
Fig. 2.
Fig. 2.. Modeling SA depletion and refilling with slow versus fast calcium inputs.
(A) Schematic of the spine domain (green) with its calcium inputs and regulators (see Materials and Methods for channel models). [B (i)] Simulated synaptic inputs with an instantaneous injection amplitude of N = 300 ions, repeated each time when the calcium in the spine reaches zero [B (ii) green curve at t = 0, 30.9, and 80.1 s. [B (ii)] Calcium dynamics in the spine head (green) versus base (magenta) following fast inputs. [B (iii)] SA reservoir of 500 ions depleted during fast inputs upon three CICR events. [C (i)] Slow calcium input to spine head with SOCE, fitted with a difference of two exponentials over 2 s (black curve, accounting for 94.5% of the distribution) and discretized into 25 bins (blue histogram: R2 = 0:9986). The barcode represents the injection times of single ions. [C (ii)] Simulated calcium levels in the spine head and base during the slow input of [C (i)] (total injection N = 300; five trials averaged). [C (iii)] SA reservoir always increase without depletion under slow SOCE conditions with different numbers of SERCA pumps NSERCA and SA plasma membrane distances dSA.
Fig. 3.
Fig. 3.. Local calcium storage in dendritic spines.
(A) Dendrite of a rat hippocampal cultured neuron, transfected with synaptopodin (SP) (red puncta) and loaded with Fluo-2. [A (ii)] Magnification of (A) with two spines with similar lengths ≈1.2 μm: left, SP+ (gray circle); right, SP (purple). (B) Labeling of SP+/− spines with head (red) and base (blue) regions. (C) Recordings in calcium-free medium with activity blockers. Sustaining these conditions for 15 min partially depleted calcium stores and initiated SOCE (not shown). [D (i)] Colored representation of the background-subtracted calcium transient (low calcium, blue/cyan; and higher levels, red > yellow > green). [D (ii)] Recordings from the same regions with activity blockers and extracellular calcium (2 mM). [E (i)] Examples of caffeine-induced calcium transient {background levels subtracted; same colors as [D (i)]}. [E (ii)] Calcium release from internal stores due to caffeine bath application (5 mM) uniquely observed in the SP+ spine bases. [F (i)] Amplitudes and durations of calcium fluctuations in SP+ (gray dot) and SP spine heads (purple) (n = 16 for both, P < 0.001, t test). [F (ii)] Frequency of calcium fluctuations in SP+ heads (gray), dendrites (black), and in SP spines (purple). [F (iii)] Caffeine responses in SP+ spine heads, SP dendrites, and SP heads were approximately the same but significantly weaker than in the SP+ dendritic sites (all groups: n = 16, P < 0.001, ANOVA).
Fig. 4.
Fig. 4.. SERCA-ORAI1 distributions and consequences.
(A to D) Distances between SERCA3 and ORAI1 puncta in dendritic spines of hippocampal neurons from adult mouse brain slices. (A) Green fluorescent protein (GFP)–labeled neurons (green), immunostained for ORAI1 (magenta), SERCA3 (cyan), and SP (yellow). Representative images show the five conditions analyzed in (B). (B) Quantified colocalization between ORAI1, SERCA3, and SP proteins. Four slices, each with 279 to 364 spine heads were analyzed. (C). The three conditions analyzed in (D), with the same colors as in (A). (D) Quantified SERCA3-ORAI1 distances in spine head, neck, and base. Statistical analysis involved one-way ANOVA and Tukey’s multiple comparisons tests. (B) and (D). s: **P < 0.01, ***P < 0.001. (E) Schematic of calcium regulators in the simulated spine model also showing the distance dSA between the plasma and SA membranes. (F) Normalized fractions of calcium entering SA under instantaneous inputs to spine heads for different amplitudes N with (black and red) and without (green) calcium pumps. Of the 100 trials, we chose here the ones without a RyR activation until there were no more ions to simulate. (G) Same fractions as in (F) during slow calcium influx with the previously shown 2-s protocol under different N values and when pumps were removed for N = 100. Error bars in (F) and (G) = SEM.
Fig. 5.
Fig. 5.. Simulations of calcium transients in spines during LTP and LTD induction protocols.
(A) Schematic of a spine with SA and injected calcium. (B) Postsynaptic LTP protocol with 100-Hz stimulations followed by 30-s silences (SOCE only). The injection starts from N = 300 (or 500) and decays according to the model in Afterward, the injection was allowed to decay slowly with successive events, accounting for synaptic depression (26). (C) LTD protocol is induced by injecting a calcium spike every 1 s. [D (i)] Average number of calcium at the spine base during the first 250 ms of LTP induction. (Mean and SEM are from 20 trials). [D (ii)] Number of calcium ions in SA at the beginning of the LTP protocol (20 trials averaged). [D (iii)] Simulated SA refilling during the silent phase of LTP. Calcium input into spine head is a succession of the slow entry described in Fig. 2C (i). Time courses of SA calcium refilling (blue) that reach high, low, and medium values. Mean (red) and SEM are from 10 trials. [E (i)] Calcium response at the spine base after each 1-Hz spike of the LTD protocol over 300 time courses (30-s simulations ×10). [E (ii) and (iii)] Number of calcium ions in the SA during the first 250 ms and the total 30 s of the LTD protocol. (F and G) Interpretation of the LTP protocol as CICR at the base followed by SA replenishment, while during LTD, the calcium is maintained at low level.
Fig. 6.
Fig. 6.. Physiological conditions for SA depletion versus replenishment.
(A) Synaptic currents entering the dendritic spines through NMDAR and AMPAR trigger CICR by activating RyRs at the base. (B) Small calcium inputs with slow time scales through ORAI1 channels located near the SA membrane are insufficient to trigger a CICR at the base. These ions are either absorbed into calcium pumps located in the spine head or replenish the SA calcium reservoir via the SOCE through SERCA pumps. (C) Phase space described by the main axes: calcium injection rate and the distance dSA between the ORAI1 and SERCA channels. Refilling and depletion conditions of calcium in spines are well separated, so that both do not occur at the same time.

References

    1. Cummings J. A., Mulkey R. M., Nicoll R. A., Malenka R. C., Ca2+ signaling requirements for long-term depression in the hippocampus. Neuron 16, 825–833 (1996). - PubMed
    1. Segal M., Dendritic spines and long-term plasticity. Nat. Rev. Neurosci. 6, 277–284 (2005). - PubMed
    1. R. Yuste, Dendritic Spines (MIT press, 2010).
    1. Murakoshi H., Yasuda R., Postsynaptic signaling during plasticity of dendritic spines. Trends Neurosci. 35, 135 (2012). - PMC - PubMed
    1. Yuste R., Bonhoeffer T., Morphological changes in dendritic spines associated with long-term synaptic plasticity. Annu. Rev. Neurosci. 24, 1071–1089 (2001). - PubMed