. 2022 Jan 27;139(4):584-596.
doi: 10.1182/blood.2021013201.

The STAT3-MYC axis promotes survival of leukemia stem cells by regulating SLC1A5 and oxidative phosphorylation

Affiliations

The STAT3-MYC axis promotes survival of leukemia stem cells by regulating SLC1A5 and oxidative phosphorylation

Maria L Amaya et al. Blood. .

Abstract

Acute myeloid leukemia (AML) is characterized by the presence of leukemia stem cells (LSCs), and failure to fully eradicate this population contributes to disease persistence/relapse. Prior studies have characterized metabolic vulnerabilities of LSCs, which demonstrate preferential reliance on oxidative phosphorylation (OXPHOS) for energy metabolism and survival. In the present study, using both genetic and pharmacologic strategies in primary human AML specimens, we show that signal transducer and activator of transcription 3 (STAT3) mediates OXPHOS in LSCs. STAT3 regulates AML-specific expression of MYC, which in turn controls transcription of the neutral amino acid transporter gene SLC1A5. We show that genetic inhibition of MYC or SLC1A5 acts to phenocopy the impairment of OXPHOS observed with STAT3 inhibition, thereby establishing this axis as a regulatory mechanism linking STAT3 to energy metabolism. Inhibition of SLC1A5 reduces intracellular levels of glutamine, glutathione, and multiple tricarboxylic acid (TCA) cycle metabolites, leading to reduced TCA cycle activity and inhibition of OXPHOS. Based on these findings, we used a novel small molecule STAT3 inhibitor, which binds STAT3 and disrupts STAT3-DNA, to evaluate the biological role of STAT3. We show that STAT3 inhibition selectively leads to cell death in AML stem and progenitor cells derived from newly diagnosed patients and patients who have experienced relapse while sparing normal hematopoietic cells. Together, these findings establish a STAT3-mediated mechanism that controls energy metabolism and survival in primitive AML cells.


Figures

None
Graphical abstract
Figure 1.
Figure 1.
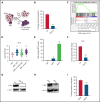
STAT3 is expressed in primary AML cells and plays a role in OXPHOS. (A) Western blot showing total and phosphorylated STAT3 levels in mononuclear cells derived from 2 cord blood (CB) and 18 human primary AML samples. (B) qPCR showing mRNA expression levels of STAT3 in 3 primary AML samples treated with scramble siRNA (siSCR) control or siRNA against STAT3 (siSTAT3) after 48 hours of culture. (C) Western blot showing STAT3 protein levels 48 hours after transfection of siSTAT3 compared with siSCR. (D) Seahorse Cell Mito Stress Test showing OCR at the time of highest STAT3 knockdown (24-48 hours) of a representative primary AML sample. (E) Combined data showing changes in basal OCR, ATP production, and maximal respiratory capacity in 4 primary AML samples, including sample 1D, upon STAT3 inhibition by siRNA. (F) Viability assay of STAT3-deficient cells compared with scramble control (siSCR) after 60 hours in culture (48 hours of siRNA KD plus 12 hours of viability). (G) Structure of the salicylamide STAT3 inhibitor SF25 (STAT3i). (H) Cell-based ELISA performed in HeLa cells showing cellular STAT1α, STAT3, STAT5A, and STAT5B binding to an immobilized DNA consensus sequence in the presence or absence of STAT3i as well as niclosamide. (I) Viability assay in 8 primary AML samples treated with various doses of STAT3i for 24 hours compared with vehicle control. (J) Maximal respiratory capacity changes based on Seahorse Cell Mito Stress Test in 3 primary AML samples upon treatment with 5 μM of STAT3i for 4 hours compared with vehicle control. Statistical analyses were performed using the Student t-test. P values are represented as follows: *P ≤ .05; **P ≤ .01; ***P ≤ .001; ****P ≤ .0001.
Figure 2.
Figure 2.
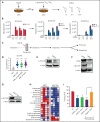
STAT3 regulates OXPHOS in LSCs via transcriptional regulation of MYC. (A) Cartoon depiction of sorting scheme for LSCs. (B) Maximal respiratory capacity changes based on Seahorse Cell Mito Stress Test in LSCs isolated form 3 primary AML samples after treatment with 5 μM of STAT3i for 4 hours compared with vehicle control. (C) RNA-sequencing showing expression changes in the MYC targets pathway in LSCs isolated from 4 primary AML samples after treatment with 5 μM of STAT3i compared with vehicle control. (D) Expression data from BloodSpot showing differences in MYC expression in AML cells compared with hematopoietic stem cells (HSCs). CBF, core-binding factor; Complex, complex cytogenetics. (E) ChIP-PCR showing STAT3 binding to MYC promoter region. Data are shown as percent input and normalized to negative IgG control. AcH3 is used as a positive control (n = 3). (F) qPCR comparing MYC expression of LSCs treated with 5 μM of STAT3i for 4 hours compared with vehicle control. (G) Western blot comparing protein levels of Myc in LSCs treated with 5 μM of STAT3i for 4 hours compared with vehicle control. (H) Western blot showing Myc protein expression 48 hours after siRNA transfection. (I) Seahorse Cell Mito Stress Test showing changes in maximal respiratory capacity of 4 primary AML samples 48 hours after transfection of either siRNA against MYC or scramble control. Statistical analyses were performed using the Student t-test. P values are represented as follows: *P ≤ .05; **P ≤ .01; ***P ≤ .001; ****P ≤ .0001.
Figure 3.
Figure 3.
STAT3 promotes glutaminolysis in LSCs via MYC’s regulation of the transporter SLC1A5. (A) Cartoon depiction of experimental design. LSCs are isolated from primary human AML cells and then treated with 5 μM of STAT3i vs vehicle control for 3 hours. Stable-isotope labeled 13C5,15N2-L-Glutamine is then added to the media, and cells are collected at 1, 8, and 16 hours and analyzed by mass spectrometry. (B) Tracing experiments showing changes in intracellular glutamine, glutamate, and glutathione in LSCs after 4 hours of treatment with 5 μM of STAT3i compared with vehicle control (n = 4). (C) Cartoon depiction of hypothesized pathway by which STAT3 regulates glutaminolysis. (D) Data from BloodSpot showing SLC1A5 gene expression in AML cells compared with HSCs. CBF, core-binding factor; Complex, complex cytogenetics. (E) Western blot showing protein levels of SLC1A5 in LSCs after a 4-hour incubation period with 5 μM of STAT3i compared with vehicle control. (F) Western blot showing protein levels of SLC1A5 after knocking down MYC in a human primary AML patient sample. (G) Western blot showing SLC1A5 protein levels after 48 hours of siRNA knockdown compared with scramble control. (H) Heat map of steady-state metabolomics in primary AML cells treated with siSCR versus siSLC1A5. (I) Seahorse assay showing OCR after 40 minutes of 5 μM of STAT3i-treated LSCs in the presence or absence of media supplemented with 10× glutamine. These conditions were then recapitulated in the presence of a plasma membrane permeabilizer (n = 4). Statistical analyses were performed using the Student t-test. P values are represented as follows: *P ≤ .05; **P ≤ .01; ***P ≤ .001; ****P ≤ .0001.
Figure 4.
Figure 4.
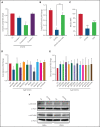
STAT3 regulates ETC activity of LSCs. (A) Bar graph representing complex activity of complexes I, II/III, and V in 3 primary AML samples after treatment with 5 μM STAT3i or vehicle control for 4 hours. (B) Complex II/II activity of 3 primary AML samples treated with 5 μM STAT3i or vehicle control for 4 hours. Cells were incubated on metabolomics media or in the presence of 4 mM glutamine and 4 mM cell-permeable α-KG. (C) Mitochondrial ROS as measured by flow cytometry in LSCs isolated from 3 primary AML samples and treated with 5 μM of STAT3i for 4 hours compared with vehicle control; 4 μM of cell-permeable GSH was used as positive control. (D) qPCR showing gene expression of ETC complex genes in LSCs isolated from 3 primary AML samples and treated with 5 μM of STAT3i for 4 hours or vehicle control. (E) Gene expression from RNA sequencing of mitochondrial genes in LSCs treated with 5 μM of STAT3i for 4 hours or vehicle control (n = 4). (F) Western blot showing protein levels of MT-CO1 and MT-ND2 in LSCs treated with or without 5 μM of STAT3i for 4 hours. Statistical analyses were performed using the Student t-test. P values are represented as follows: *P ≤ .05; **P ≤ .01; ***P ≤ .001; ****P ≤ .0001.
Figure 5.
Figure 5.
Inhibition of STAT3 leads to selective eradication of LSCs compared with HSPCs. (A) Viability of LSCs isolated from 6 primary human AML samples, 3 at the time of diagnosis and 3 at the time of relapse, after 24-hour treatment with 5 µM of STAT3i compared with vehicle control. (B) Percent number of colonies from 3 primary AML samples treated with 5µM of STAT3i or vehicle control for 24 hours and plated in human methylcellulose media for up to 14 days. (C) Western blot showing protein level of STAT3 after treatment with shRNA against STAT3 or scramble control (shSCR). (D) Percent number of colonies in 3 primary AML samples treated with either shSTAT3 or shSCR. (E) Viability of CD34+ cells (HSPCs) isolated from 3 human cord blood samples and treated with 5 µM of STAT3i vs vehicle control after 24 hours. NS, not significant. (F) Percent colonies of HSPCs isolated from 3 cord blood samples and treated with either 5 µM of STAT3i or vehicle control for 24 hours and plated in human methylcellulose media for up to 14 days. (G) Percent engraftment at 8 to 10 weeks of 3 primary AML samples pretreated with either 5 μM of STAT3i or vehicle control overnight and injected into busulfan-treated NSG-S mice. The sample in bracket was used for secondary transplant, which shows complete eradication of LSCs. (H) Percent human blasts in mice engrafted with a primary AML samples and treated in vivo with 30 mg/kg of STAT3i or vehicle control intraperitoneally daily for 6 days. Statistical analyses were performed using the Student t-test. P values are represented as follows: *P ≤ .05; **P ≤ .01; ***P ≤ .001; ****P ≤ .0001.
Figure 6.
Figure 6.
Hypothesized model. STAT3 is phosphorylated at Y705, which signals its localization to the nucleus to regulate the expression of several genes, including MYC. MYC, in turn, promotes expression of the amino acid transporter SLC1A5, allowing influx of glutamine into the cell and, ultimately, abundance of TCA cycle intermediates and GSH. TCA cycle intermediates then promote OXPHOS by ETC activity. GSH is known to promote glutathionylation of the ETC complex II, which is important for its activity. Upon inhibition of STAT3, glutaminolysis is compromised, decreasing levels of glutamate, GSH, and TCA cycle intermediates, thereby decreasing OXPHOS in LSCs.

References

    1. Shah A, Andersson TM, Rachet B, Björkholm M, Lambert PC. Survival and cure of acute myeloid leukaemia in England, 1971-2006: a population-based study. Br J Haematol. 2013;162(4):509-516. - PubMed
    1. Siegel RL, Miller KD, Jemal A. Cancer statistics, 2019. CA Cancer J Clin. 2019;69(1):7-34. - PubMed
    1. Eppert K, Takenaka K, Lechman ER, et al. . Stem cell gene expression programs influence clinical outcome in human leukemia. Nat Med. 2011;17(9):1086-1093. - PubMed
    1. Gentles AJ, Plevritis SK, Majeti R, Alizadeh AA. Association of a leukemic stem cell gene expression signature with clinical outcomes in acute myeloid leukemia. JAMA. 2010;304(24):2706-2715. - PMC - PubMed
    1. Ho TC, LaMere M, Stevens BM, et al. . Evolution of acute myelogenous leukemia stem cell properties after treatment and progression. Blood. 2016;128(13): 1671-1678. - PMC - PubMed

Publication types

MeSH terms

Substances