. 2021 Sep 14;54(9):2117-2132.e7.
doi: 10.1016/j.immuni.2021.08.019.

Resident memory CD8+ T cells in regional lymph nodes mediate immunity to metastatic melanoma

Affiliations

Resident memory CD8+ T cells in regional lymph nodes mediate immunity to metastatic melanoma

Aleksey K Molodtsov et al. Immunity. .

Abstract

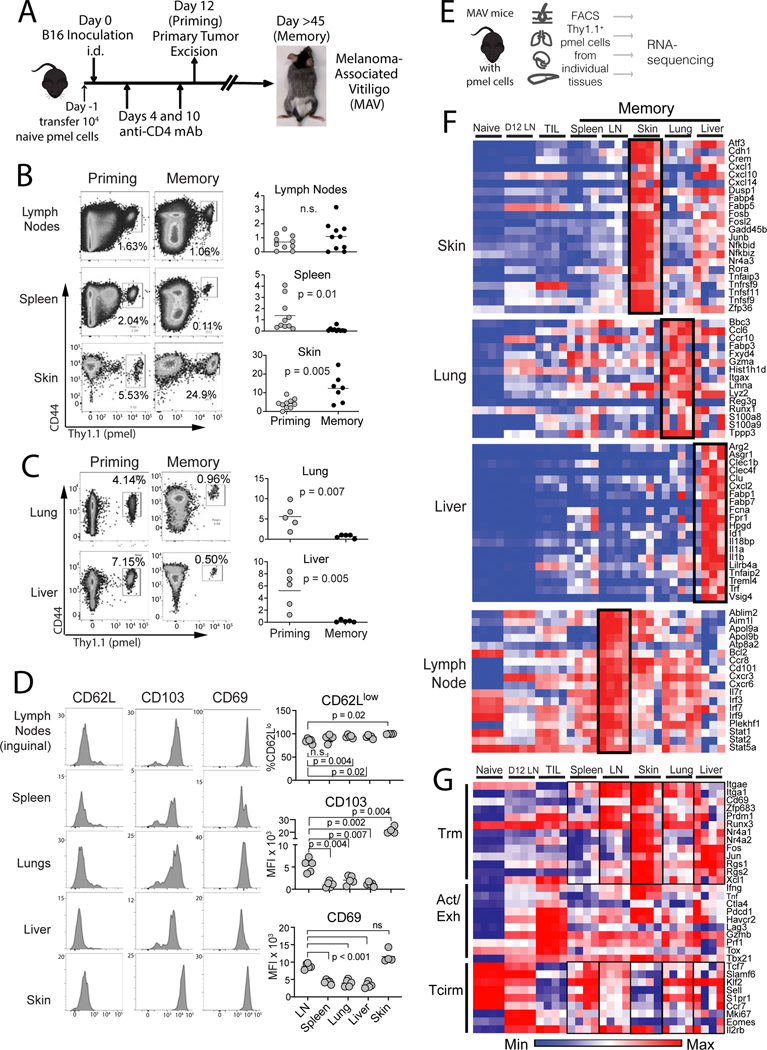
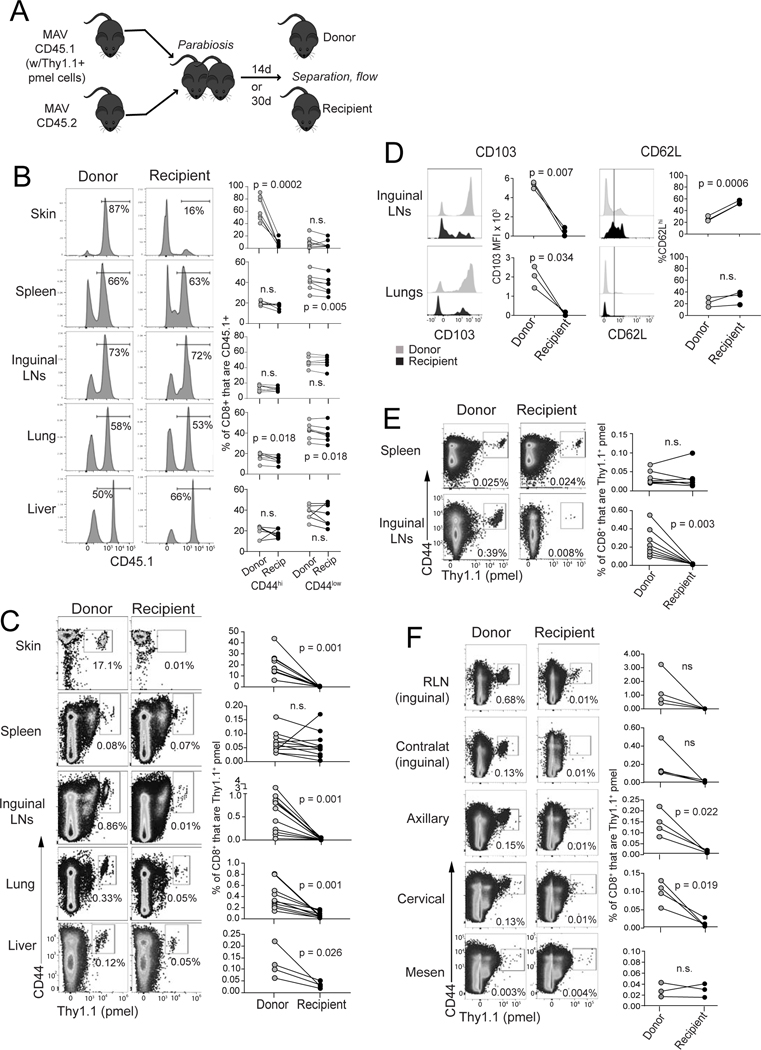
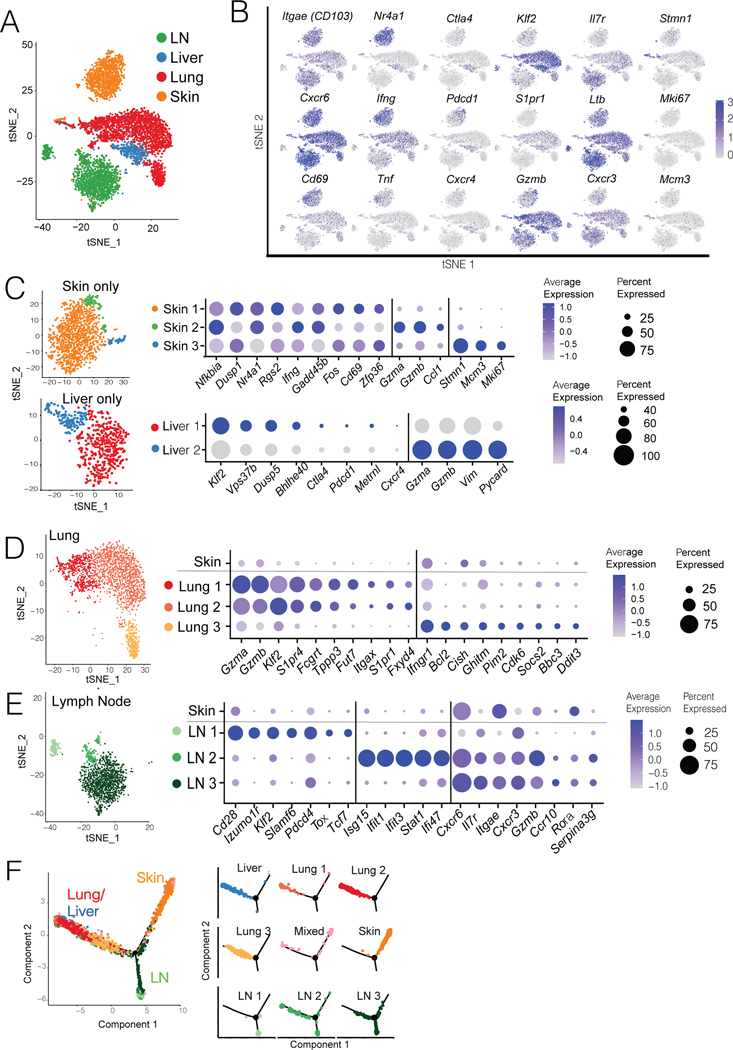
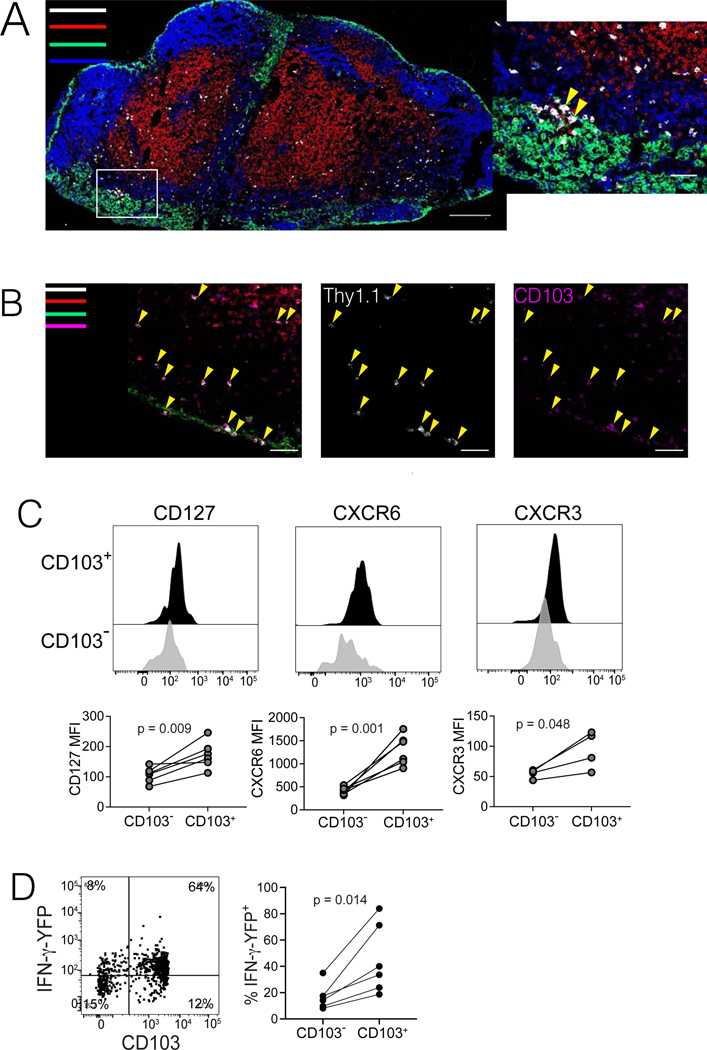
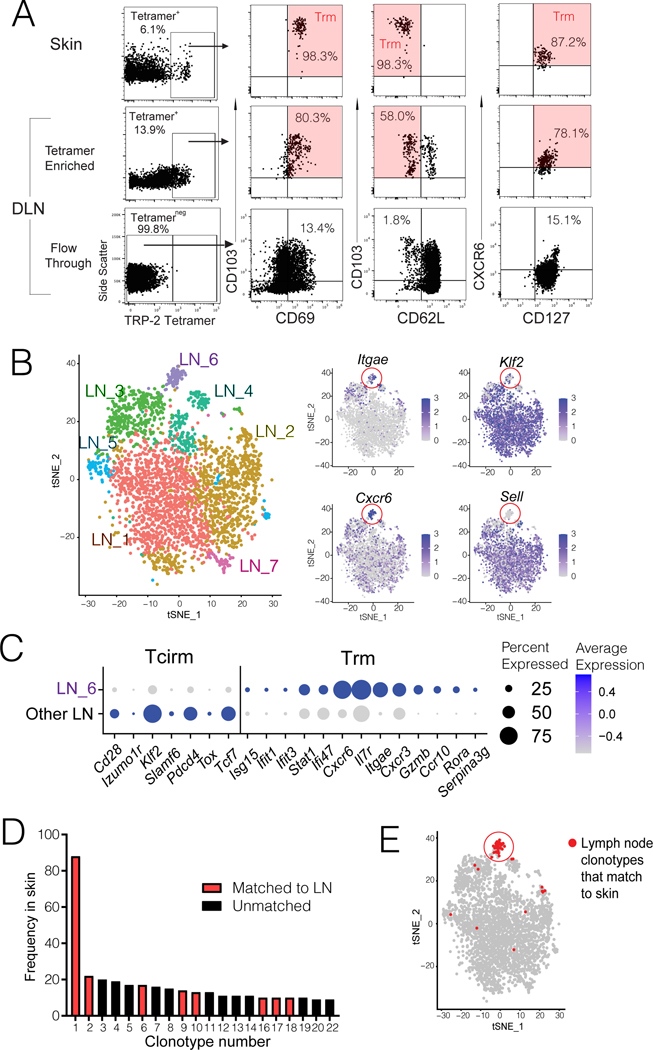
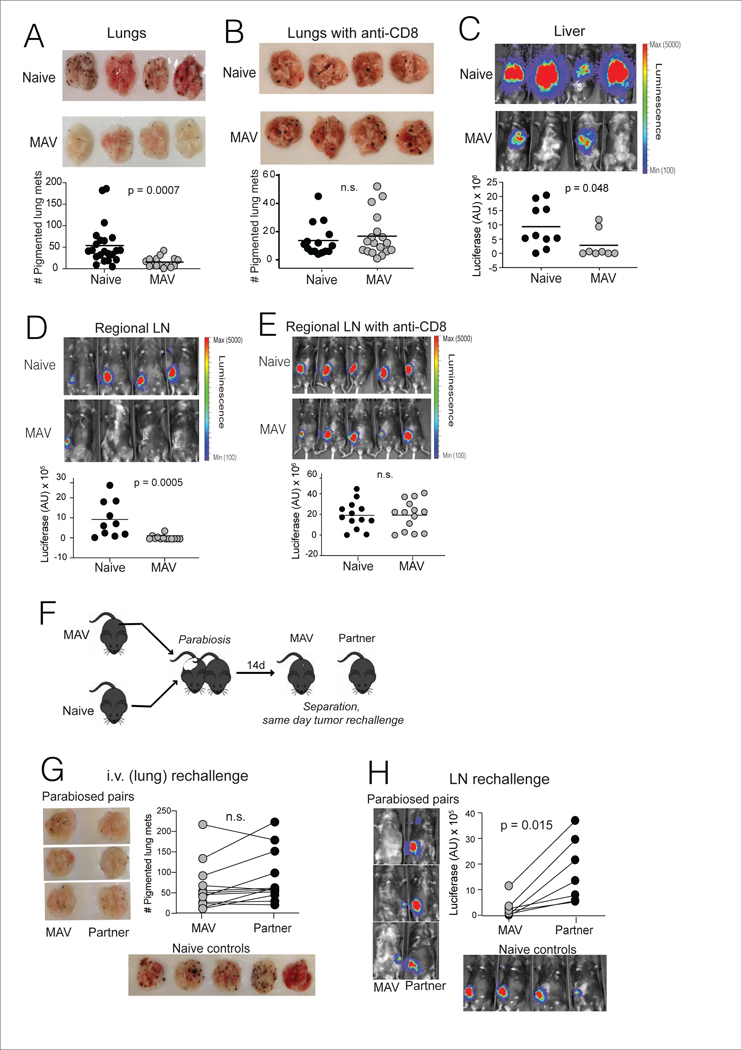
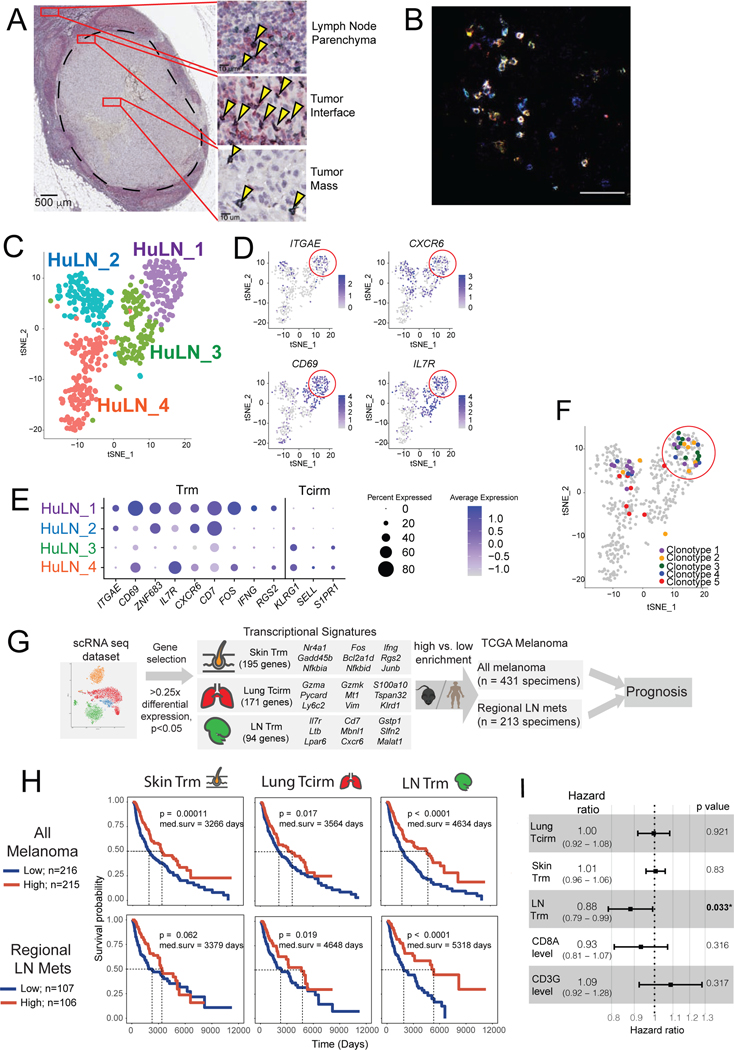
The nature of the anti-tumor immune response changes as primary tumors progress and metastasize. We investigated the role of resident memory (Trm) and circulating memory (Tcirm) cells in anti-tumor responses at metastatic locations using a mouse model of melanoma-associated vitiligo. We found that the transcriptional characteristics of tumor-specific CD8+ T cells were defined by the tissue of occupancy. Parabiosis revealed that tumor-specific Trm and Tcirm compartments persisted throughout visceral organs, but Trm cells dominated lymph nodes (LNs). Single-cell RNA-sequencing profiles of Trm cells in LN and skin were distinct, and T cell clonotypes that occupied both tissues were overwhelmingly maintained as Trm in LNs. Whereas Tcirm cells prevented melanoma growth in the lungs, Trm afforded long-lived protection against melanoma seeding in LNs. Expanded Trm populations were also present in melanoma-involved LNs from patients, and their transcriptional signature predicted better survival. Thus, tumor-specific Trm cells persist in LNs, restricting metastatic cancer.

Keywords: CD69; CD8 T cells; CXCR6; Cancer; TCR; TRP-2; Trm; parabiosis; scRNA-seq; vitiligo.


Conflict of interest statement

Declaration of interests Authors declare no competing interests.

Figures

Figure 1.
Figure 1.. Mice with melanoma-associate vitiligo (MAV) sustain transcriptionally distinct melanoma-specific CD8+ T cell populations throughout lymphoid and peripheral tissues.
(A) Schematic diagram depicting the generation of MAV with sentinel pmel T cell populations. (B-C) proportion of CD44hi pmel cells (gated on total CD8+) in each tissue on the day of tumor excision (priming) or 28–45 days later (memory). (D) Phenotype of pmel cells 150 days post surgery (gated on CD8+Thy1.1+). Symbols represent individual mice; horizontal lines depict means; significance was determined by unpaired (B-C) or paired t test (D), with n.s. (non-significant) denoting p > 0.05. Flow plots depict representative mice. Data were either pooled from 2 independent experiments (B) or taken from a single representative experiment (C-D). Each experiment was conducted twice with similar results. (E) Schematic diagram depicting workflow for bulk RNAseq. (F-G) RNAseq on memory pmel T cells, relative to pmel cells from naïve spleens (Naïve), d12 tumor-draining LNs (D12 LN), or from B16 tumors (TIL); heatmaps show log-transformed transcript per million (TPM) expression of (F) most differentially expressed genes in each tissue, or (G) representative Trm, Activation/Exhaustion, and Tcirm genes. (F-G) Each RNA-seq sample contained sorted pmel cells pooled from a single tissue of 5 mice, and a total of n=4 such pooled samples were analyzed for each group.
Figure 2.
Figure 2.. Melanoma/melanocyte Ag-specific memory T cells durably reside in lungs and lymph nodes.
(A) Schematic diagram depicting parabiosis experiments involving mice with MAV (at least 30 days after tumor excision); CD8+ T cell populations were assessed in different tissues of donor vs. recipient mice either 14 days (B-D and F) or 30 days (E) after parabiotic joining. (B) Distribution of total CD45.1+ cells (representative mice gated on CD8+; left). Right: populations are further divided based on high/low expression of CD44. (C) Distribution of Thy1.1+ pmel cells (gated on CD8+ cells) across tissues. (D) Expression of CD103 and CD62L (gated on CD8+Thy1.1+ pmel cells. (E) Distribution of Thy1.1+ pmel cells (gated on CD8+ cells) after 30 days parabiotic joining. (F) Distribution of Thy1.1+ pmel cells in individual lymph nodes (gated on CD8+ cells). Symbols represent individual mice with lines joining parabiotic partners. Data in each panel are pooled from two independent experiments with the exception of panel (D), which depicts a single experiment. Each experiment was conducted twice with similar results. Significance was determined by paired t test (or by Wilcoxon matched pairs test for data that were not normally distributed); n.s. (non-significant) indicates p > 0.05.
Figure 3.
Figure 3.. Heterogenous populations of tumor-specific CD8+ T cells with Trm and Tcirm transcriptional features are present throughout lymphoid and peripheral tissues.
Pmel T cells were harvested and FACS sorted from skin, lungs, liver, and lymph nodes of mice with MAV (see Figure 1E). Gene expression was determined by single cell (sc) RNA sequencing using the 10X Genomics platform. Each sample consisted of pmel cells from 5 mice, pooled. Each dot in a tSNE plot corresponds to a single cell. t-SNE plots displaying (A) 5727 total memory pmel cells isolated from all tissues, colored by tissue of origin; (B) feature plots depict representative expression of selected genes. (C) 1266 cells from skin (top) and 575 cells from liver (bottom), re-clustered to identify further heterogeneity. Expression plots (right) depict average Z-transformed normalized expression of representative genes in each cluster. (D-E) From clustering in panel A, further analysis of (D) 2322 pmel cells from lungs and (E) 1625 cells from LNs; Expression plots at right depict average Z-transformed normalized expression of representative genes in each cluster with skin as a reference population. (F) Reconstruction of a trajectory from pseudotemporal analysis (Monocle) of individual pmel cells from all tissues, colored by Seurat-defined clusters. (Left) The trajectory contains two branch points, and (Right) individual clusters are depicted.
Figure 4.
Figure 4.. LN Trm cells distribute throughout T cell zones and paracortical regions of LNs, and express IFN-γ.
(A-B) Immunofluorescence confocal microscopy of pmel cells in RLN of mice with MAV. (A) Colors indicate staining for anti-CD8 (red), anti-B220 (blue), anti-CD169 (green), and anti-Thy1.1+ (pmel cells; white). Inset at right depicts pmel cells (yellow arrows) in proximity to CD169+ cells in the subcapsular sinus. (B) Staining was performed as in panel A, but including anti-CD103 (magenta) instead of B220, to identify CD103-expressing Trm cells. Yellow arrows indicate Thy1.1+ pmel cells (middle), most of which co-express CD103 (right), both in the T cell zone and subcapsular sinus regions. Microscopic images are each representative of at least two sections taken from multiple RLNs, with scale bars indicated. (C) Phenotypic analysis of pmel cells (gated on CD8+Thy1.1+ cells) taken from inguinal LNs of mice with MAV, depicting differences in phenotypes of CD103+ versus CD103 populations. (D) Mice were treated to induce MAV as in Figure 1A, however pmel tracer populations expressed an IFNγ-IRES-YFP reporter. Flow cytometry was conducted on cells taken from RLNs to detect expression of YFP in CD103+ Trm population (direct ex vivo, without peptide restimulation). (C-D) Histograms/dot plots depict representative samples; data shown in each panel are either pooled from two independent experiments (CD127 and CXCR6 and YFP) or from a single experiment (CXCR3). Experiments were conducted twice with similar results. Points represent values from individual mice with lines joining populations within a mouse. Significance was determined by paired t test; n.s. (not significant) denotes p > 0.05.
Figure 5.
Figure 5.. Lymph node Trm populations are comprised of endogenous tumor-specific T cells.
Endogenous CD8+ T cells from regional LNs of mice with MAV (induced as in Figure 1A, but without pmel cell transfer) were analyzed by either (A) tetramer staining or (B-C) scRNAseq and paired TCRseq, with skin as a reference population. (A) H-2Kb TRP-2180–188 tetramer staining, gated on CD8+CD44+ cells from skin (top row), or draining LN tetramer-enriched and - depleted fractions (middle and bottom rows). Phenotype of each gated population is shown at right; Trm phenotype is highlighted in red. Data are representative of two experiments. (B) tSNE clustering of 3266 FACS-sorted CD8+CD44+ T cells from regional LNs pooled from 15 mice with MAV, analyzed by scRNAseq, revealing seven distinct transcriptional clusters (left) with representative Trm and Tcirm gene expression depicted across clusters (right); red circles highlight the LN_6 cluster. (C) Plots depict average Z-transformed normalized expression of representative Trm and Tcirm genes in LN_6 cluster relative to all other LN clusters. (D) Frequency of twenty most expanded clonotypes in skin of these mice, indicating eight clones that were matched to cells from regional LNs. (E) tSNE projection of LN clusters highlighting (in red) those T cells that were clonally matched to skin. Each dot corresponds to a single cell.
Figure 6.
Figure 6.. Trm cells provide protection against melanoma in regional lymph nodes.
(A-G) MAV was induced as in Figure 1A, but without transfer of tracer pmel cell populations. Mice were rechallenged 45d post tumor-excision through various routes: (A-B) 1×10⁵ B16 cells were injected into the tail vein, and surface lung metastases were counted 21d later; (B) mice recieved anti-CD8 depleting mAb on days −4, −2, +2, +9 and +16 relative to tumor rechallenge. (C) 0.25 × 10⁵ B16-luciferase cells were injected into the portal vein, and liver metastases were imaged 21d later, or (D-E) 0.25 × 10⁵ B16-luciferace cells were directly injected into regional lymph nodes (RLN) draining the prior site of tumor excision, and LN tumor burden was imaged 7d later. (E) mice received anti-CD8 depleting mAb on days −4, −2, and +2 relative to tumor inoculation. (F) Schematic diagram depicting parabiosis tumor rechallenge experiments. Mice were separated after 14 days and rechallenged as described above to produce tumor growth in lungs (G) or (H) lymph node, with tumor growth assessed as in panels A and D. Naïve controls were C57BL-6 mice that received concurrent tumor inoculation via the indicated route. Symbols represent individual mice, (A-E) horizontal lines depict means, and (G-H) lines join parabiotic pairs. Significance was determined by Mann Whitney test (A, B, and D), unpaired t test (C and E), or Wilcoxon matched pairs test (F and G); n.s. (non-significant) denotes P > 0.05. Data in each panel are pooled from two independent experiments.
Figure 7.
Figure 7.. LN Trm cells are found in melanoma-involved lymph nodes in humans, where their transcriptional signature portends improved survival.
(A) Immunohistochemistry on patient melanoma-involved sentinel lymph nodes, stained with anti-CD8 (green) and anti-CD69 (red), with co-stained cells (black; arrows) detected throughout regions. Image of LN is from a single patient, but with similar cells identified in a total of n=4 patients. (B) Immunofluorescence of metastatic melanoma patient tumor-involved LN, with CD8+CD103+CD69+ triple-stained cells appearing white. Image is representative of specimens from n=2 patients analyzed. (C-F) ScRNAseq and paired TCR seq of 501 CD8+ T cells FACS sorted from a tumor-invaded LN of a melanoma patient with oligometastatic disease. (C) tSNE clustering, revealing four distinct transcriptional clusters. (D) Representative expression of TRM-associated genes, red circle highlights the Hu_LN1 cluster; each dot corresponds to a single cell. (E) Average Z-transformed normalized expression of representative Trm and Tcirm genes across the clusters. (F) tSNE projection of clusters indicating (in color) individual cells comprising the five most highly expanded TCR clonotypes. (G) Schematic diagram depicting workflow for generating memory T cell subset transcriptional signatures from mouse scRNAseq dataset, and applying signatures to melanoma patient specimen data from The Cancer Genome Atlas. (C) Kaplan-Meier plots indicating the prognostic value of enrichment of the indicated single cell-derived binary memory T cell signatures (skin Trm, lung Tcirm, and LN Trm) in all TCGA melanoma specimens (top, n=431), or regional lymph node metastases only (bottom; n=213); patients were stratified into high and low groups based on the mean. (I) Forest plot showing the hazard ratios estimated based on multivariate Cox proportional hazards regression analysis of TCGA metastatic melanoma specimens (n=345).

References

    1. Asano K, Nabeyama A, Miyake Y, Qiu CH, Kurita A, Tomura M, Kanagawa O, Fujii S, and Tanaka M. (2011). CD169-positive macrophages dominate antitumor immunity by crosspresenting dead cell-associated antigens. Immunity 34, 85–95. - PubMed
    1. Beura LK, Wijeyesinghe S, Thompson EA, Macchietto MG, Rosato PC, Pierson MJ, Schenkel JM, Mitchell JS, Vezys V, Fife BT, et al. (2018). T Cells in Nonlymphoid Tissues Give Rise to Lymph-Node-Resident Memory T Cells. Immunity 48, 327–338 e325. - PMC - PubMed
    1. Blomberg OS, Spagnuolo L, and de Visser KE (2018). Immune regulation of metastasis: mechanistic insights and therapeutic opportunities. Dis Model Mech 11. - PMC - PubMed
    1. Brown M, Assen FP, Leithner A, Abe J, Schachner H, Asfour G, Bago-Horvath Z, Stein JV, Uhrin P, Sixt M, and Kerjaschki D. (2018). Lymph node blood vessels provide exit routes for metastatic tumor cell dissemination in mice. Science 359, 1408–1411. - PubMed
    1. Buggert M, Nguyen S, Salgado-Montes de Oca G, Bengsch B, Darko S, Ransier A, Roberts ER, Del Alcazar D, Brody IB, Vella LA, et al. (2018). Identification and characterization of HIV-specific resident memory CD8(+) T cells in human lymphoid tissue. Sci Immunol 3. - PMC - PubMed

Publication types