. 2022 Mar 17;29(3):358-372.e5.
doi: 10.1016/j.chembiol.2021.08.011. Epub 2021 Sep 14.

Synergistic PIM kinase and proteasome inhibition as a therapeutic strategy for MYC-overexpressing triple-negative breast cancer

Affiliations

Synergistic PIM kinase and proteasome inhibition as a therapeutic strategy for MYC-overexpressing triple-negative breast cancer

Ratika Kunder et al. Cell Chem Biol. .

Abstract

Triple-negative breast cancer (TNBC) is the breast cancer subtype with the poorest clinical outcome. The PIM family of kinases has emerged as a factor that is both overexpressed in TNBC and associated with poor outcomes. Preclinical data suggest that TNBC with an elevated MYC expression is sensitive to PIM inhibition. However, clinical observations indicate that the efficacy of PIM inhibitors as single agents may be limited, suggesting the need for combination therapies. Our screening effort identifies PIM and the 20S proteasome inhibition as the most synergistic combination. PIM inhibitors, when combined with proteasome inhibitors, induce significant antitumor effects, including abnormal accumulation of poly-ubiquitinated proteins, increased proteotoxic stress, and the inability of NRF1 to counter loss in proteasome activity. Thus, the identified combination could represent a rational combination therapy against MYC-overexpressing TNBC that is readily translatable to clinical investigations.

Keywords: MYC oncoprotein; PIM kinase inhibitor; Triple-negative breast cancer; chemical genetics; proteasome inhibitors; protein homeostasis; proteotoxic stress; rational combination therapy.


Conflict of interest statement

Declaration of interests The authors declare no competing interest.

Figures
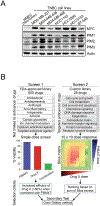
Figure 1.
Figure 1.. Drug combination screens performed in a chemo-resistant human TNBC cell line, MDA-MB-436.
(A) Protein expression levels of MYC and the PIM family of kinases (PIM1, -2, -3) in a panel of human TNBC cell lines and non-immortalized, non-tumorigenic human mammary epithelial cells (HMEC). Actin serves as a loading control. (B) Schematic representation of the drug combination screens performed in this study.
Figure 2.
Figure 2.. Identification of the PIMi/20Si combination as the most synergistic drug combination.
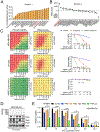
(A) Results from Screen 1 (Fig. 1B) performed in the MDA-MB-436 cell line. The top 20 out of 34 hits identified (out of 600 tested) are listed. Carfilzomib, which was pursued in this study, is highlighted in red. (B) Results from Screen 2 (Fig. 1B) performed in the MDA-MB-436 cell line. Carfilzomib, which was pursued in this study, is highlighted in red (n = 3). (C) Left and middle columns: Representative 10 × 10 dose-response matrices showing percent viability and Bliss analysis of predicted versus observed cell viability in the indicated TNBC and non-tumorigenic HMEC cells treated with PIM447 and carfilzomib. Bliss scores > 0 = synergy, close to zero = additivity, and < 0 denote antagonism. Right column: Dose-response curves, determined by CellTiter-Glo assay (Promega), showing the effect of PIM447 alone, carfilzomib alone, or both combined on the indicated TNBC and HMEC cells (n = 3). Combination index (CI) was calculated according to the Chou-Talalay method using the CompuSYN software, where CI < 1 denotes synergy, CI = 1 denotes additivity, and CI > 1 denotes antagonism. (D) Representative western blots showing expression of PIM1, -2, and -3 in MDA-MB-436 cells transiently transfected with Cas9 proteins and the indicated PIM-specific, synthetic multi-guide sgRNA or a nonspecific control sgRNA. Actin serves as a loading control. The resulting cells represent heterogenous KO pools and not single-cell clones. (E) The effects of carfilzomib (CFZ) on relative cell viability in the cells shown in (D) (n = 3). Cas9/PIM-specific sgRNA-transfected cells were treated with CFZ for 72 h before subjected to CellTiter-Glo assay. Error bars represent means +/− SEM. P-values were calculated by a two-tailed t-test. **p < 0.01, ***p < 0.001, ****p < 0.0001.
Figure 3.
Figure 3.. Biological pathways affected by the PIM447/carfilzomib combination.
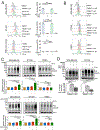
(A) Left: Venn diagram illustrating the effects of PIM447 alone, carfilzomib alone, or both combined on the proteome in MDA-MB-436 cells as determined by label-free quantitative proteomics analysis. Right: Volcano plots showing the distribution of >1600 proteins with their relative protein abundance in the indicated comparison groups. The HSPA1B; HSPA1A (HSP70) were determined as statistically significant proteins by a t-test using a permutation-based FDR method for multiple hypothesis corrections using LFQ intensity derived by MaxQuant. Significance lines: FDR<0.05. (B) The effects of PIM447 or GDC-0339 alone, carfilzomib (CFZ) alone, or both combined on the abundance of HSP70 in the indicated TNBC lines and HMEC (non-tumor) cells. PARP cleavage indicates apoptosis. Actin serves as a loading control. Numbers in red indicate the relative protein expression of HSP70. (C) Summaries of the cellular pathways dysregulated by PIM447 alone, carfilzomib alone, or both combined as determined by the Hallmark Gene Enrichment Analysis (top) or the Reactome pathway analysis (bottom). FDR: False discovery rate (FDR)-adjusted p-values.
Figure 4.
Figure 4.. The effects of the PIM447/carfilzomib combination on the abundance of general reactive oxygen species (ROS) and accumulation of poly-ubiquitinated proteins.
(A) Representative graphs showing the effects of PIM447 alone, carfilzomib (CFZ) alone, or both combined on the abundance of ROS as determined by the CellRox Flow Kit (ThermoFisher) in the indicated TNBC lines and HMEC cells (left) and quantification of changes in ROS levels (right) (n = 3). (B) The effects of PIM447 at indicated concentrations on ROS levels. (C) Representative western blots showing the effects of PIM447 or GDC-0339 alone (5 μM), carfilzomib alone (3 nM), or both combined on the abundance of poly-ubiquitinated proteins (top) and quantification of western signals (bottom) (n = 3). Actin serves as loading as well as the normalization control. (D) Western blots showing the effects of the PIM447 (5 μM)/carfilzomib (3 nM) combination on the abundance of poly-ubiquitinated proteins in the absence or presence of NAC at the indicated concentrations (top) and quantification of western signals (bottom) (n = 3). The cells were pretreated with NAC for 45 min before treatment with the combination. Actin serves as loading as well as the normalization control. Error bars represent means +/− SEM. P-values were calculated by a two-tailed t-test. *p < 0.05 **p < 0.01, ***p < 0.001, ****p < 0.0001; N.S, not significant.
Figure 5.
Figure 5.. The effects of the PIM447/carfilzomib combination on proteasome activity.
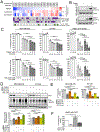
(A) Heat map representation of the effects of PIM447 alone (5 μM), carfilzomib alone (3 nM), or both combined on the relative abundance of proteasome subunits in MDA-MB-436 cells as determined by label-free quantitative proteomics analysis. MYC target gene set #1 is from (Zeller et al., 2003), #2 is from (X. Chen et al., 2008), and #3 is from (Jonghwan Kim et al., 2008). The list of the top 23 TNBC vulnerability genes is from (Petrocca et al., 2013). (B) Western analysis of the effects of PIM47 alone (5 μM), carfilzomib (CFZ) alone (3 nM), and both combined on NRF1 expression in the indicated TNBC lines. Actin serves as a loading control. (C) The effects of PIM447 or GDC-0339 alone, carfilzomib alone, or both combined at the indicated concentrations on proteasome activity in the indicated TNBC lines and HMEC cells as measured by Proteasome 20S Activity Assay Kit (Sigma). The assay was run in duplicate (n = 3), and each data point corresponds to each assay well in a 96-well plate. (D) Western blots showing the effects of carfilzomib in the presence or absence of MYC siRNAs (two siRNA sequences) on the abundance of poly-ubiquitinated proteins in the indicated TNBC lines (left) and quantification of western signals (poly-ubiquitin) (right). Actin serves as loading as well as the normalization control. (E) The effects of carfilzomib in the presence or absence of MYC siRNAs on proteasome activity. The assay was run in duplicate (n = 4), and each data point corresponds to each assay well in a 96-well plate. (F) The effects of carfilzomib on proteasome activity in the presence or absence of exogenous MYC activation in HMEC-MYC-ER cells. The cells were pretreated with 4OH-TAM for 24 h before treatment with carfilzomib. Error bars represent means +/− SEM. P-values were calculated by a two-tailed t-test. *p < 0.05 **p < 0.01, ***p < 0.001, ****p < 0.0001; N.S, not significant.
Figure 6.
Figure 6.. Antitumor effects of the PIM447/carfilzomib combination in vivo.
(A) In vivo growth of MDA-MB-436 and BT-549 orthotopic xenograft tumors in NSG mice treated with PIM447 alone, carfilzomib (CFZ) alone, or both combined at indicted doses for 3 weeks (MDA-MB-436, n = 5 mice in each treatment group; BT-549, n = 3~5 in each treatment group). Error bars represent means +/− SEM. P-values were calculated by linear regression analysis comparing the slopes. (B) Western blots showing the effects of PIM447 alone, carfilzomib alone, or both combined on the abundance of poly-ubiquitinated proteins, HSP70, and NRF1 in the indicated tumor samples collected on day 4 (MDA-MB-436) or after 3 weeks of treatment (day 22) (MDA-MB-436 and BT-549). For day 4 samples, two tumor samples from two independent mice are represented for each treatment group. Numbers in red indicate relative protein expression. For day 22 samples, three samples from three independent mice are represented for each treatment group. Actin serves as a loading control. (C) Quantification of western signals corresponding to poly-ubiquitinated proteins, HSP70, and NRF1 in day 22 samples in (B), where actin serves as a normalization control. Error bars represent means +/− SEM. P-values were calculated by a two-tailed t-test. *p < 0.05 **p < 0.01, ***p < 0.001; N.S, not significant.
Figure 7.
Figure 7.
Schematic representation of the proposed mechanisms of drug synergy between PIMi and 20Si in MYC+ TNBC cells.

References

    1. Besse A, Besse L, Kraus M, Mendez-Lopez M, Bader J, Xin B-T, de Bruin G, Maurits E, Overkleeft HS, Driessen C, 2019. Proteasome Inhibition in Multiple Myeloma: Head-to-Head Comparison of Currently Available Proteasome Inhibitors. Cell Chem Biol 26, 340–351.e3. doi:10.1016/j.chembiol.2018.11.007 - DOI - PubMed
    1. BLISS CI, 1939. THE TOXICITY OF POISONS APPLIED JOINTLY1. Annals of Applied Biology 26, 585–615. doi:10.1111/j.1744-7348.1939.tb06990.x - DOI
    1. Brasó Maristany F, Filosto S, Catchpole S, Marlow R, Quist J, Francesch Domenech E, Plumb DA, Zakka L, Gazinska P, Liccardi G, Meier P, Gris-Oliver A, Cheang MCU, Perdrix Rosell A, Shafat M, Noël E, Patel N, McEachern K, Scaltriti M, Castel P, Noor F, Buus R, Mathew S, Watkins J, Serra V, Marra P, Grigoriadis A, Tutt AN, 2016. PIM1 kinase regulates cell death, tumor growth and chemotherapy response in triple-negative breast cancer. Nat. Med doi:10.1038/nm.4198 - DOI - PMC - PubMed
    1. Burger MT, Nishiguchi G, Han W, Lan J, Simmons R, Atallah G, Ding Y, Tamez V, Zhang Y, Mathur M, Muller K, Bellamacina C, Lindvall MK, Zang R, Huh K, Feucht P, Zavorotinskaya T, Dai Y, Basham S, Chan J, Ginn E, Aycinena A, Holash J, Castillo J, Langowski JL, Wang Y, Chen MY, Lambert A, Fritsch C, Kauffmann A, Pfister E, Vanasse KG, Garcia PD, 2015. Identification of N-(4-((1R,3S,5S)-3-Amino-5-methylcyclohexyl)pyridin-3-yl)-6-(2,6-difluorophenyl)-5-fluoropicolinamide (PIM447), a Potent and Selective Proviral Insertion Site of Moloney Murine Leukemia (PIM) 1, 2, and 3 Kinase Inhibitor in Clinical Trials for Hematological Malignancies. J. Med. Chem 58, acs.jmedchem.5b01275–8386. doi:10.1021/acs.jmedchem.5b01275 - DOI - PubMed
    1. Caenepeel S, Brown SP, Belmontes B, Moody G, Keegan KS, Chui D, Whittington DA, Huang X, Poppe L, Cheng AC, Cardozo M, Houze J, Li Y, Lucas B, Paras NA, Wang X, Taygerly JP, Vimolratana M, Zancanella M, Zhu L, Cajulis E, Osgood T, Sun J, Damon L, Egan RK, Greninger P, McClanaghan JD, Gong J, Moujalled D, Pomilio G, Beltran P, Benes CH, Roberts AW, Huang DC, Wei A, Canon J, Coxon A, Hughes PE, 2018. AMG 176, a Selective MCL1 Inhibitor, Is Effective in Hematologic Cancer Models Alone and in Combination with Established Therapies. Cancer Discov 8, 1582–1597. doi:10.1158/2159-8290.CD-18-0387 - DOI - PubMed

Publication types

MeSH terms

Substances

LinkOut - more resources