. 2021 Oct 20;12(10):958-968.e6.
doi: 10.1016/j.cels.2021.08.009. Epub 2021 Sep 14.

Minimizer-space de Bruijn graphs: Whole-genome assembly of long reads in minutes on a personal computer

Affiliations

Minimizer-space de Bruijn graphs: Whole-genome assembly of long reads in minutes on a personal computer

Barış Ekim et al. Cell Syst. .

Abstract

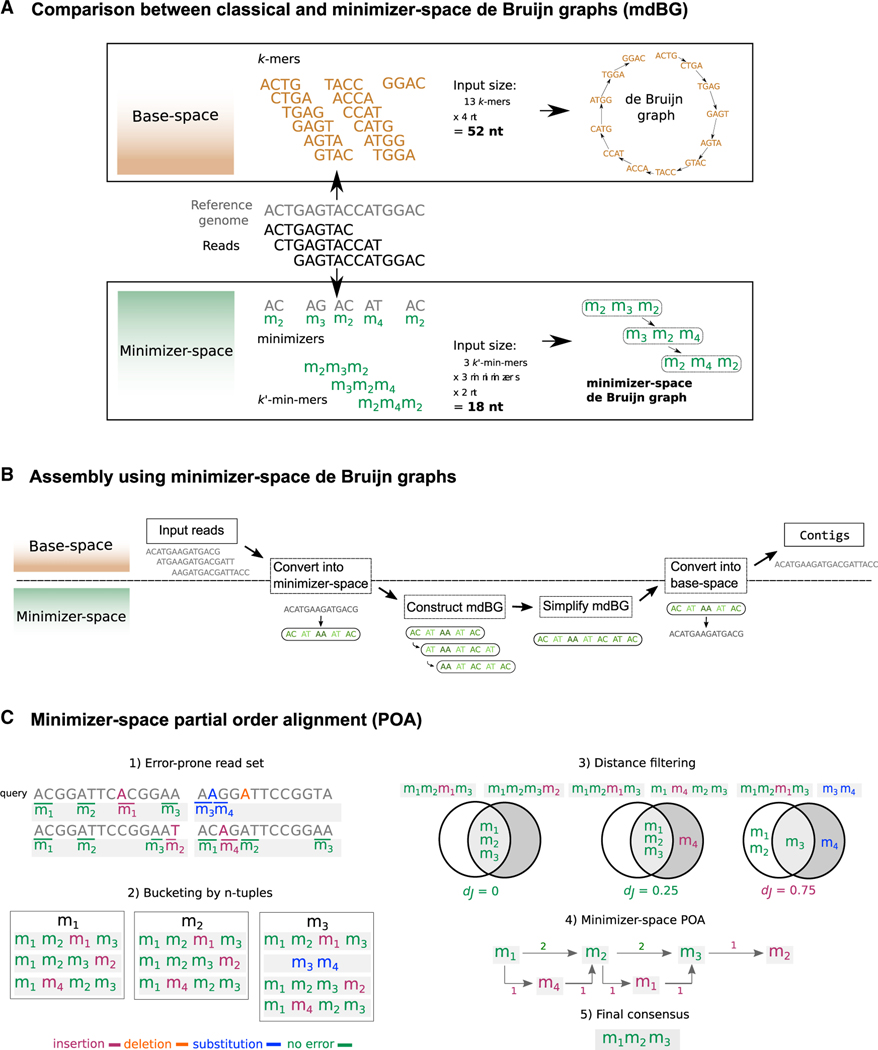
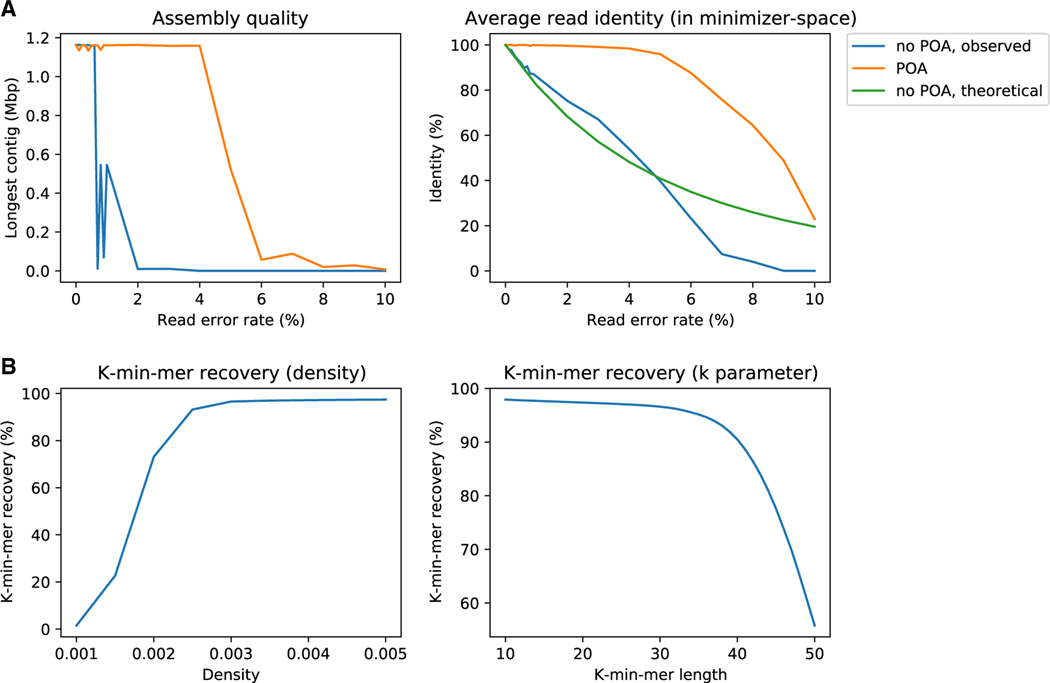
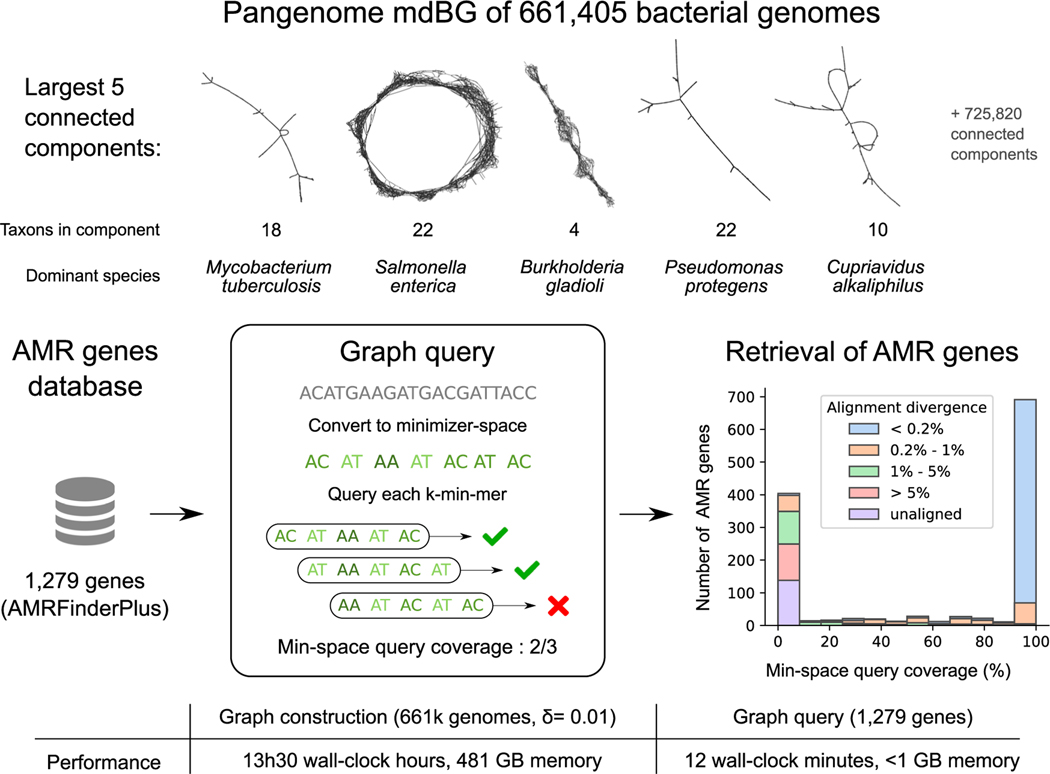
DNA sequencing data continue to progress toward longer reads with increasingly lower sequencing error rates. Here, we define an algorithmic approach, mdBG, that makes use of minimizer-space de Bruijn graphs to enable long-read genome assembly. mdBG achieves orders-of-magnitude improvement in both speed and memory usage over existing methods without compromising accuracy. A human genome is assembled in under 10 min using 8 cores and 10 GB RAM, and 60 Gbp of metagenome reads are assembled in 4 min using 1 GB RAM. In addition, we constructed a minimizer-space de Bruijn graph-based representation of 661,405 bacterial genomes, comprising 16 million nodes and 45 million edges, and successfully search it for anti-microbial resistance (AMR) genes in 12 min. We expect our advances to be essential to sequence analysis, given the rise of long-read sequencing in genomics, metagenomics, and pangenomics. Code for constructing mdBGs is freely available for download at https://github.com/ekimb/rust-mdbg/.

Keywords: bacterial genomes; data structures; de Bruijn graphs; genome assembly; genome graphs; long-read sequencing; metagenomics; minimizers; pangenomics; partial order alignment.


Conflict of interest statement

Declaration of interests The authors declare no competing interests.

Figures

Figure 1.
Figure 1.. Overview of our methods
(A) An efficient assembly method for state-of-the-art genome sequencing (e.g., PacBio HiFi data). Illustration of our minimizer-space de Bruijn graph (mdBG, bottom) compared with the original de Bruijn graph (top) commonly used for genome assembly. Center horizontal section shows a toy reference genome, along with a collection of sequencing reads. Top box shows k-mers (k = 4) collected from the reads, which are the nodes of the classical de Bruijn graph. The input size of 52 nucleotides (nt) is depicted in boldface. Bottom box shows the position of minimizers in the reads for = 2, and any -mer starting with nucleotide “A” is chosen as a minimizer. k′-min-mers (using notation k′ = 3 here to differentiate from classical k-mers) are tuples of k′ minimizers as ordered in reads, which constitute the nodes of the minimizer-space de Bruijn graph. Creating k′-min-mers from the minimizer-space representation of reads allows for a reduction in input size, since the only bases stored in a k′-min-mer are the bases of the chosen minimizers. The reduced input size to 18 nucleotides (nt) is depicted in boldface. The minimizer-space representation accelerates the construction and traversal of the de Bruijn graph while reducing memory consumption. (B) Overview of the assembly pipeline using mdBG. The region of the figure above (respectively, below) the dotted line corresponds to analyses taking place in base space (respectively, minimizer space). The input reads are scanned sequentially, and all [-mers that belong to a pre-selected set of universe minimizers (see STAR Methods) are identified. Each read is then represented as an ordered list of the selected minimizers, and k-min-mers are collected from the minimizer-space representation of reads using a sliding window of length k. A minimizer-space de Bruijn graph (mdBG) is then constructed from the set of all k-min-mers and simplified in order to reduce ambiguity and remove errors. The mdBG is then converted back into base space by concatenating the base-space sequences spanned by the minimizers in the mdBG, and a set of contigs is reported. (C) Overview of the minimizer-space partial order alignment (POA) procedure with a toy dataset of 4 reads. (1) Error-prone reads and their ordered lists of minimizers ( = 2) are shown, with sequencing errors and the minimizers that are created as a result of errors denoted in colors (insertion as red, deletion as orange, substitution in blue, no errors in green). (2) Before minimizer-space error-correction, the ordered lists of minimizers are bucketed using their n-tuples (n = 1). (3) For a query ordered list (the first read in the read set in the figure), all ordered lists that share an n-tuple with the query are obtained, and the final list of query neighbors are obtained by applying a heuristically determined distance filter dj (Jaccard distance threshold of φ = 0.5). (4) A POA graph in minimizer space is constructed by initializing the graph with the query and aligning each ordered list that passed the filter to the graph iteratively (weights of poorlya supported edges are shown in red). (5) By taking a consensus path of the graph, the error in the query is corrected.
Figure 2.
Figure 2.. Evaluation of minimizer-space POA correction
(A) Effect of our minimizer-space POA correction on mdBG assembly and reads. Reads from D. melanogaster chromosome 4 were simulated with base error rates ranging from 0%, 1%, …, up to 10%. Assemblies were run with and without minimizer-space POA correction. Left panel depicts the length of the longest contig for each assembly (uncorrected in blue, minimizer-space POA-corrected in orange). Right panel depicts the average read identity to the reference, computed in minimizer space, for raw reads (observed in blue, and predicted by Equation 1 in green), and reads corrected by POA in minimizer space (in orange). (B) Robustness of rust-mdbg assemblies by varying the k and δ parameters, on whole-genome D. melanogaster simulated perfect reads. The proportion of recovered k-min-mer values is reported in both plots. Left panel shows recovery rates for k = 30, = 12, and varying δ from 0.001 to 0.005, with good recovery (≥ 90%) occurring with δ≥0.0025). Right panel shows recovery rates for = 12, δ = 0.003, and varying k from 10 to 50, again with good recovery with k ≥ 40.
Figure 3.
Figure 3.. Pangenome mdBG of 661,405 bacterial genomes and retrieval of anti-microbial resistance genes
Top panel: a complete δ = 0.001 pangenome mdBG is constructed for the whole 661,405 bacterial collection and the first five connected components are displayed here (using Gephi software). Each node is a k-min-mer, and edges are exact overlaps of k − 1 minimizers between k-min-mers. Middle panel: a collection of anti-microbial resistance gene targets was converted into minimizer space, then each k-min-mer is queried in a 661,405 bacterial pangenome graph (δ = 0.01) yielding a bimodal distribution of gene retrieval: genes with high identity (99%+) to those in the pangenome are found, while those with lower identity are not found. The histogram is annotated by the minimal sequence divergence of each gene as aligned by minimap2 to the pangenome over 90% of its length. Bottom panel: runtime and memory usage for the δ = 0.01 graph construction and query. Note that the graph need only be constructed once in a preprocessing step.
Figure 4.
Figure 4.. Propagation of sequencing errors in base space to minimizer space
We consider a sequence along with its minimizers (left of the box). Each panel inside the box depicts the effect of a different mutation on this sequence. Top left panel: G → C (in purple) leads to no change in the minimizer-space representation as the mutation did not change or create any minimizer. Bottom left: A → G led to the disappearance of m2. Top right: C → A made the m3 minimizer appear. Bottom right: T → A affected two minimizers: m4 was substituted for m1, and m3 was inserted.

Comment in

References

    1. Batu T, Ergun F, and Şahinalp C. (2006). Oblivious string embeddings and edit distance approximations. In Proceedings of the Seventeenth Annual ACM-SIAM Symposium on Discrete Algorithms’, SODA ‘06, Society for Industrial and Applied Mathematics), pp. 792–801.
    1. Batzoglou S, Jaffe DB, Stanley K, Butler J, Gnerre S, Mauceli E, Berger B, Mesirov JP, and Lander ES (2002). ARACHNE: a whole-genome shotgun assembler. Genome Res. 12, 177–189. - PMC - PubMed
    1. Berger B, Peng J, and Singh M. (2013). Computational solutions for omics data. Nat. Rev. Genet 14, 333–346. - PMC - PubMed
    1. Berger E, Yorukoglu D, Zhang L, Nyquist SK, Shalek AK, Kellis M, Numanagić I, and Berger B. (2020). Improved haplotype inference by exploiting long-range linking and allelic imbalance in RNA-seq datasets. Nat. Commun 11, 4662. - PMC - PubMed
    1. Bingmann T, Bradley P, Gauger F, and Iqbal Z. (2019). COBS: a compact bit-sliced signature index. In 26th International Conference on String Processing and Information Retrieval (SPIRE), pp. 285–303. arXiv:1905. 09624v2.

Publication types