. 2021 Sep 14;16(9):2242-2256.
doi: 10.1016/j.stemcr.2021.08.008.

Human stem cell-based retina on chip as new translational model for validation of AAV retinal gene therapy vectors

Affiliations

Human stem cell-based retina on chip as new translational model for validation of AAV retinal gene therapy vectors

Kevin Achberger et al. Stem Cell Reports. .

Abstract

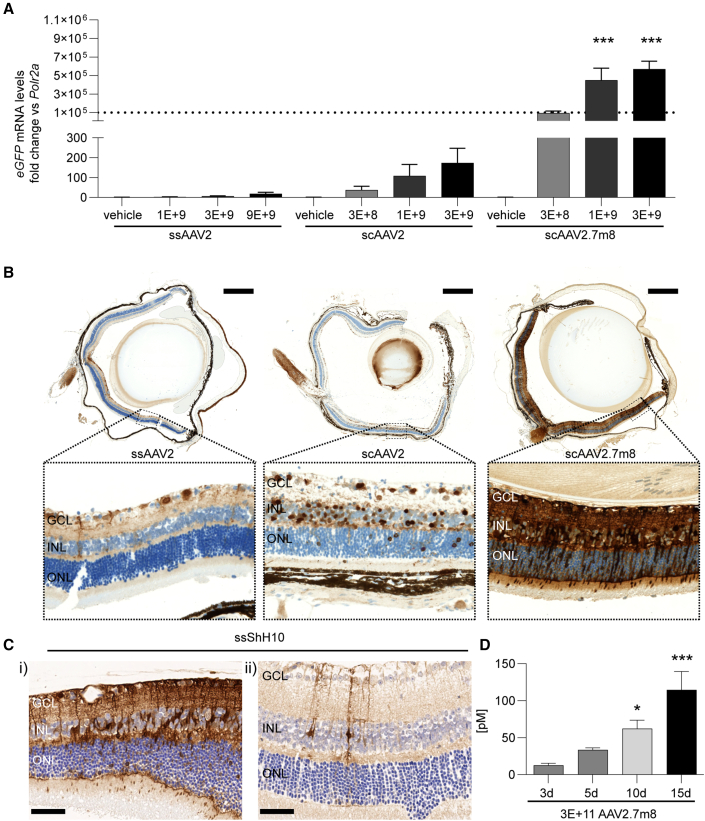
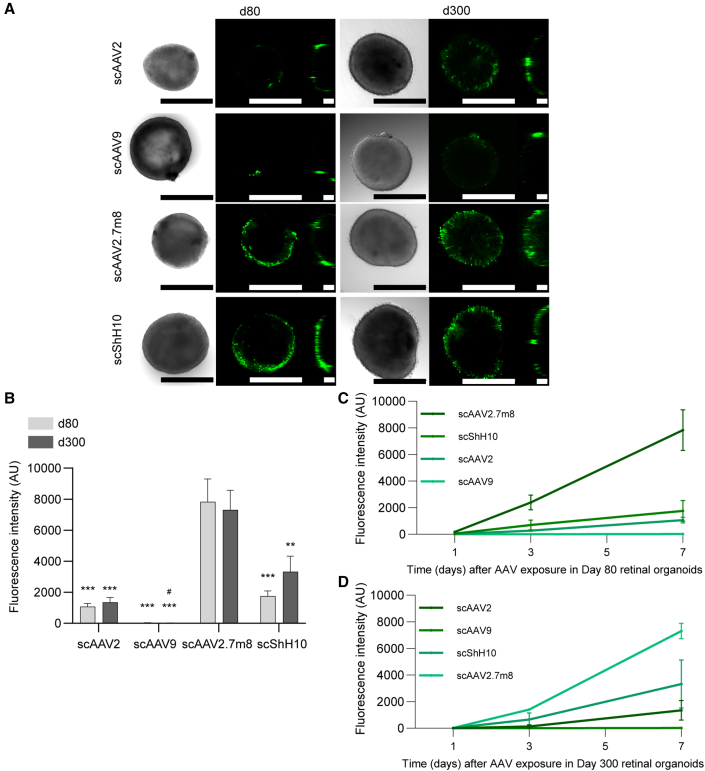
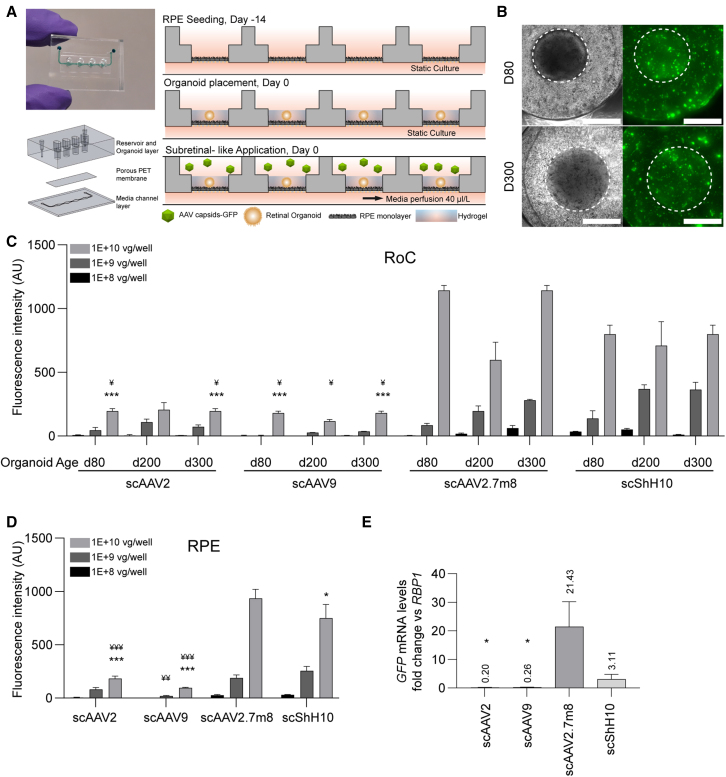
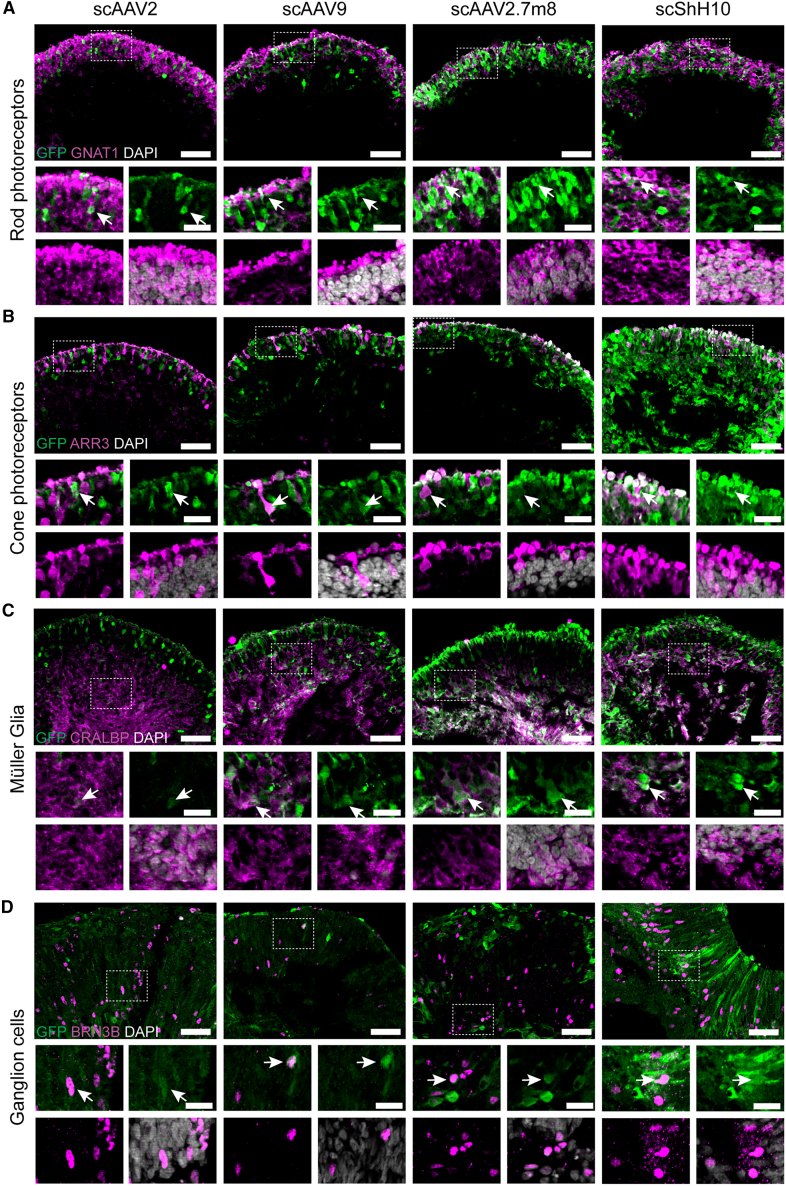
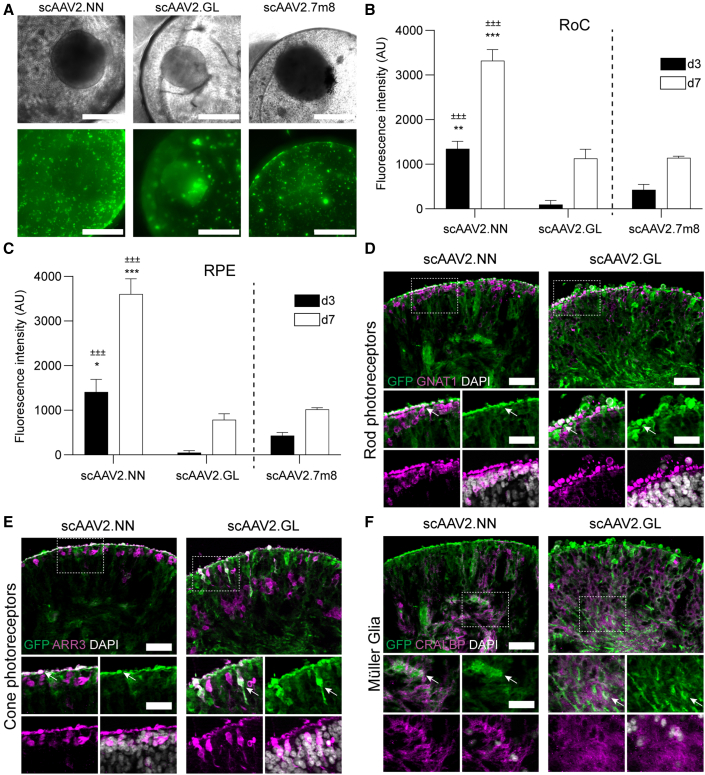
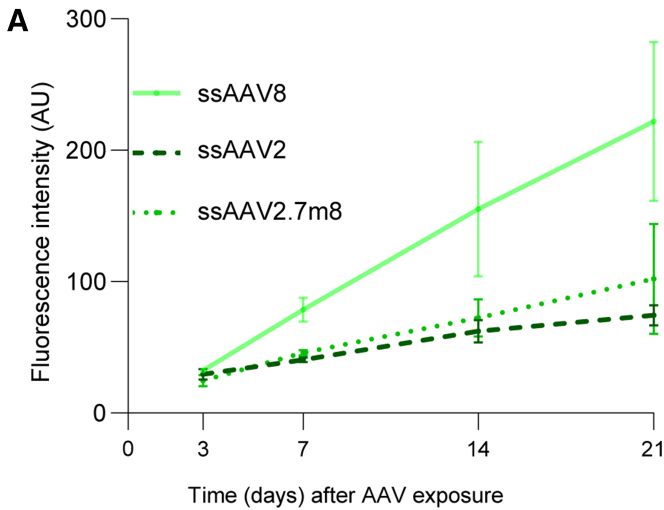
Gene therapies using adeno-associated viruses (AAVs) are among the most promising strategies to treat or even cure hereditary and acquired retinal diseases. However, the development of new efficient AAV vectors is slow and costly, largely because of the lack of suitable non-clinical models. By faithfully recreating structure and function of human tissues, human induced pluripotent stem cell (iPSC)-derived retinal organoids could become an essential part of the test cascade addressing translational aspects. Organ-on-chip (OoC) technology further provides the capability to recapitulate microphysiological tissue environments as well as a precise control over structural and temporal parameters. By employing our recently developed retina on chip that merges organoid and OoC technology, we analyzed the efficacy, kinetics, and cell tropism of seven first- and second-generation AAV vectors. The presented data demonstrate the potential of iPSC-based OoC models as the next generation of screening platforms for future gene therapeutic studies.

Keywords: AAV vectors; gene therapy; human iPSC; organ-on-chip; retina on chip; retinal organoids.


Figures

Figure 1
Figure 1
AAV-induced expression in the mouse eye after intravitreal application (A) eGFP RNA levels 3 weeks after injection. Statistical analysis in the graph represents the comparison with scAAV2 at similar doses. (B) Representative vertical sections of mouse eyes 3 weeks after injection of 3 × 109 vector genomes. Section were stained with anti-eGFP antibody (DAB, brown) and hematoxylin for cell nuclei (blue). Scale bars: (top) 500 μm, (bottom) 50 μm. (C) Histological staining for eGFP in the mouse retina after (i) 5 × 109 vector genomes and (ii) 1 × 109 vector genomes of ssShH10. Scale bars: 50 μm. (D) Expression of secreted anti-FITC antibody over time course of 15 days. Statistical analysis represents comparison with day 3. (A, C) n = 5–6 eyes from five to six animals per condition, mean + SEM.
Figure 2
Figure 2
eGFP expression in AAV-treated ROs differentiated for 80 and 300 days (A) Confocal imaging of AAV-treated organoids expressing eGFP (green). Left, brightfield; middle, x-y projection; right, y-z projection. Scale bars: 500 μm. (B–D) (B) Quantification of mean eGFP fluorescence in day 80 and day 300 ROs exposed for 1, 2, or 3 days to the respective AAV (1 × 1010 virus genomes/well) and quantified after 7 days. Statistics represent the comparison between AAV for the same RO age with scAAV2.7m8 () and with scShh10 (#). Kinetics of eGFP for (C) day 80 ROs and (D) day 300 ROs. (B–D) n = 17–18 separate ROs per condition, mean + SEM. See also Figures S2 and S3.
Figure 3
Figure 3
Testing of AAV serotypes in the RoC (A) Adapted RoC design and chip seeding protocol for subretinal AAV treatment. (B) Representative brightfield and GFP fluorescence live imaging. RoC area used for quantification is circled white. Fluorescent images are maximum intensity projections. Scale bars: 500μm. (C) Quantification of the mean eGFP fluorescence after 7 days of culture. Statistical analysis represents the comparison with scAAV2.7m8 () and scShH10 (¥) for 1 × 1010 virus genomes and the same organoid age. (D) Quantification of the mean eGFP fluorescence in the non-organoid areas of the RoC wells after 7 days of culture. Statistics represent the comparison with scAAV9 (#), scAAV2.7m8 (), and scShH10 (¥). (E) eGFP gene expression for each AAV in the RoC with day 300 ROs and a virus load of 1 × 1010 virus genomes per well. Statistics represent the comparison with scAAV2.7m8. (C) n = 3 wells from one RoC, (D) n = 9 wells from three RoCs per condition, and (E) n = 3–4 RO from one RoC per condition, mean + SEM. See also Figures S4 and S5.
Figure 4
Figure 4
Evaluation of cell tropism in the RoC (A–D) Day 200 ROs in (A)–(C) were transduced with 1 × 1010 virus genomes, (D) day 80 ROs were transduced with 1 × 109 virus genomes. (A–D) Vertical cryosections of ROs showing AAV-mediated eGFP expression (green) and cellular co-stainings (magenta): (A) rod transducing (GNAT1, rods), (B) ARRESTIN 3 (ARR3, cones), (C) CRALBP (MüG), and (D) BRN3B (ganglion cells). DAPI: white. Co-stained cells are highlighted with white arrow. Scale bars: 50 μm (large images), 20 μm (small images). See also Figures S6 and S7.
Figure 5
Figure 5
Evaluation of next-generation AAVs in the RoC (A) Representative brightfield and eGFP fluorescence (maximum intensity projection) images of RoCs (1 × 1010 vector genomes per well). (B) Quantification of the mean eGFP fluorescence. AAV2.7m8 data (Figures 3 and 4) are depicted as comparison. Statistics represent the comparison with scAAV2.GL (±) and scAAV2.7m8 (). (C) Quantification of the mean eGFP fluorescence in the non-organoid area of the RoC well. Statistics represent the comparison with scAAV2.GL (±) and scAAV2.7m8 (). (D–F) Vertical cryosections of day 300 ROs transduced with 1 × 1010 virus genomes showing eGFP expression (green) and cellular co-stainings (magenta): (D) rod transducing (GNAT1, rods), (E) ARRESTIN 3 (ARR3, cones), and (F) CRALBP (MüG). DAPI: white. Co-stained cells are highlighted with white arrow. Scale bars: 50 μm (large images), 30 μm (small images). (B and C) n = 3 wells from one RoC for all conditions, mean + SEM. See also Figures S6 and S7.
Figure 6
Figure 6
Long-term analysis of AAV-induced expression in the RoC using ssAAV8, ssAAV2, and ssAAV2.7m8 Quantification of the mean eGFP fluorescence in the RoC with day 300 ROs exposed to 1 × 1010 virus genomes per well. n = 3 wells from one RoC for all conditions, mean ± SEM.

References

    1. Achberger K., Probst C., Haderspeck J., Bolz S., Rogal J., Chuchuy J., Nikolova M., Cora V., Antkowiak L., Haq W., et al. Merging organoid and organ-on-a-chip technology to generate complex multi-layer tissue models in a human retina-on-a-chip platform. Elife. 2019;8:e46188. - PMC - PubMed
    1. Allocca M., Mussolino C., Garcia-Hoyos M., Sanges D., Iodice C., Petrillo M., Vandenberghe L.H., Wilson J.M., Marigo V., Surace E.M., et al. Novel adeno-associated virus serotypes efficiently transduce murine photoreceptors. J. Virol. 2007;81:11372–11380. - PMC - PubMed
    1. Auricchio A., Behling K.C., Maguire A.M., O’Connor E.E., Bennett J., Wilson J.M., Tolentino M.J. Inhibition of retinal neovascularization by intraocular viral-mediated delivery of anti-angiogenic agents. Mol. Ther. 2002;6:490–494. - PubMed
    1. Buck T.M., Wijnholds J. Recombinant adeno-associated viral vectors (rAAV)-Vector elements in ocular gene therapy clinical trials and transgene expression and bioactivity assays. Int. J. Mol. Sci. 2020;21:4197. - PMC - PubMed
    1. Büning H., Srivastava A. Capsid modifications for targeting and improving the efficacy of AAV vectors. Mol. Ther. Methods Clin. Dev. 2019;12:248–265. - PMC - PubMed

LinkOut - more resources