. 2021 Aug;104(2-1):024414.
doi: 10.1103/PhysRevE.104.024414.

Extrusion of chromatin loops by a composite loop extrusion factor

Affiliations

Extrusion of chromatin loops by a composite loop extrusion factor

Hao Yan et al. Phys Rev E. 2021 Aug.

Abstract

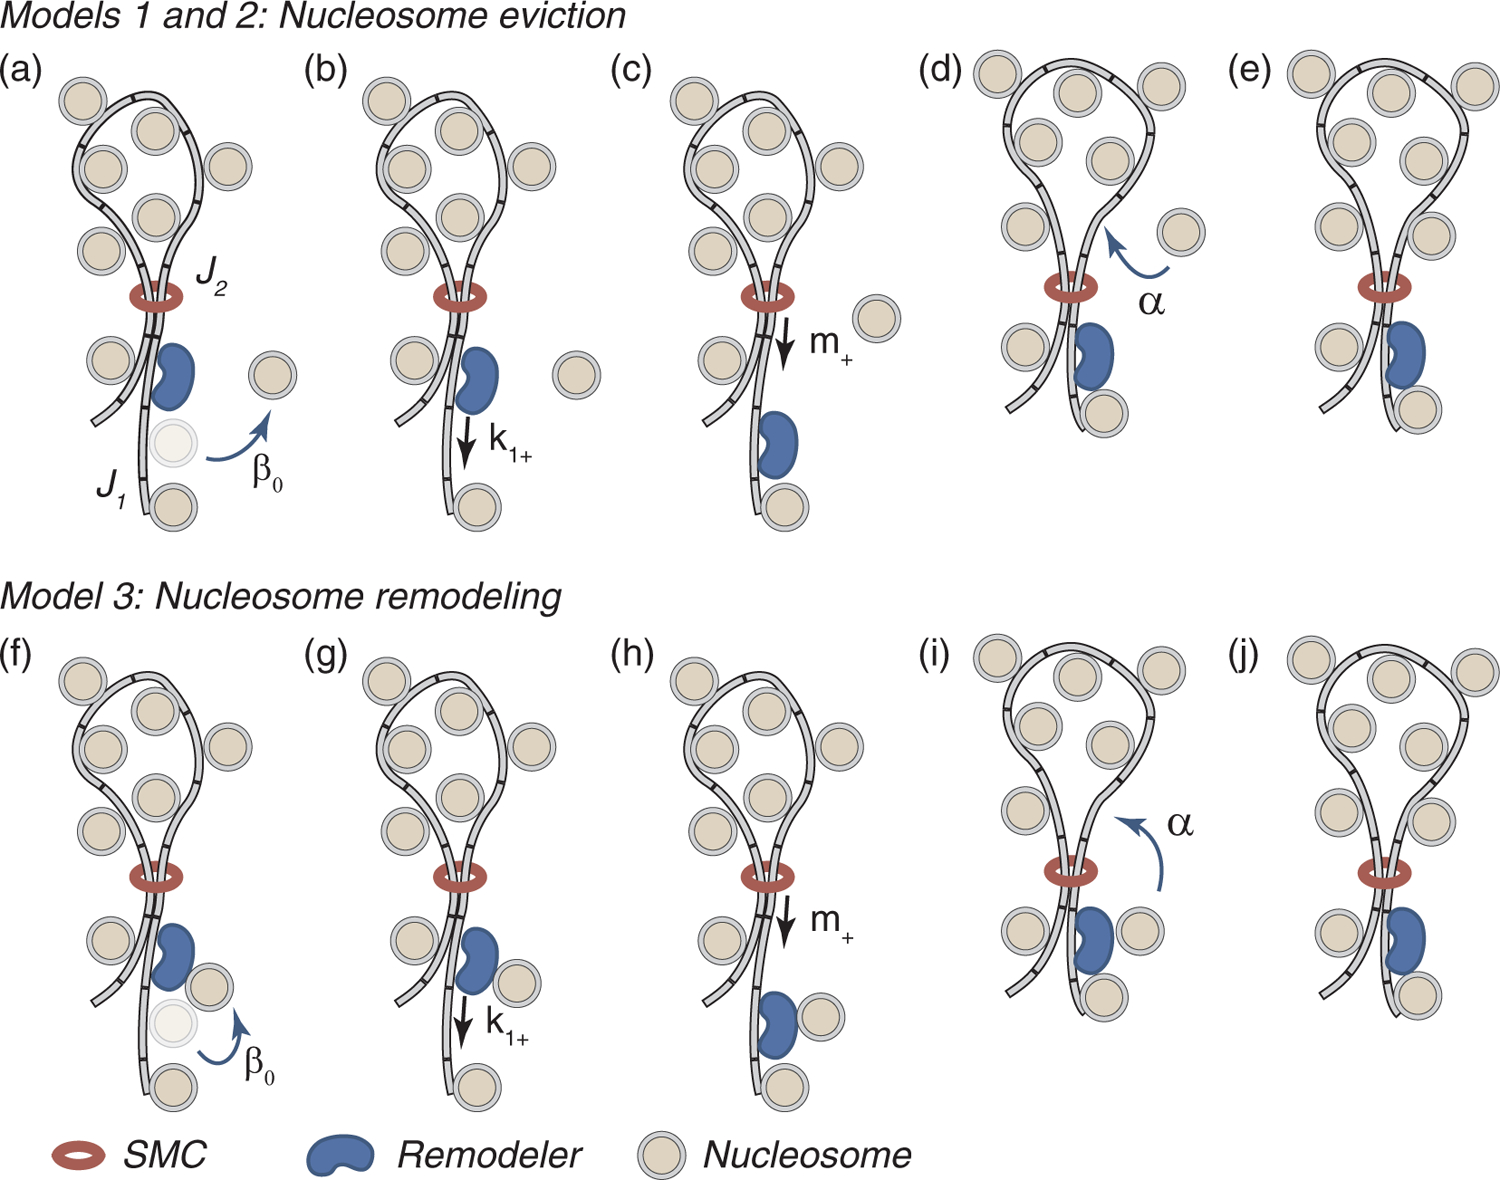
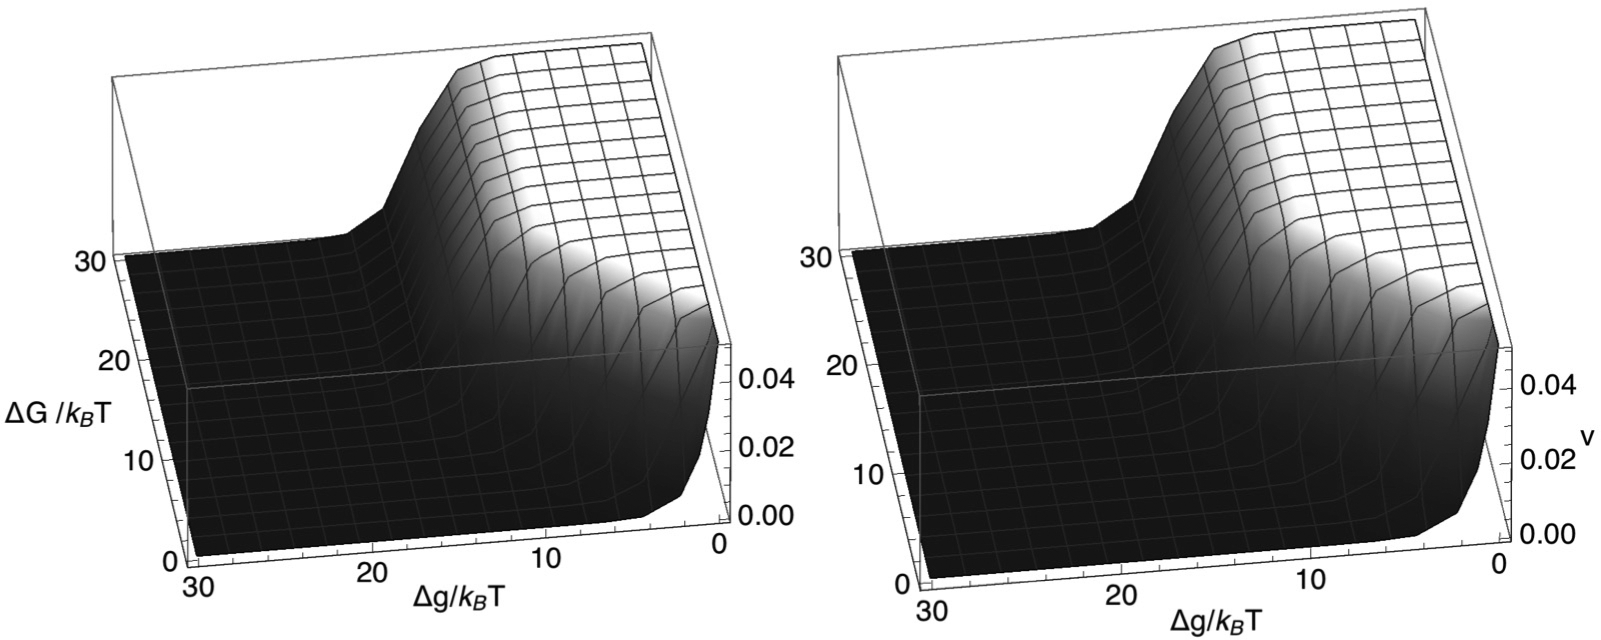
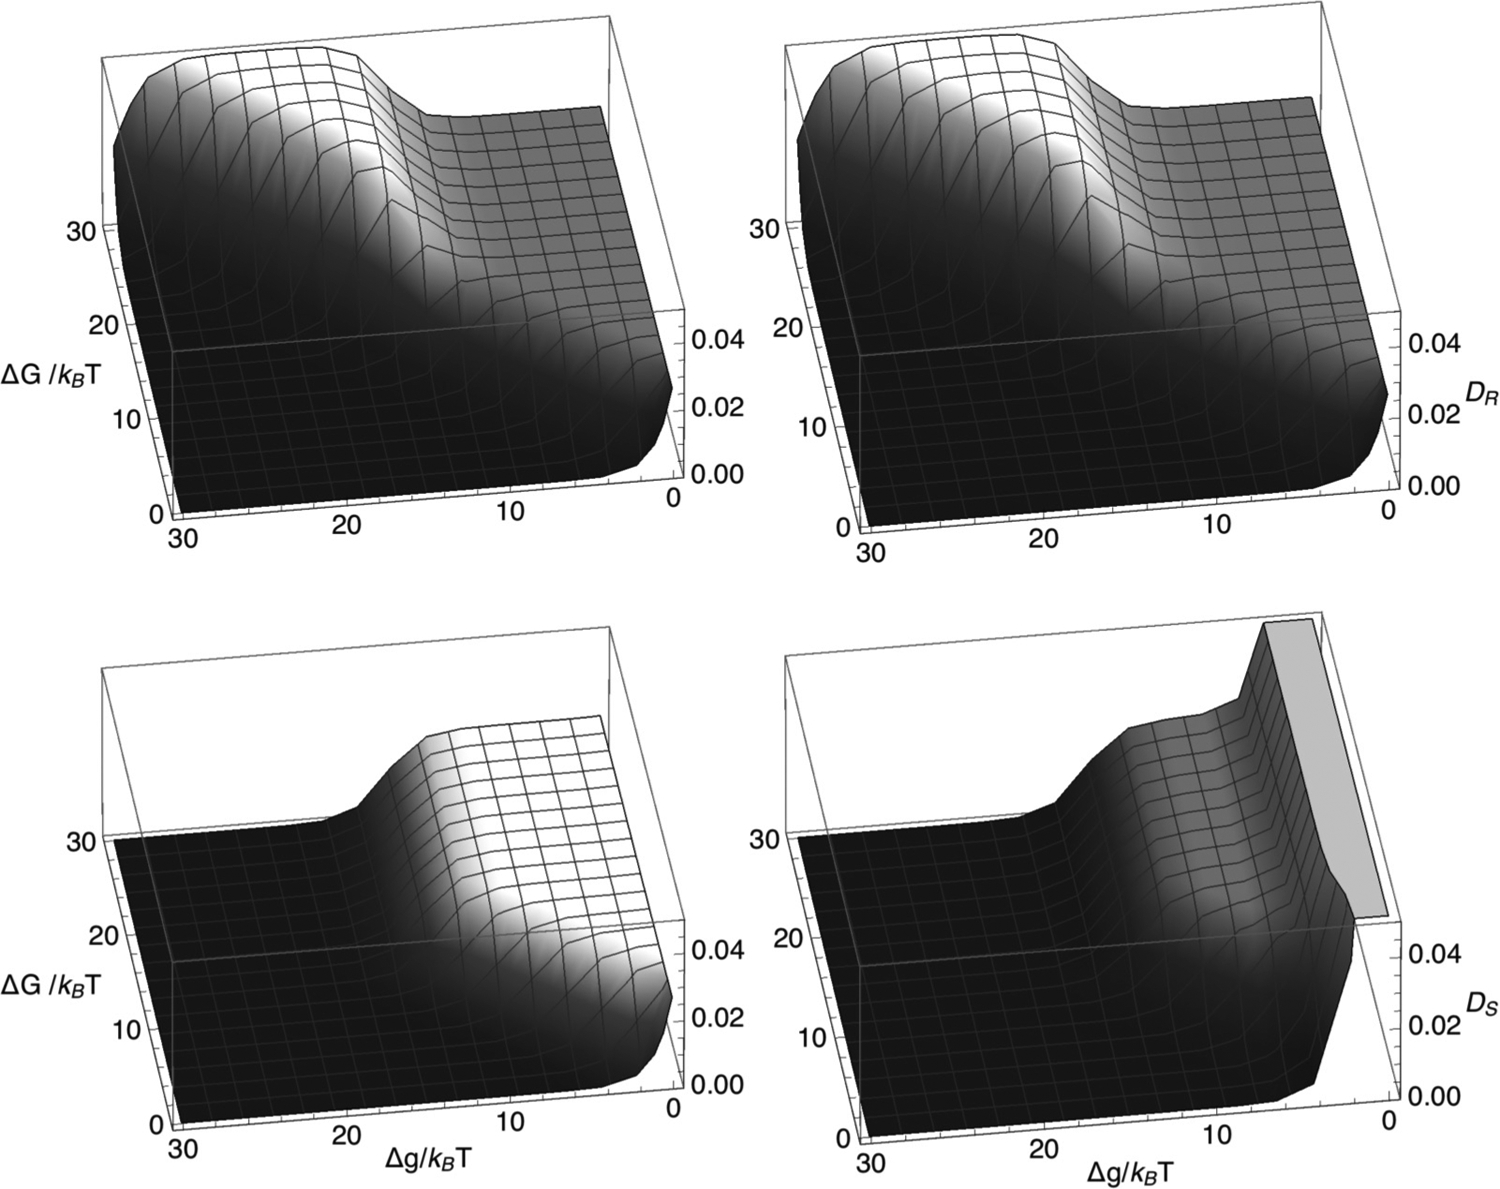
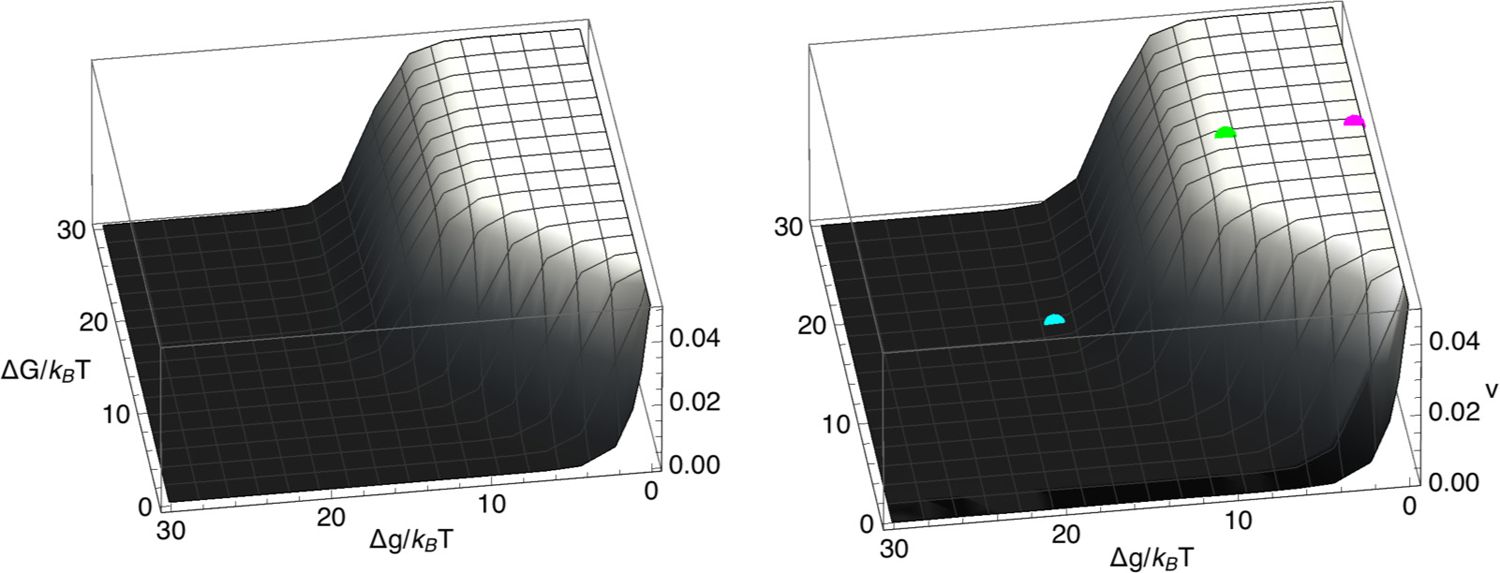
Chromatin loop extrusion by structural maintenance of chromosome (SMC) complexes is thought to underlie intermediate-scale chromatin organization inside cells. Motivated by a number of experiments suggesting that nucleosomes may block loop extrusion by SMCs, such as cohesin and condensin complexes, we introduce and characterize theoretically a composite loop extrusion factor (composite LEF) model. In addition to an SMC complex that creates a chromatin loop by encircling two threads of DNA, this model includes a remodeling complex that relocates or removes nucleosomes as it progresses along the chromatin, and nucleosomes that block SMC translocation along the DNA. Loop extrusion is enabled by SMC motion along nucleosome-free DNA, created in the wake of the remodeling complex, while nucleosome rebinding behind the SMC acts as a ratchet, holding the SMC close to the remodeling complex. We show that, for a wide range of parameter values, this collection of factors constitutes a composite LEF that extrudes loops with a velocity, comparable to the velocity of remodeling complex translocation on chromatin in the absence of SMC, and much faster than loop extrusion by an isolated SMC that is blocked by nucleosomes.


Figures

FIG. 1.
FIG. 1.
Loop extrusion via a composite LEF, comprising an SMC complex, which forms a ring around two nucleosome-free sections of DNA, nucleosomes that block SMC translocation, and a remodeling complex which removes nucleosomes in front of the SMC. In our model, a single loop extrusion step starts when the remodeling complex forces a nucleosome from the DNA ahead of the remodeler, thus moving the junction (J1) between nucleosomal DNA and naked DNA one step forward. β0 is the rate of nucleosome dissociation (a) or remodeling (f) when the remodeler is next to a nucleosome. Next, the remodeler moves into the resultant nucleosome-free region, (b) and (g). k1+ is the rate at which the remodeler steps forward, when the remodeler-nucleosome separation is one step. Then, the SMC complex moves into the new nucleosome-free region left behind the remodeler (c) and (h). m+ is the rate at which the SMC steps forward on nucleosome-free DNA. Finally, a nucleosome rebinds behind the SMC complex, moving the second junction (J2) between nucleosomal DNA and naked DNA one step forward, and so preventing the SMC from subsequently backtracking. α is the rate of nucleosome rebinding (d) or reformation (i). After these four substeps, the LEF configuration is the same as before the first step, but the loop is one step larger, (e) and (j). The top row (a)–(e) illustrates a hypothetical scenario (models 1 and 2) in which the displaced nucleosome is in solution before rebinding DNA behind the SMC. The bottom row (f)–(j) illustrates an alternative “remodeled-nucleosome” scenario (model 3) in which the displaced nucleosome remains associated with the remodeling complex before rebinding DNA behind the SMC.
FIG. 2.
FIG. 2.
Three example composite LEF trajectories from model 2 simulations. In each case, the positions versus time of the nucleosome junctions are shown gray, the remodeling complex is shown blue, and the SMC complex is shown red. When tracking together, each such group of four traces constitutes a composite LEF. The model parameters are k+ = 0.05 per time step, k = 5 × 10⁻⁷ per time step, m+= m= 0.3 per time step, ΔG = 18.0kBT, α = 1 per time step, and βαeΔgkBT for all three composite LEFs, but Δg = 18.0kBT for the bottom group of traces, Δg = 9.0kBT for the middle group of traces, and Δg = 0.5kBT for the top group of traces. The cyan, green, and magenta lines each have a slope given by the theoretical composite LEF velocity for the parameters of each simulation.
FIG. 3.
FIG. 3.
Probability, P3, that the remodeling complex and the SMC complex involved in a composite LEF are not adjacent to each other, plotted versus ΔG/(kBT) and Δg/(kBT), according to model 1 [Eq. (14)] for k+ = 0.05 per time step, k = 5.0 × 10⁻⁷ per time step, m+ = 0.3 per time step, and m = 0.0003 per time step (left) or m = 0.3 per time step (right).
FIG. 4.
FIG. 4.
Probability, P3, that the remodeler and SMC are not next to each other (top) and the mean remodeler-SMC separation (bottom), plotted versus nucleosome binding energy, ΔgkBT. The circles correspond to results determined from model-2 Gillepsie simulations, each containing 220 transitions. The solid line corresponds to Eq. (30). The parameter values used were k+ = 0.05 per time step, k = 5 × 10⁻⁷ per time step, m+ = m = 0.3 per time step, ΔG = 18.0kBT, α = 1 per time step, and β=αeΔgkBT. These parameters correspond to those for Fig. 2. The cyan, green, and magenta points at ΔgkBT=0.5, 8.0, and 18, respectively, correspond to the bottom, middle, and top traces of Fig. 2.
FIG. 5.
FIG. 5.
Mean velocity, v, of a composite LEF plotted versus ΔGkBT and ΔgkBT, according to Eq. (15) for k+ = 0.05 per time step, k = 5.0 × 10⁻⁷ per time step, m+ = 0.3 per time step, and m = 0.0003 per time step (left) or m = 0.3 per time step (right).
FIG. 6.
FIG. 6.
Diffusivities, DR (top row) and DS (bottom row) of the remodeling complex and the SMC complex, respectively, plotted versus ΔG/(kBT) and Δg/(kBT), according to model 1 [Eqs. (16) and (17)] for k+ = 0.05 per time step, k = 5.0 × 10⁻⁷ per time step, m+= 0.3 per time step, and m= 0.0003 per time step (left column) or m= 0.3 per time step (right column).
FIG. 7.
FIG. 7.
Mean velocity, v, of a composite LEF, plotted versus ΔG/(kBT) and Δg/(kBT) for model 1 (left) and model 2 (right) for k+ = 0.05 per time step, k = 5.0 × 10⁻⁷ per time step, m+ = 0.3 per time step, m = 0.0003 per time step, and (for model 2) α = 1 per time step. The cyan, green, and magenta points on the model-2 curve correspond to the theoretical mean velocities of the composite LEFs whose positions versus time are shown in Fig. 2.

References

    1. https://bionumbers.hms.harvard.edu.
    1. Dekker J, Rippe K, Dekker M, and Kleckner N, Capturing chromosome conformation, Science 295, 1306 (2002). - PubMed
    1. Dixon JR, Selvaraj S, Yue F, Kim A, Li Y, Shen Y, Hu M, Liu JS, and Ren B, Topological domains in mammalian genomes identified by analysis of chromatin interactions, Nature (London) 485, 376 (2012). - PMC - PubMed
    1. Dixon JR, Gorkin DU, and Ren B, Chromatin domains: The unit of chromosome organization, Mol. Cell 62, 668 (2016). - PMC - PubMed
    1. Sexton T, Yaffe E, Kenigsberg E, Bantignies F, Leblanc B, Hoichman M, Parrinello H, Tanay A, and Cavalli G, Three-dimensional folding and functional organization principles of the Drosophila genome, Cell 148, 458 (2012). - PubMed

LinkOut - more resources