. 2021 Sep 15;9(1):46.
doi: 10.1186/s40462-021-00283-5.

Simulation experiment to test strategies of geomagnetic navigation during long-distance bird migration

Affiliations

Simulation experiment to test strategies of geomagnetic navigation during long-distance bird migration

Beate Zein et al. Mov Ecol. .

Abstract

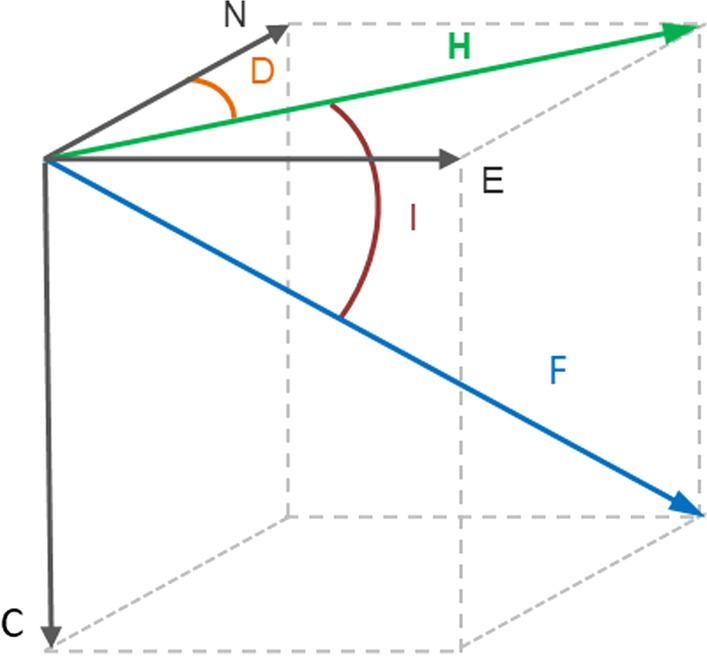
Background: Different theories suggest birds may use compass or map navigational systems associated with Earth's magnetic intensity or inclination, especially during migratory flights. These theories have only been tested by considering properties of the Earth's magnetic field at coarse temporal scales, typically ignoring the temporal dynamics of geomagnetic values that may affect migratory navigational capacity.

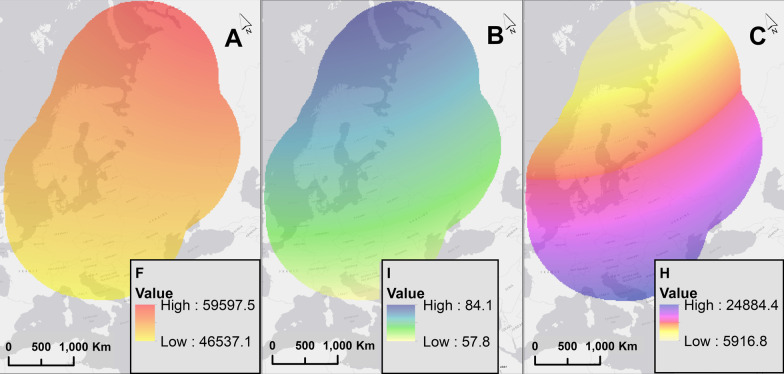
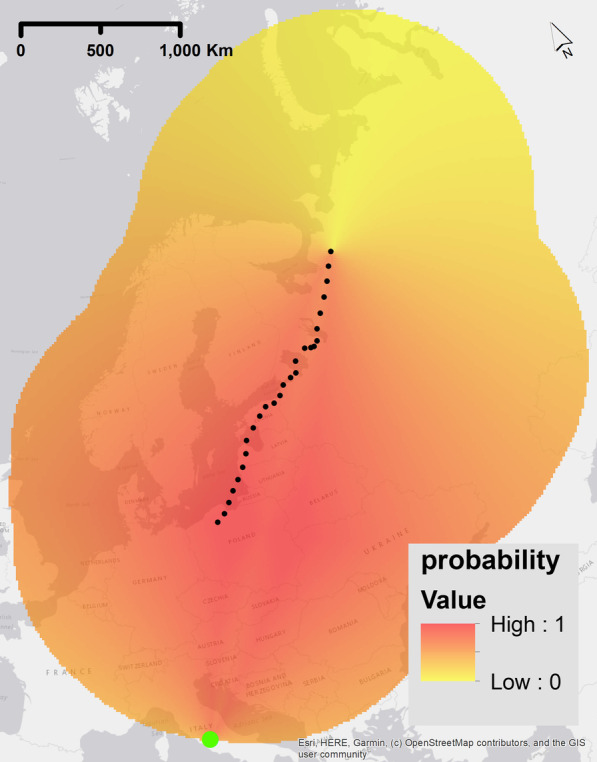
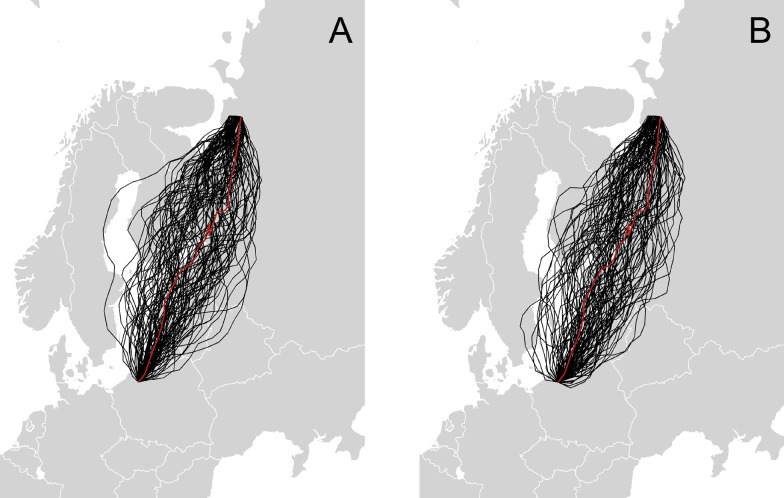
Methods: We designed a simulation experiment to study if and how birds use the geomagnetic field during migration by using both high resolution GPS tracking data and geomagnetic data at relatively fine spatial and temporal resolutions in comparison to previous studies. Our simulations use correlated random walks (CRW) and correlated random bridge (CRB) models to model different navigational strategies based on underlying dynamic geomagnetic data. We translated navigational strategies associated with geomagnetic cues into probability surfaces that are included in the random walk models. Simulated trajectories from these models were compared to the actual GPS trajectories of migratory birds using 3 different similarity measurements to evaluate which of the strategies was most likely to have occurred.

Results and conclusion: We designed a simulation experiment which can be applied to different wildlife species under varying conditions worldwide. In the case of our example species, we found that a compass-type strategy based on taxis, defined as movement towards an extreme value, produced the closest and most similar trajectories when compared to original GPS tracking data in CRW models. Our results indicate less evidence for map navigation (constant heading and bi-gradient taxis navigation). Additionally, our results indicate a multifactorial navigational mechanism necessitating more than one cue for successful navigation to the target. This is apparent from our simulations because the modelled endpoints of the trajectories of the CRW models do not reach close proximity to the target location of the GPS trajectory when simulated with geomagnetic navigational strategies alone. Additionally, the magnitude of the effect of the geomagnetic cues during navigation in our models was low in our CRB models. More research on the scale effects of the geomagnetic field on navigation, along with temporally varying geomagnetic data could be useful for further improving future models.

Keywords: Bird migration; Earth’s magnetic field; Geomagnetic navigation; Greater white-fronted geese; Method development; Navigational strategies; Random walk models.


Conflict of interest statement

The authors declare that they have no competing interests.

Figures

Fig. 1
Fig. 1
Autumn migratory trajectories of individual greater white-fronted geese from 2016 to 2019
Fig. 2
Fig. 2
Overview of the Earth’s magnetic-field vectors. The geomagnetic intensity (F) can be represented by a vector in a 3-dimensional plane (geographic north (N), geographic east (E), down (C)). Its component in the N–E plane is the horizontal component (H). The angle between the field intensity and the horizontal plane is the inclination (I) and the angular difference between the geomagnetic and the geographic north is the declination (D)
Fig. 3
Fig. 3
Example maps of the three geomagnetic quantities used in our simulation: (a) the intensity F (nT), (b) the inclination I (degrees), and (c) the horizontal component H (nT), for September 19, 2016
Fig. 4
Fig. 4
Example of a probability raster for one step of the simulation experiment for the geomagnetic navigational strategy ‘geomagnetic taxis’. The highest probability values are shown red (indicating higher probability of movement steps in that location) and lower probability values are yellow (indicating a lower probability of movement step in that location). These rasters were calculated before each step of the simulated trajectory and are dependent on the current position of the simulated bird and the current condition of the geomagnetic field -the green dot is the location of the minimum value of the raster. The true migratory trajectory of animal 1, interpolated to 1 h frequency, is represented by black dots. We used the geomagnetic field value intensity in this example plot
Fig. 5
Fig. 5
Example of a probability raster for one step of the simulation experiment for the geomagnetic navigational strategy ‘Map-constant heading’. The highest probability values are shown red (indicating higher probability of movement steps in that location) and lower probability values are yellow (indicating a lower probability of movement step in that location). These rasters were calculated before each step of the simulated trajectory and are dependent on the current position of the simulated bird and the current condition of the geomagnetic field -the green dot is the location of the minimum value of the raster. The true migratory trajectory of animal 1, interpolated to 1 h frequency, is represented by black dots. The blue line represents a straight line between the current position of the simulated trajectory at the start of the migration and the final point of the GPS trajectory. We used the geomagnetic field value intensity in this example plot
Fig. 6
Fig. 6
Example of a probability raster for one step of the simulation experiment for the geomagnetic navigational strategy ‘Map-bi-gradient taxis navigation’. The highest probability values are shown red (indicating higher probability of movement steps in that location) and lower probability values are yellow (indicating a lower probability of movement step in that location). These rasters were calculated before each step of the simulated trajectory and are dependent on the current position of the simulated bird and the current condition of the geomagnetic field -the green dot is the location of the minimum value of the raster. The true migratory trajectory of animal 1, interpolated to 1 h frequency, is represented by black dots. We used the geomagnetic field value intensity in this example plot
Fig. 7
Fig. 7
Example of a probability raster for one step of the simulation experiment for the geomagnetic navigational strategy ‘combination bi-gradient taxis - constant heading’. The highest probability values are shown red (indicating higher probability of movement steps in that location) and lower probability values are yellow (indicating a lower probability of movement step in that location). These rasters were calculated before each step of the simulated trajectory and are dependent on the current position of the simulated bird and the current condition of the geomagnetic field -the green dot is the location of the minimum value of the raster. The true migratory trajectory of animal 1, interpolated to 1 h frequency, is represented by black dots. We used the geomagnetic field value intensity in this example plot
Fig. 8
Fig. 8
An example CRW simulation for animal 1. a The simulation without geomagnetic bias and b the simulation with geomagnetic taxis for intensity F
Fig. 9
Fig. 9
Example CRB simulation of animal 1. a The results of the strategy with no magnetic bias and b with geomagnetic taxis and associated geomagnetic value F

References

    1. Klaassen M. Metabolic constraints on long-distance migration in birds. J Exp Biol. 1996;199(1):57–64. doi: 10.1242/jeb.199.1.57. - DOI - PubMed
    1. Wikelski M, Tarlow EM, Raim A, Diehl RH, Larkin RP, Visser GH. Costs of migration in free-flying songbirds. Nature. 2003;423(6941):704. doi: 10.1038/423704a. - DOI - PubMed
    1. Tryjanowski P, Sparks TH, Kuźniak S. Earlier arrival date of some farm land migrants in western Poland. IBIS (Lond 1859) 2002;144:62–68. doi: 10.1046/j.0019-1019.2001.00022.x. - DOI
    1. Mouritsen H. Magnetoreception in birds and its use for long-distance migration. In: Sturkie’s avian physiology. 2015. p. 113–33. http://www.qut.eblib.com.au/patron/FullRecord.aspx?p=763630
    1. Wiltschko W, Wiltschko R. Magnetic orientation in birds. J Exp Biol. 1996;199(1):29–38. doi: 10.1242/jeb.199.1.29. - DOI - PubMed

LinkOut - more resources