. 2021 Nov 3;41(44):9235-9256.
doi: 10.1523/JNEUROSCI.1244-20.2021. Epub 2021 Sep 15.

Loss of Christianson Syndrome Na+/H+ Exchanger 6 (NHE6) Causes Abnormal Endosome Maturation and Trafficking Underlying Lysosome Dysfunction in Neurons

Affiliations

Loss of Christianson Syndrome Na+/H+ Exchanger 6 (NHE6) Causes Abnormal Endosome Maturation and Trafficking Underlying Lysosome Dysfunction in Neurons

Matthew F Pescosolido et al. J Neurosci. .

Abstract

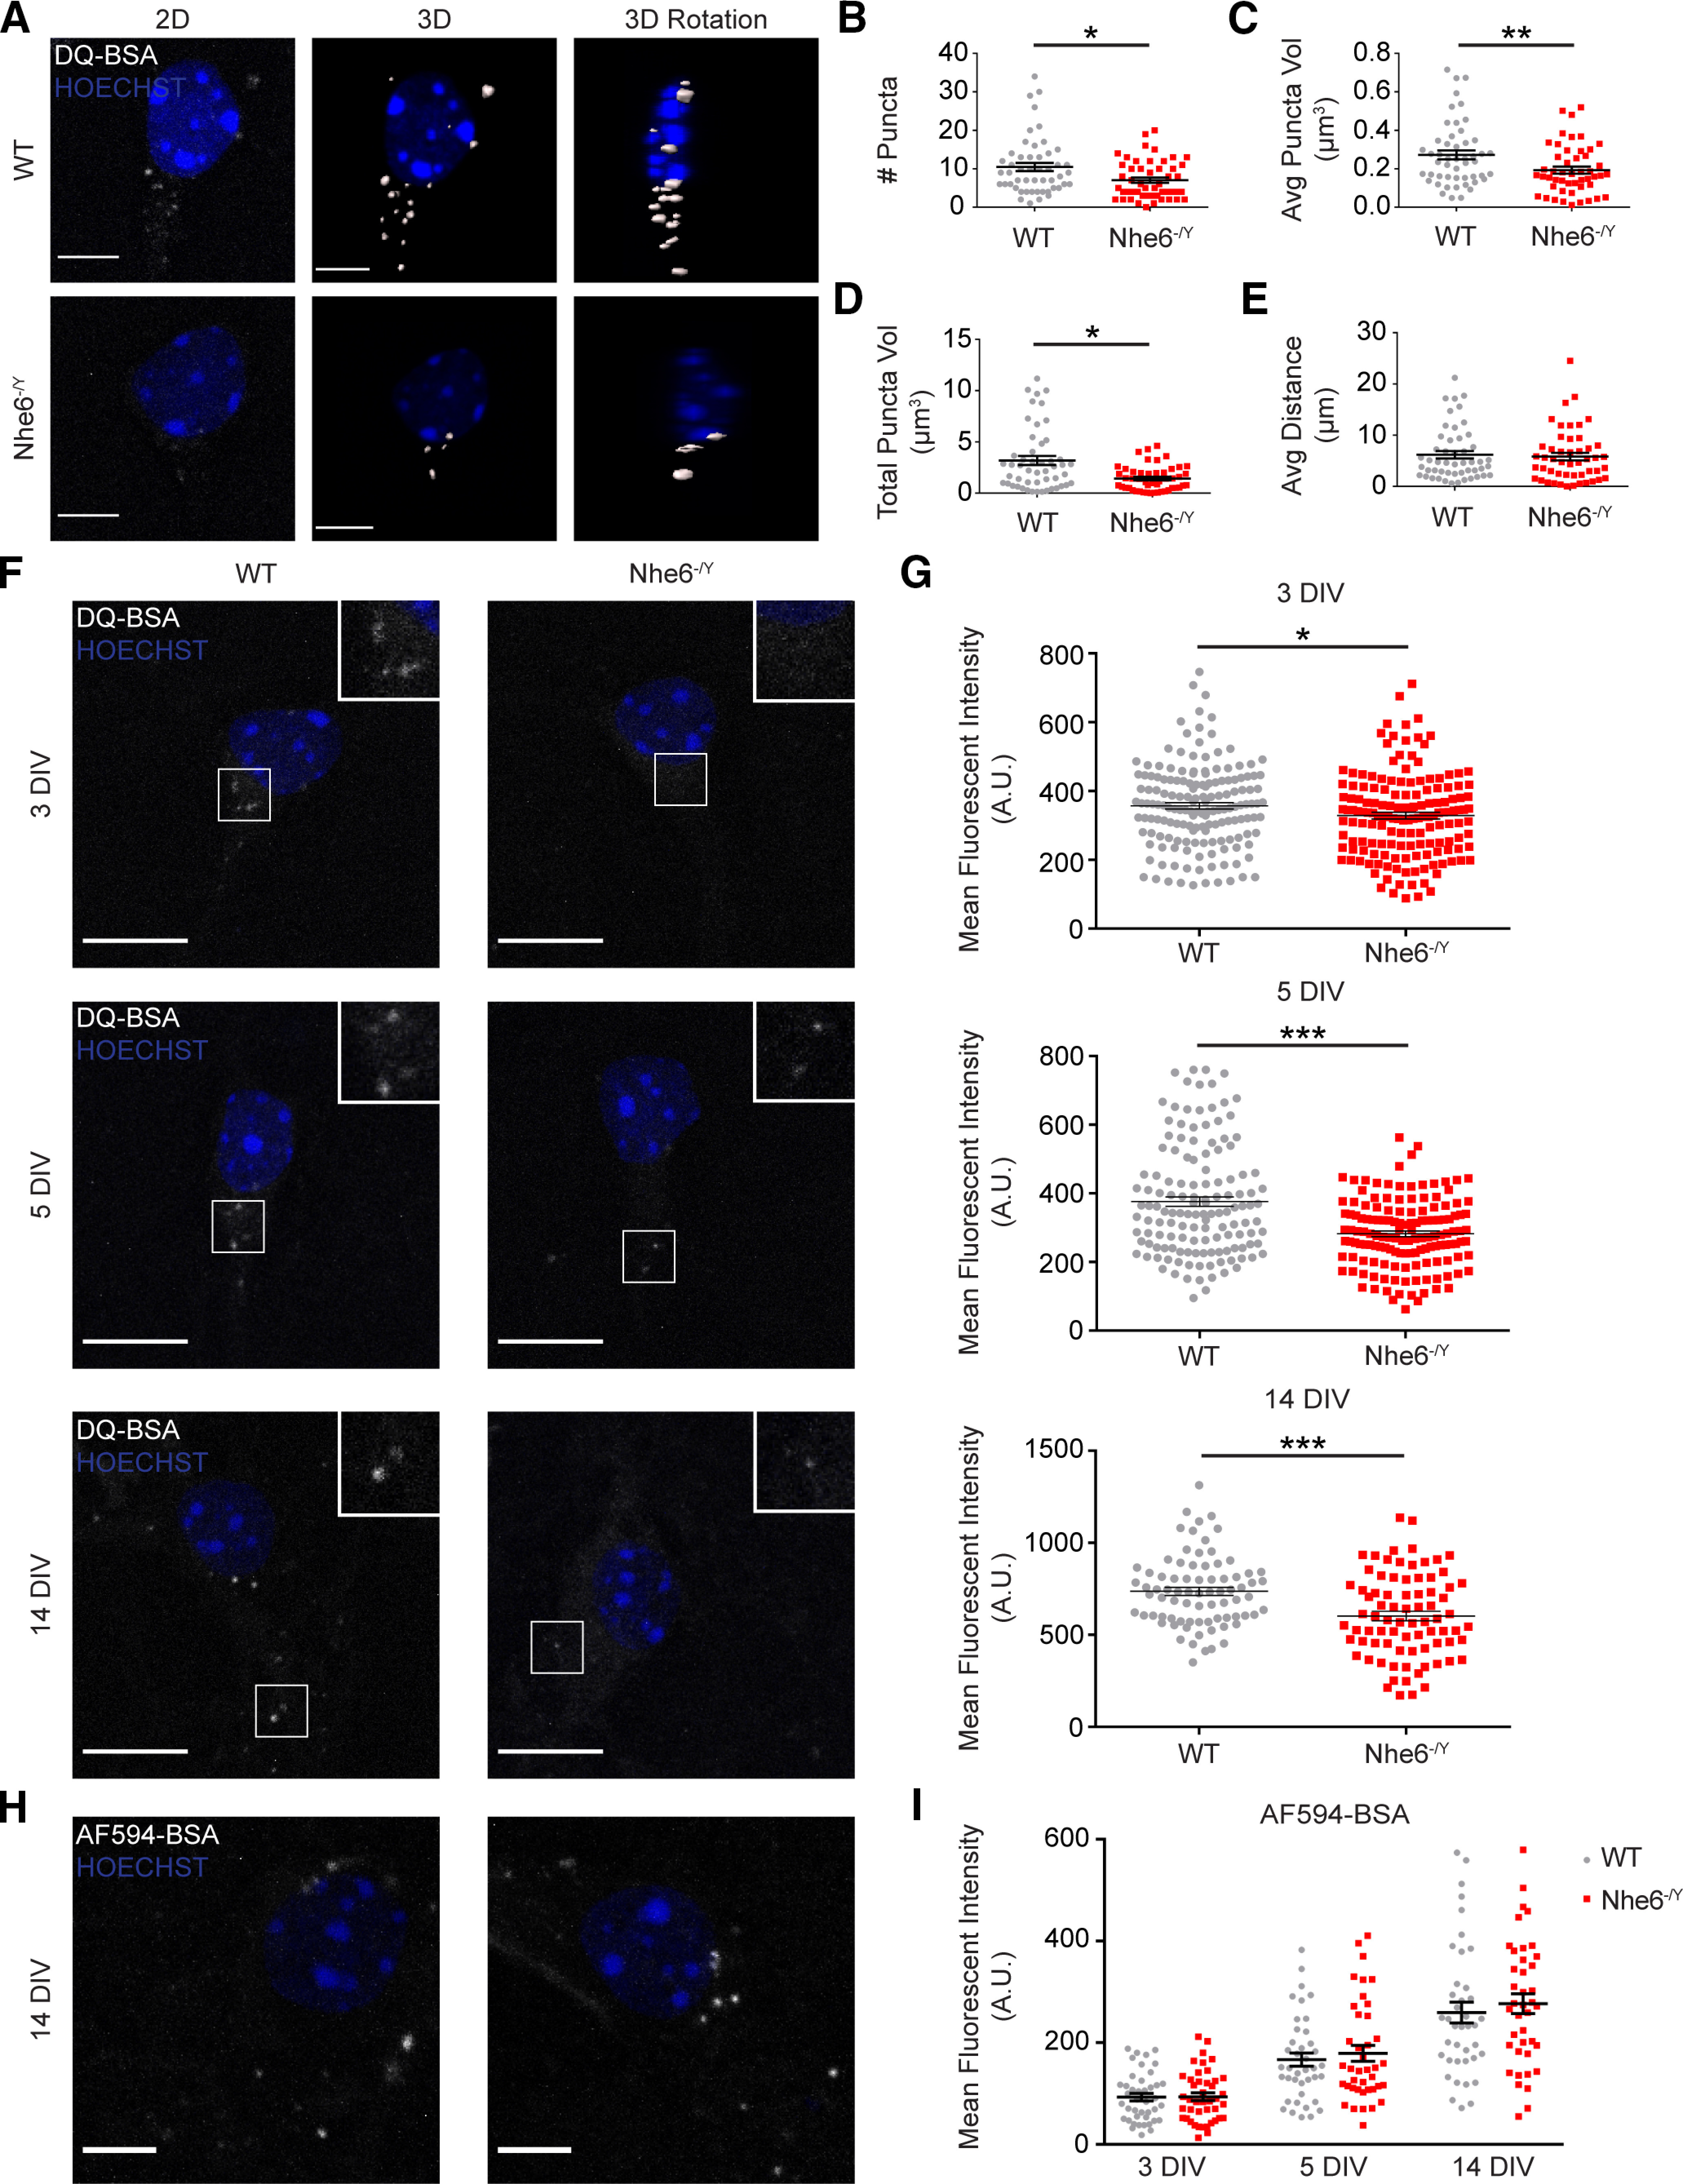
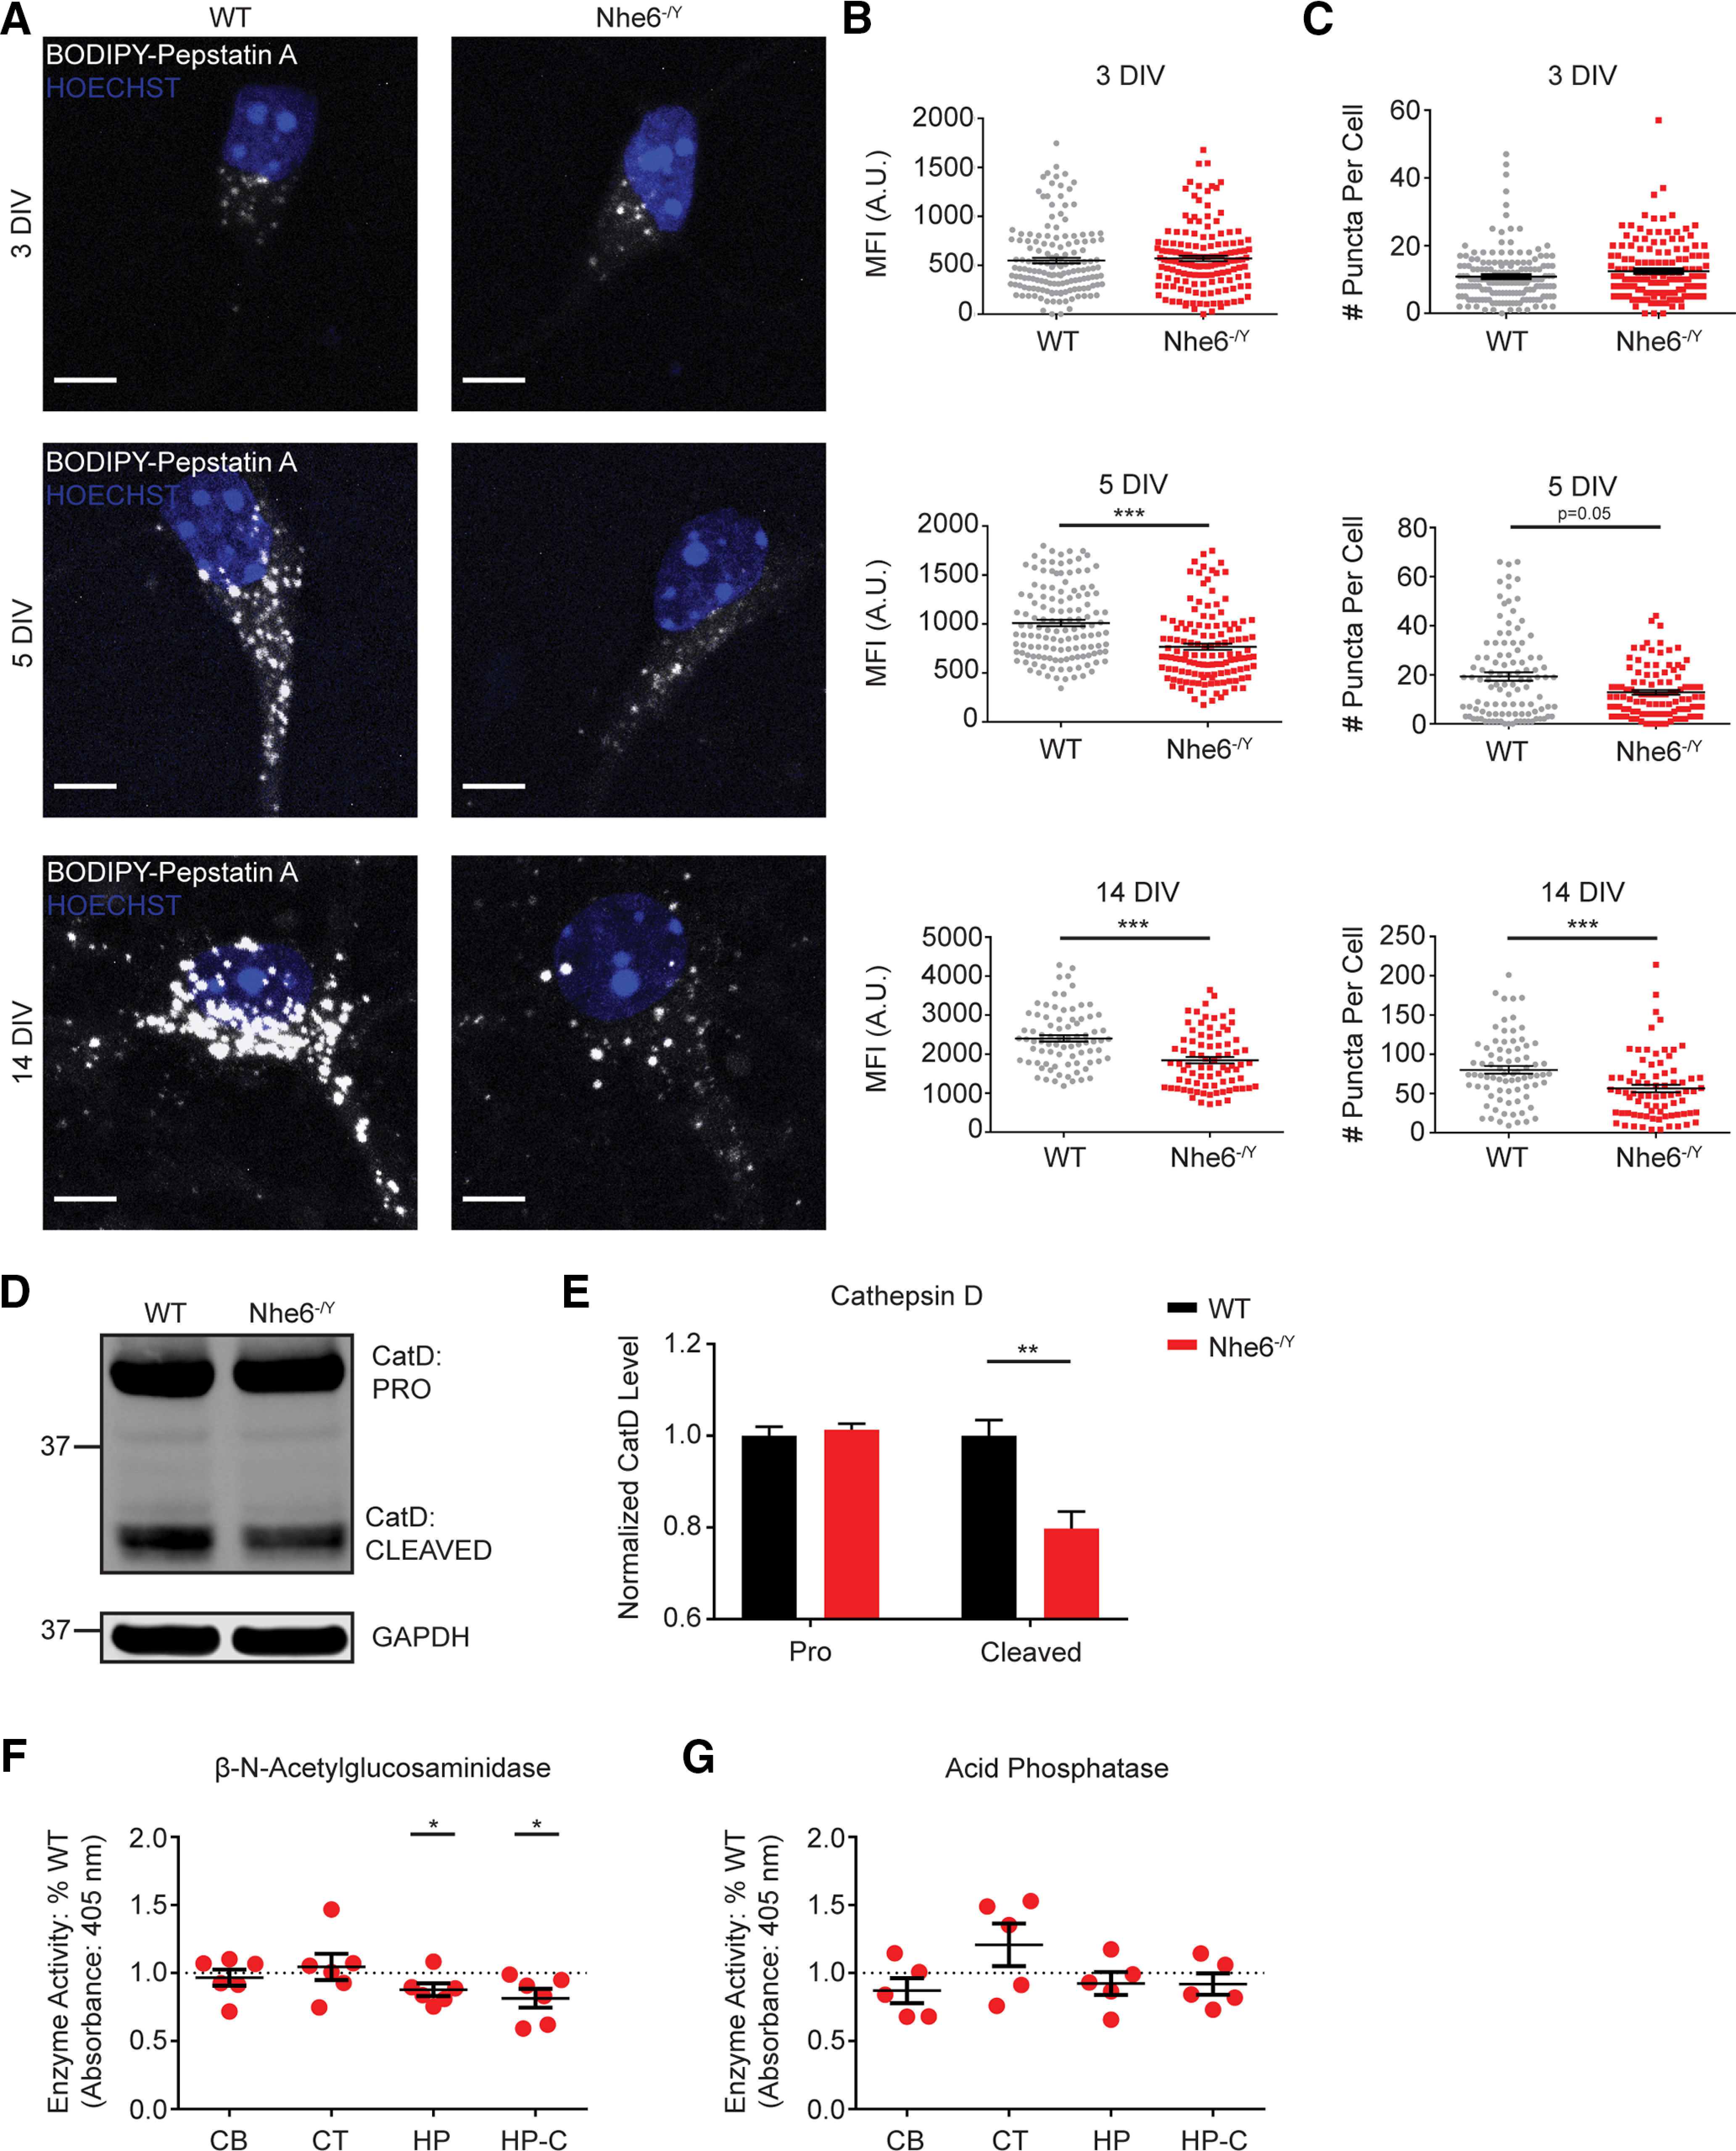
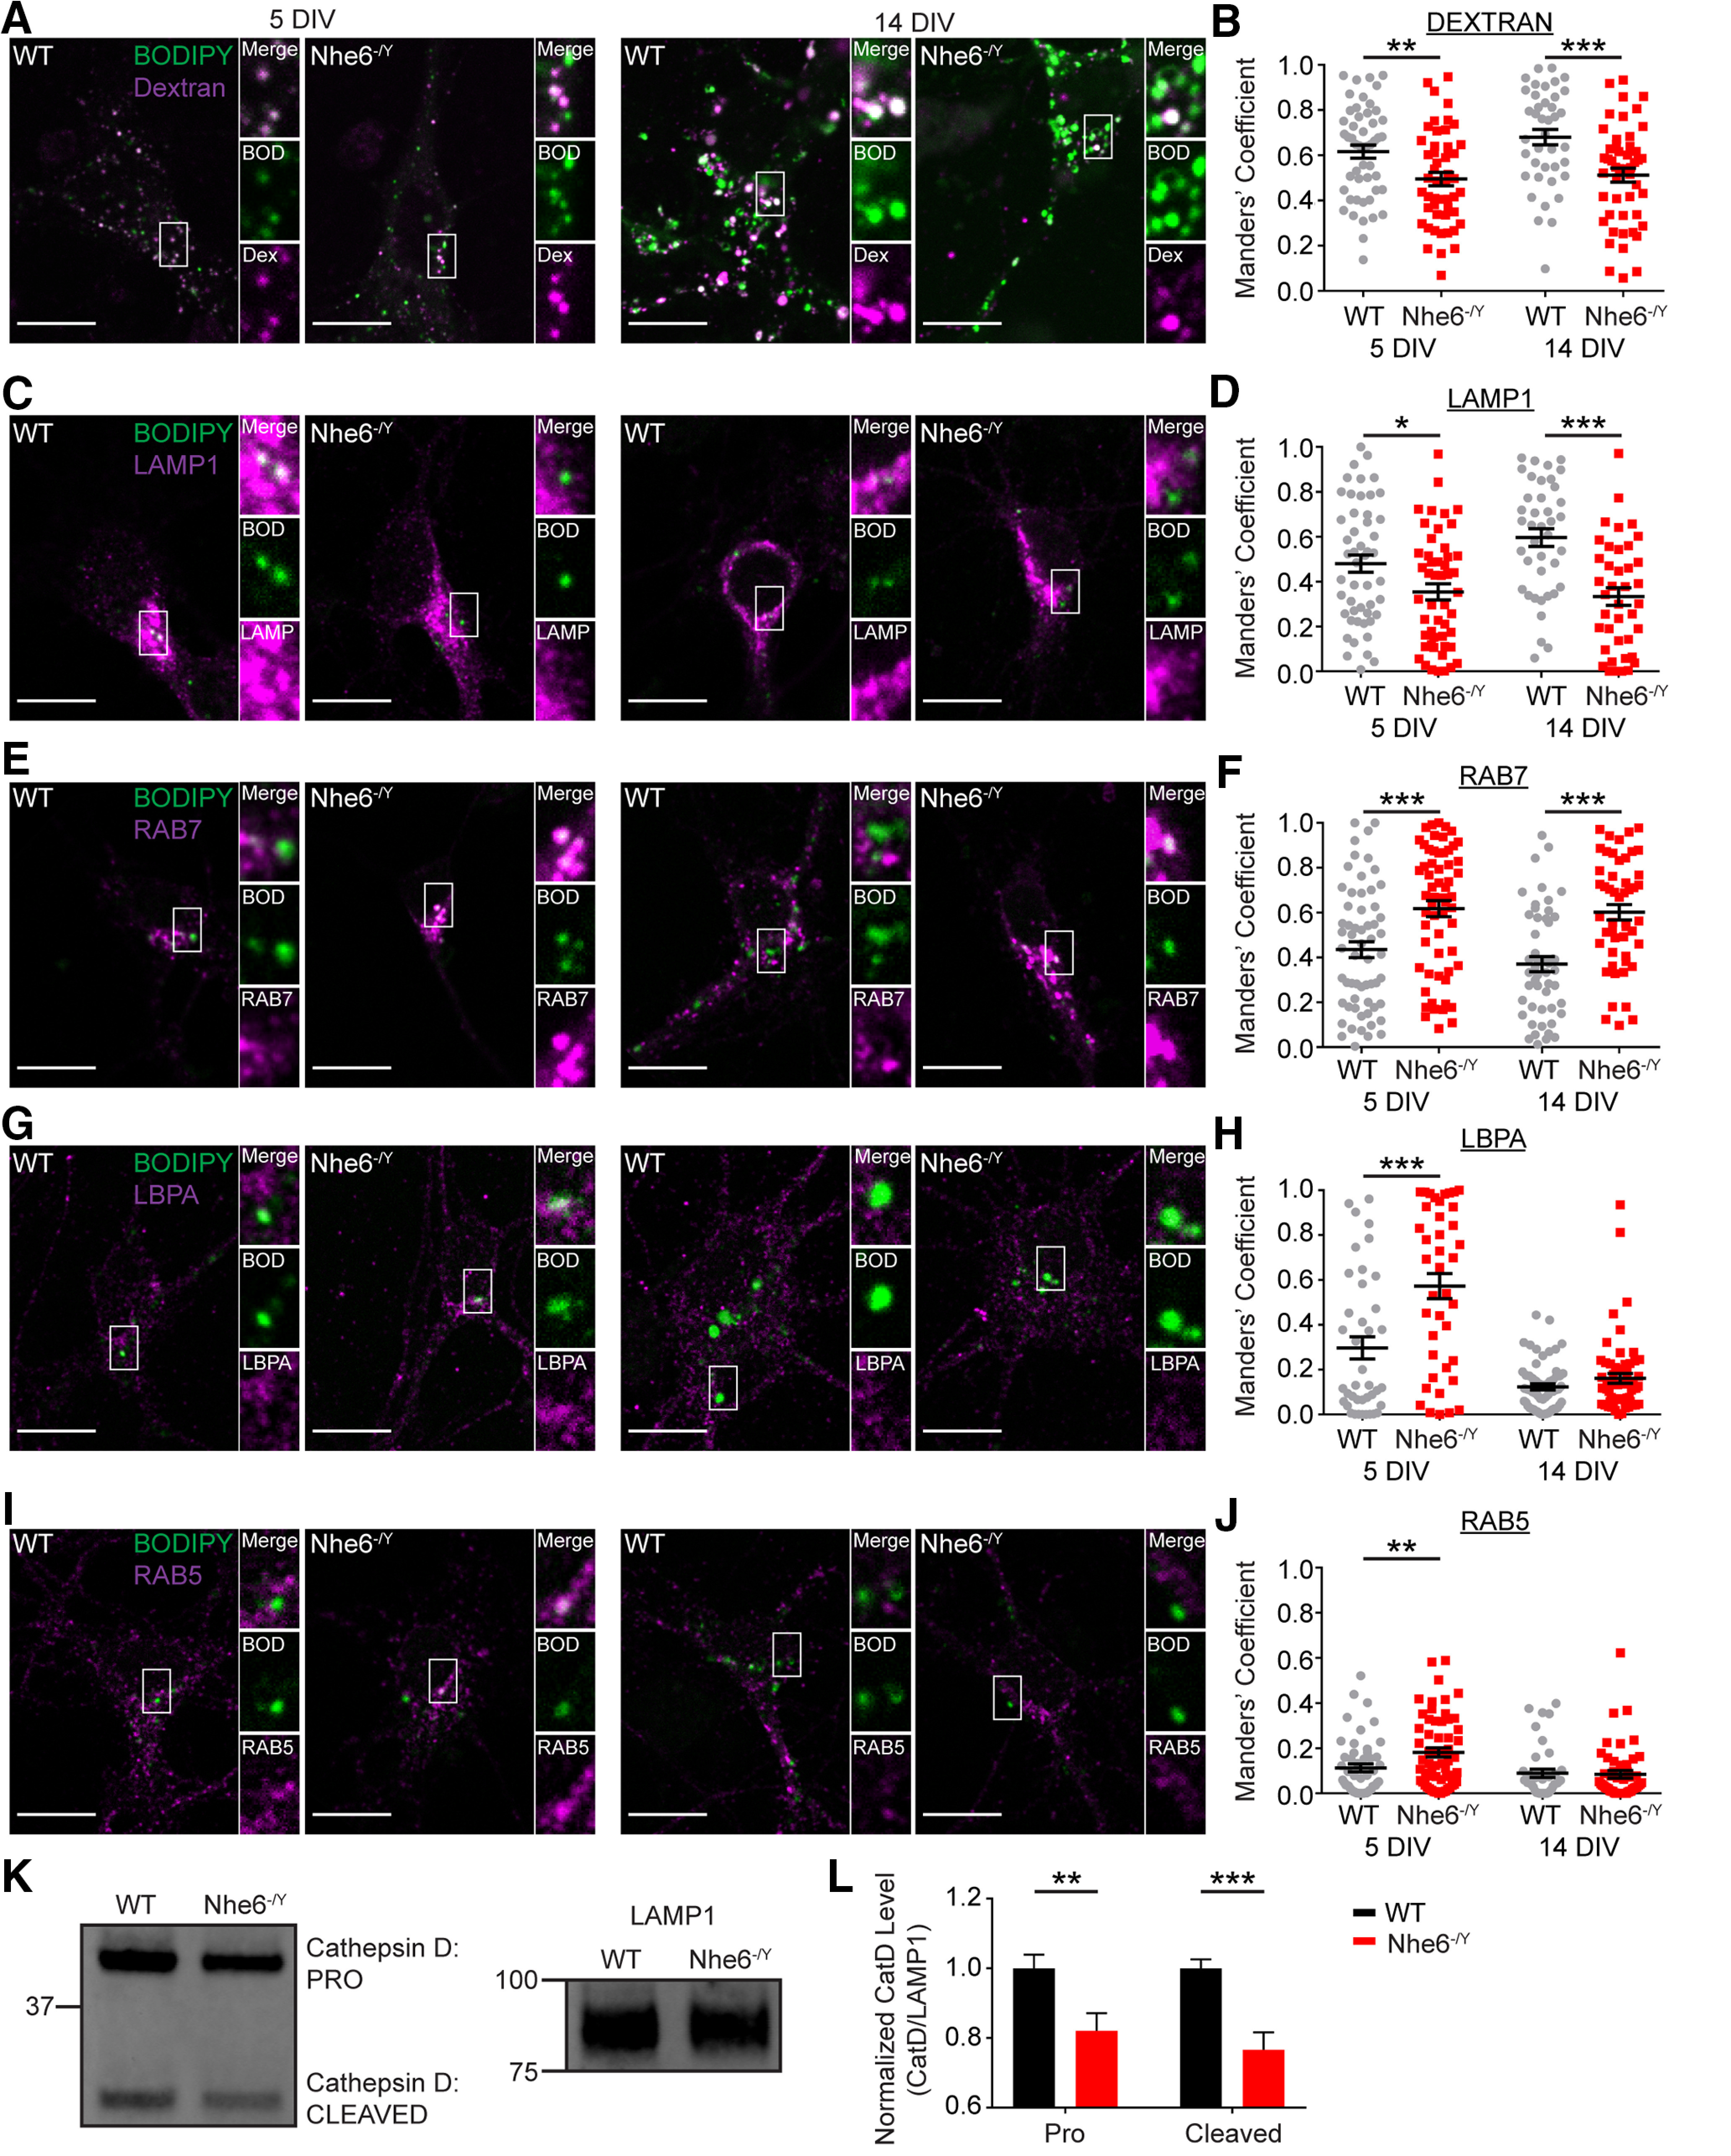
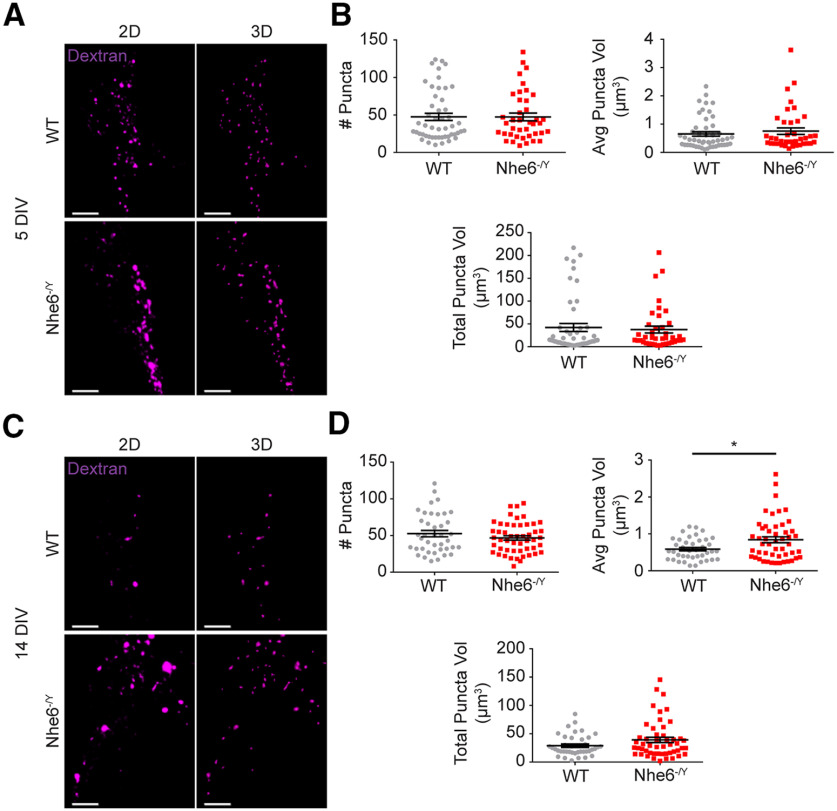
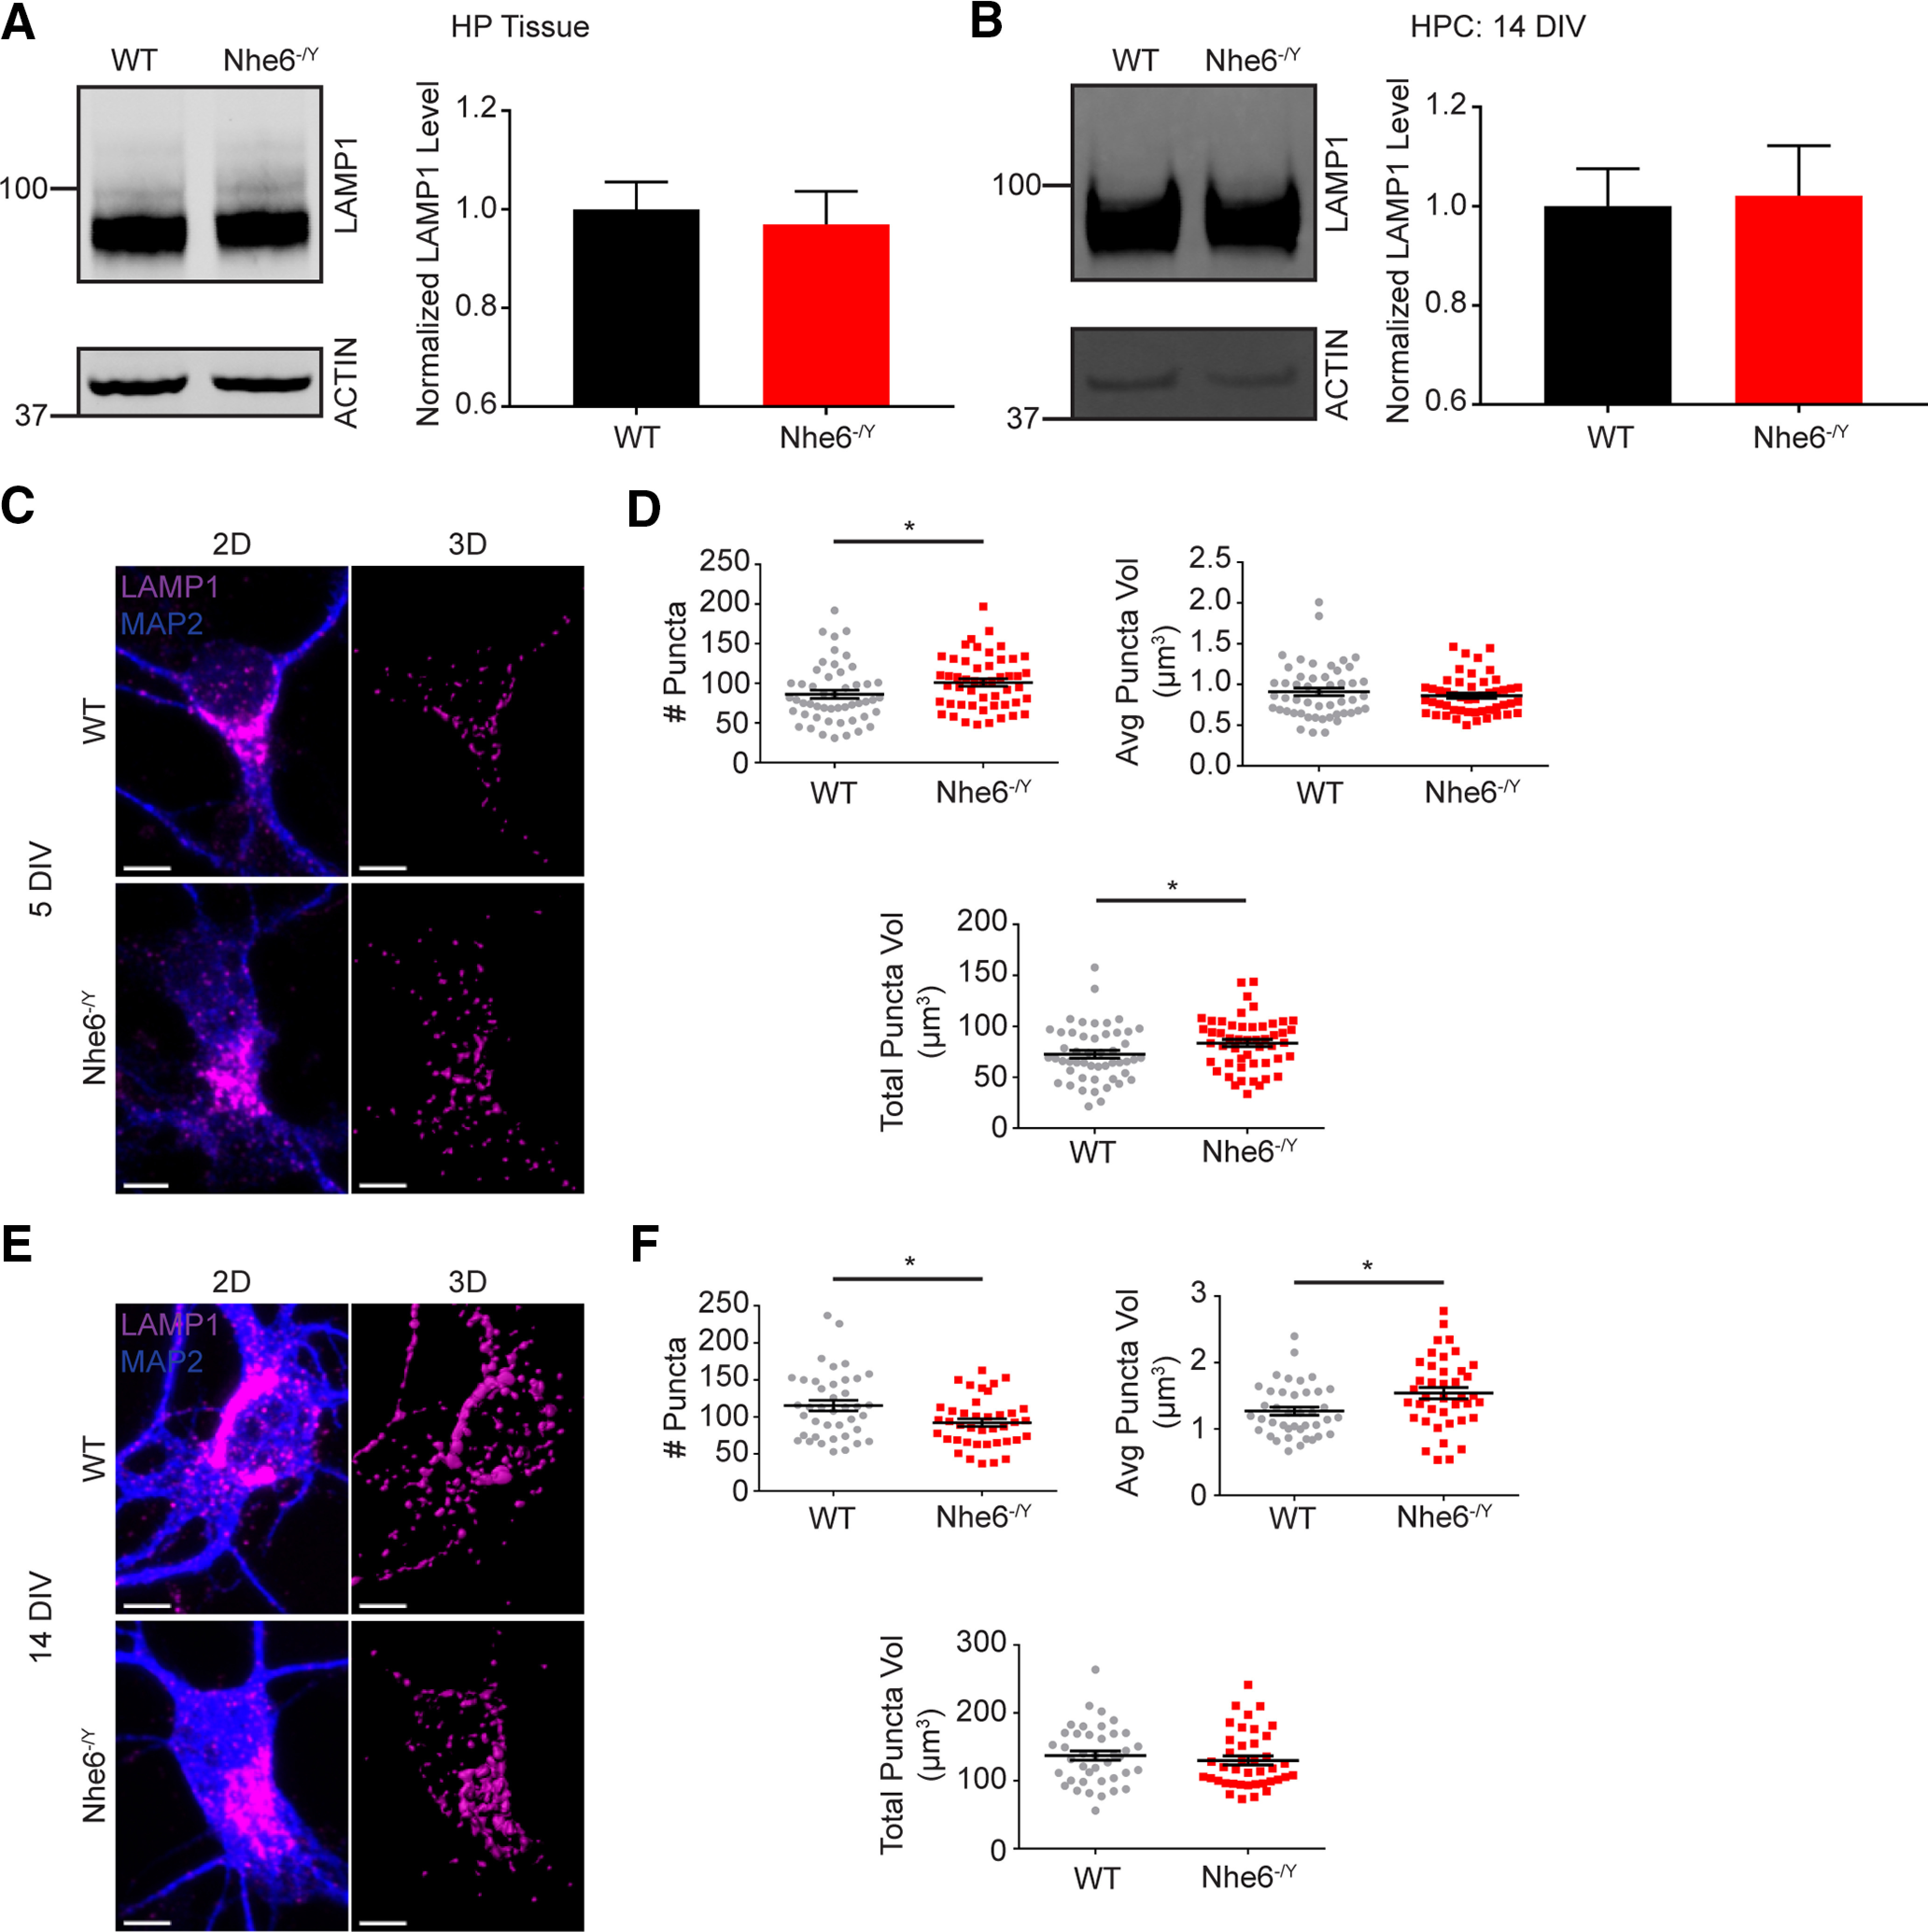
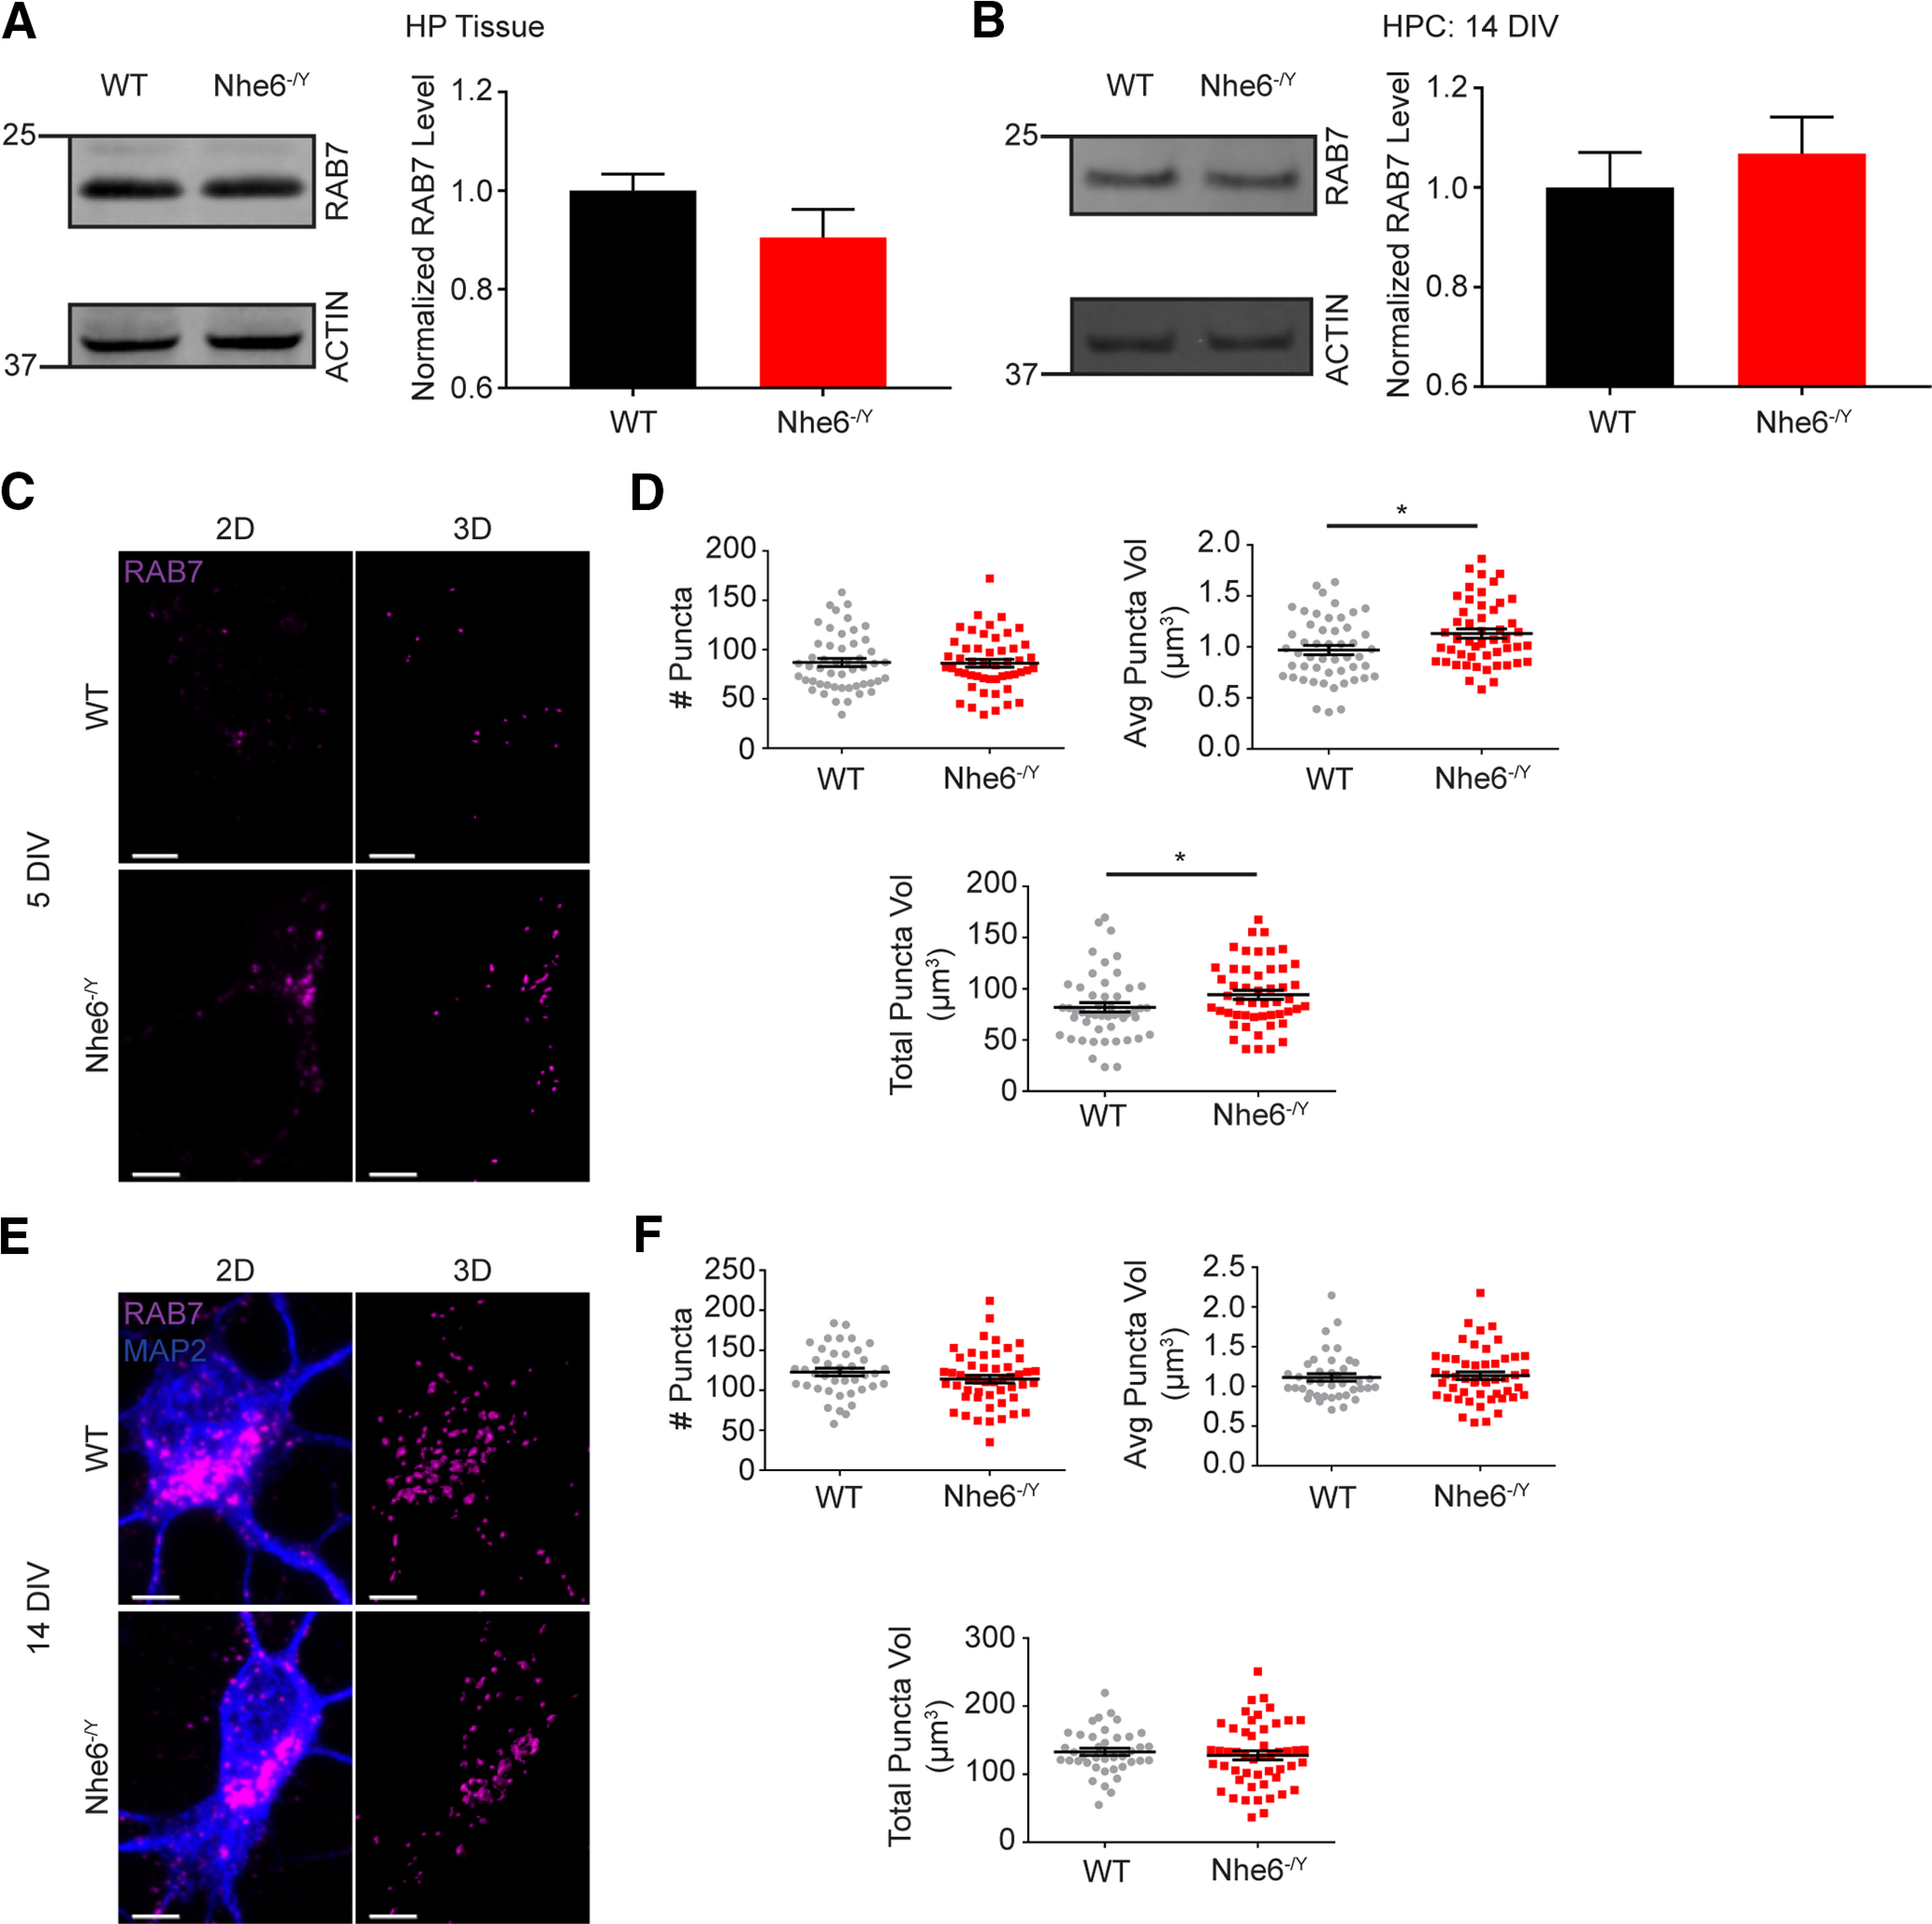
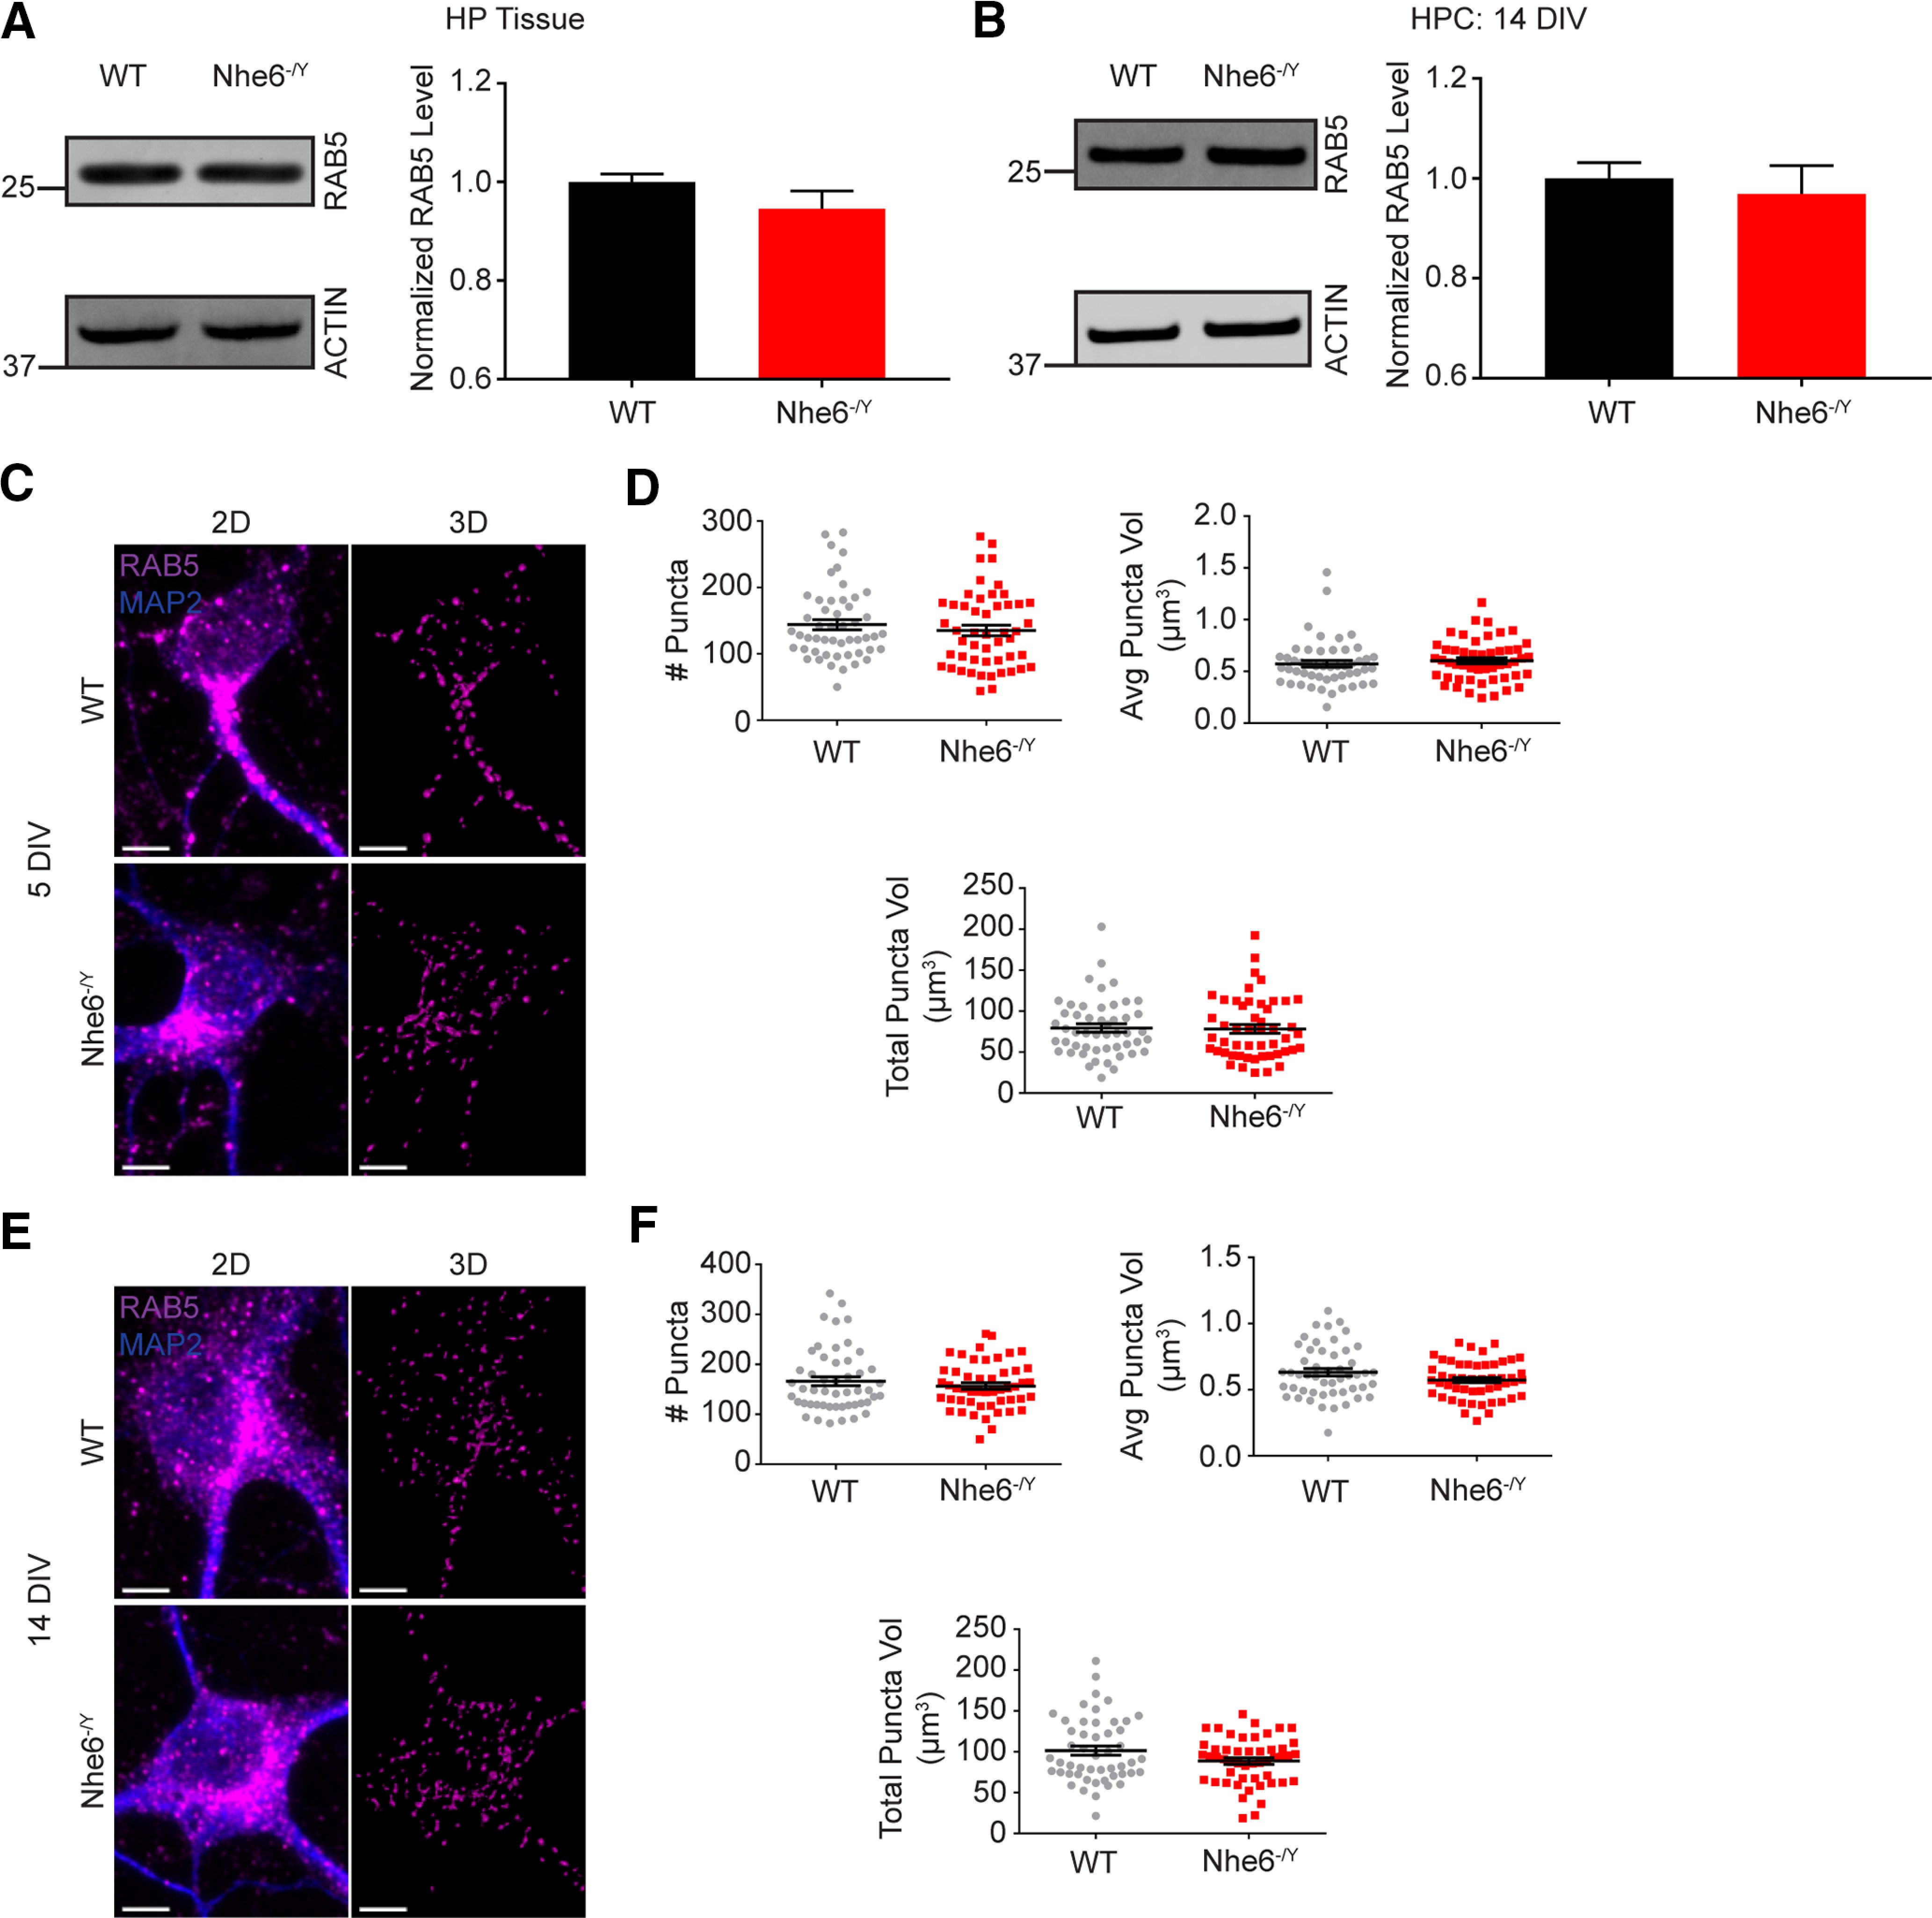
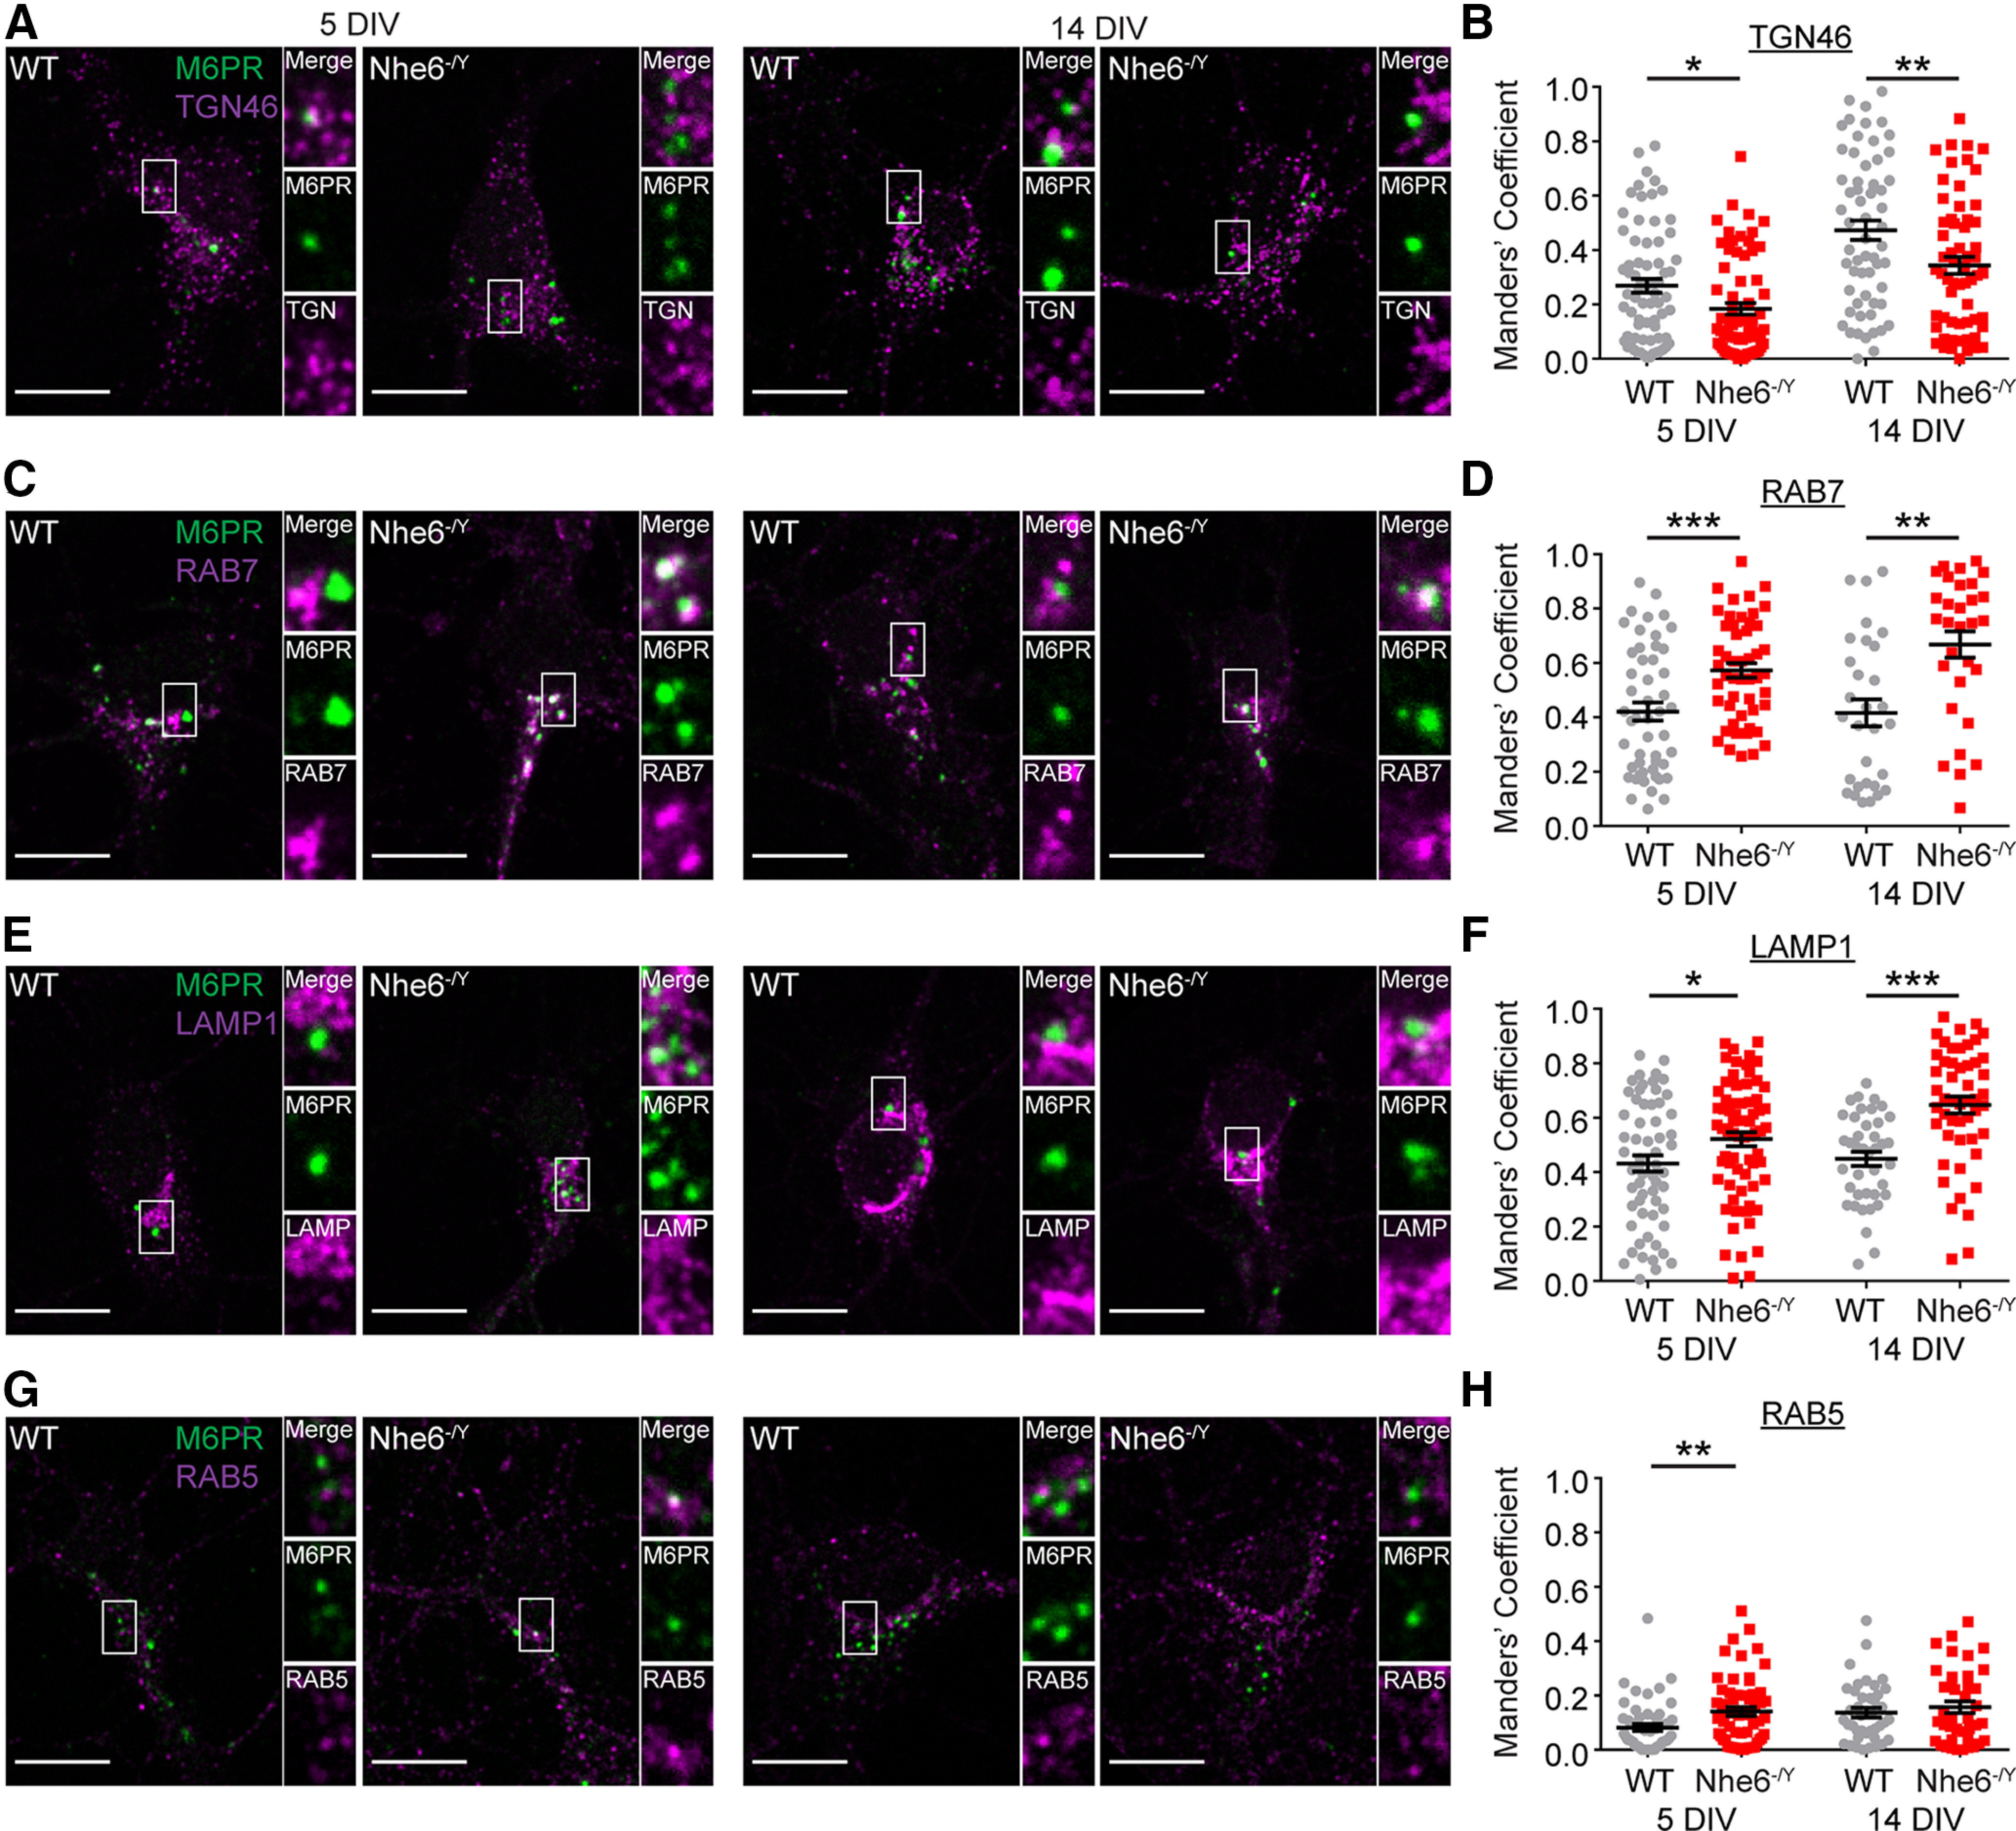
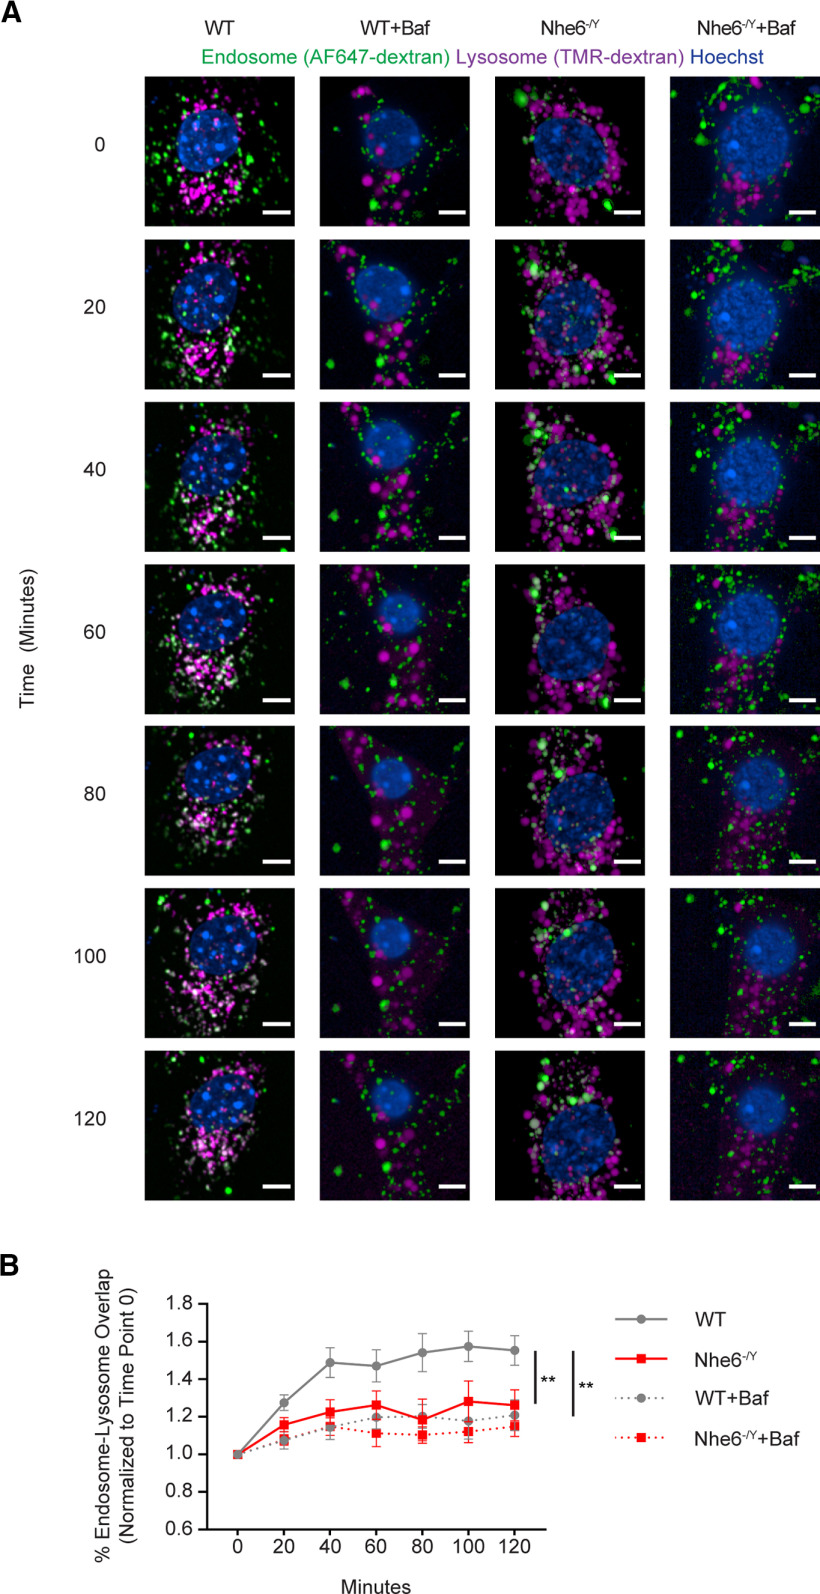
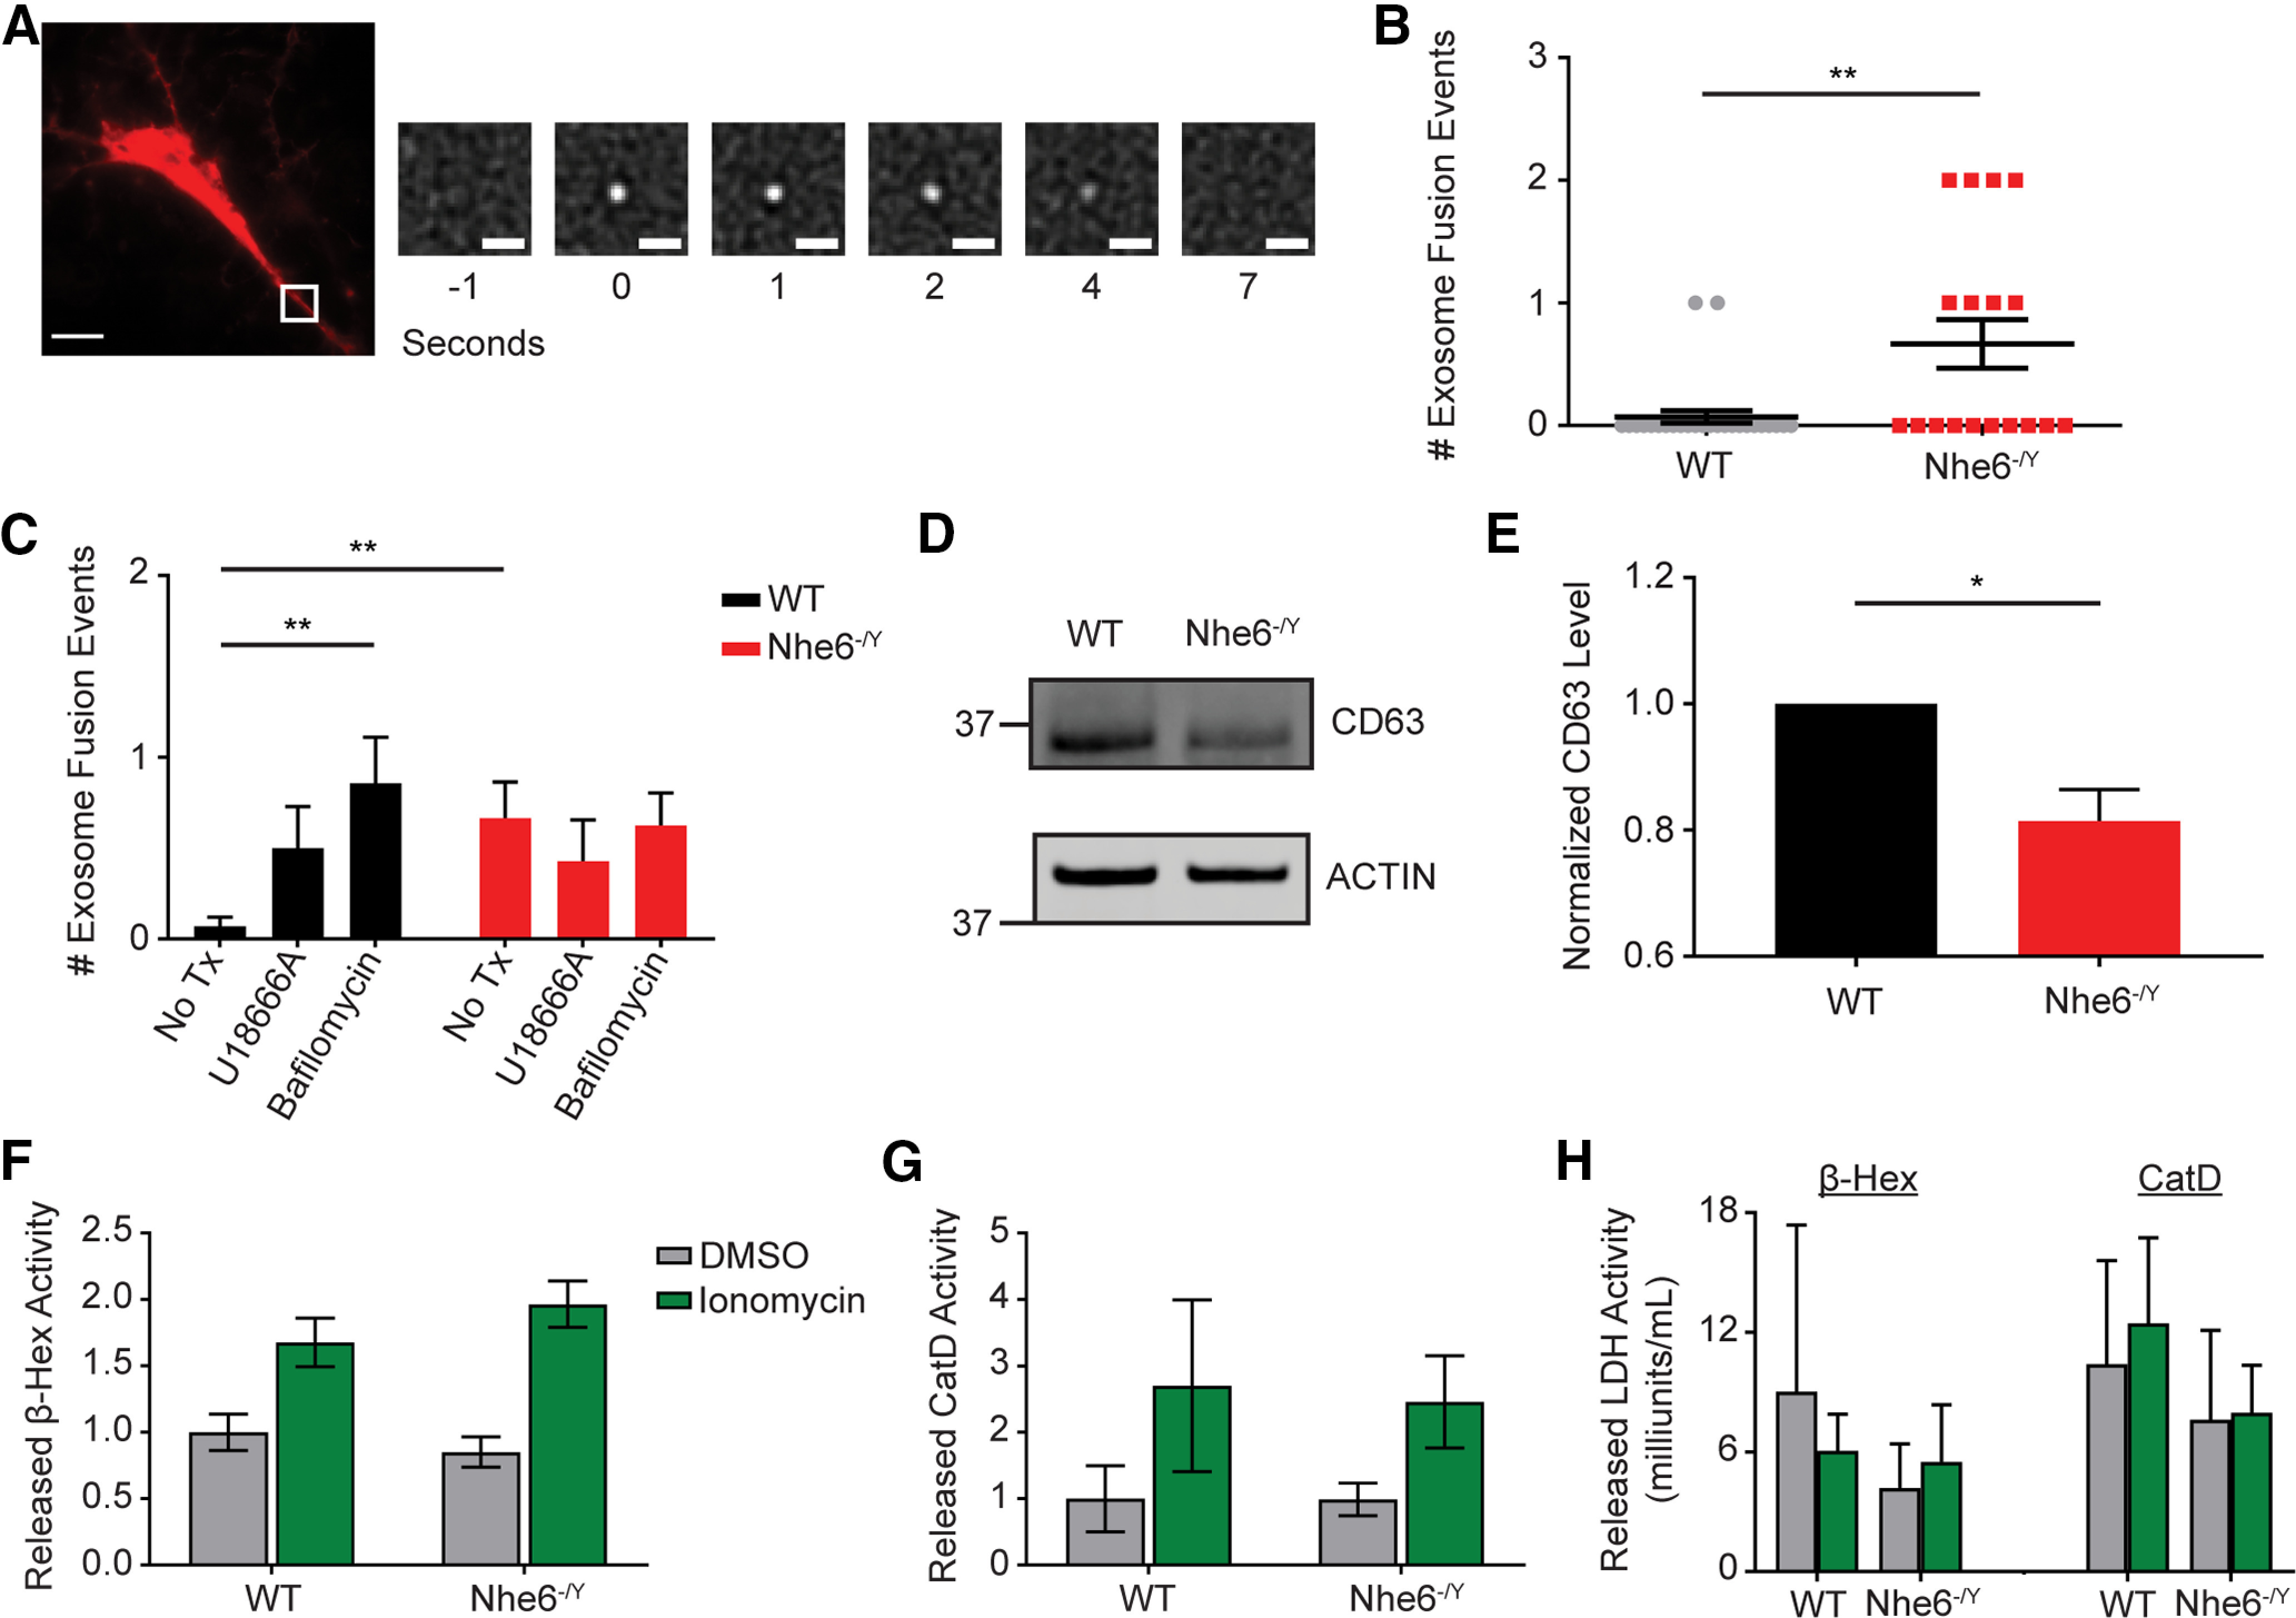
Loss-of-function mutations in endosomal Na+/H+ exchanger 6 (NHE6) cause the X-linked neurologic disorder Christianson syndrome. Patients exhibit symptoms associated with both neurodevelopmental and neurodegenerative abnormalities. While loss of NHE6 has been shown to overacidify the endosome lumen, and is associated with endolysosome neuropathology, NHE6-mediated mechanisms in endosome trafficking and lysosome function have been understudied. Here, we show that NHE6-null mouse neurons demonstrate worsening lysosome function with time in culture, likely as a result of defective endosome trafficking. NHE6-null neurons exhibit overall reduced lysosomal proteolysis despite overacidification of the endosome and lysosome lumen. Akin to Nhx1 mutants in Saccharomyces cerevisiae, we observe decreased endosome-lysosome fusion in NHE6-null neurons. Also, we find premature activation of pH-dependent cathepsin D (CatD) in endosomes. While active CatD is increased in endosomes, CatD activation and CatD protein levels are reduced in the lysosome. Protein levels of another mannose 6-phosphate receptor (M6PR)-dependent enzyme, β-N-acetylglucosaminidase, were also decreased in lysosomes of NHE6-null neurons. M6PRs accumulate in late endosomes, suggesting defective M6PR recycling and retromer function in NHE6-null neurons. Finally, coincident with decreased endosome-lysosome fusion, using total internal reflection fluorescence, we also find a prominent increase in fusion between endosomal multivesicular bodies and the plasma membrane, indicating enhanced exosome secretion from NHE6-null neurons. In summary, in addition to overacidification of endosomes and lysosomes, loss of NHE6 leads to defects in endosome maturation and trafficking, including enhanced exosome release, contributing to lysosome deficiency and potentially leading to neurodegenerative disease.SIGNIFICANCE STATEMENT Loss-of-function mutations in the endosomal Na+/H+ exchanger 6 (NHE6) cause Christianson syndrome, an X-linked neurologic disorder. Loss of NHE6 has been shown to overacidify endosomes; however, endosome trafficking mechanisms have been understudied, and the mechanisms leading to neurodegeneration are largely unknown. In NHE6-null mouse neurons in vitro, we find worsening lysosome function with days in culture. Notably, pH-dependent lysosome enzymes, such as cathepsin D, have reduced activity in lysosomes yet increased, precocious activity in endosomes in NHE6-null neurons. Further, endosomes show reduced fusion to lysosomes, and increased fusion to the plasma membrane with increased exosome release. This study identifies new mechanisms involving defective endosome maturation and trafficking that impair lysosome function in Christianson syndrome, likely contributing to neurodegeneration.

Keywords: Christianson syndrome; NHE6; endosome; exosome; lysosome; neurodegeneration.


Figures

Figure 1.
Figure 1.
Decreased lysosomal proteolysis in NHE6-null neurons in vitro. A, Puncta analysis by fluorescence microscopy and 3D images of WT and Nhe6-/Y male primary hippocampal neurons following DQ-BSA treatment at DIV 5. Images are denoted as: 2D (i.e., DQ-BSA fluorescent microscopy maximum intensity projection images), 3D (i.e., 3D reconstruction of DQ-BSA puncta), and 3D Rotation (i.e., 3D image rotated 90° along the x axis). B–E, Quantification of 3D-reconstructed DQ-BSA puncta. B, Number of DQ-BSA puncta per cell (WT n = 50 cells from 5 mice, Nhe6-/Y n = 50 cells from 5 mice, 4 litters, p = 0.02, Glass's Δ = 0.46). C, Average DQ-BSA puncta volume per cell (WT n = 50 cells from 5 mice, Nhe6-/Y n = 49 cells from 5 mice, 4 litters, p = 0.002, Cohen's d = 0.54). D, Total summed DQ-BSA puncta volume per cell (WT n = 50 cells from 5 mice, Nhe6-/Y n = 49 cells from 5 mice, 4 litters, p = 0.01, Glass's Δ = 0.58). E, Average distance of DQ-BSA puncta from nucleus (WT n = 50 cells from 5 mice, Nhe6-/Y n = 49 cells from 5 mice, 4 litters). F, Confocal microscopy images of male WT and Nhe6-null littermate primary hippocampal neurons following DQ-BSA treatment at DIV 3, 5, and 14. G, Quantification of MFI at 3 DIV (WT n = 160 cells, Nhe6-/Y n = 156 cells, 5 mice per genotype, 4 litters, p = 0.04, Cohen's d = 0.23), 5 DIV (WT n = 138 cells, Nhe6-/Y n = 143 cells, 5 mice per genotype, 4 litters, p < 0.0001, Glass's Δ = 0.58), or 14 DIV (WT n = 78 cells, Nhe6-/Y n = 80 cells, 4 mice per genotype, 4 litters, p < 0.0001, Cohen's d = 0.64). Some primary neurons at 5 DIV were analyzed in both 3D reconstruction and MFI data. H, Fluorescence microscopy images of WT and Nhe6-/Y male primary hippocampal neurons following BSA-AF594 treatment at 14 DIV. I, Quantification of MFI at 3 DIV (WT n = 42 cells, Nhe6-/Y n = 43 cells, 5 mice per genotype, 5 litters), 5 DIV (WT n = 40 cells, Nhe6-/Y n = 40 cells, 5 mice per genotype, 5 litters), or 14 DIV (WT n = 40 cells, Nhe6-/Y n = 40 cells, 5 mice per genotype, 5 litters). Nuclei are marked in blue by Hoechst. Scale bars: A, H, 5 µm; F, 10 µm. Data are mean ± SEM. Unpaired two-tailed Student's t test (G, 3 and 14 DIV; I, 3 and 14 DIV) or Mann–Whitney test (B-E,G, 5 DIV; I, 5 DIV).
Figure 2.
Figure 2.
Loss of NHE6 impairs lysosome enzyme function in vitro and ex vivo. A, Confocal microscopy images of mature CatD using BODIPY-pepstatin A in WT and Nhe6-/Y male mouse primary hippocampal neurons at DIV 3, 5, and 14. B, Quantification of MFI per cell at 3 DIV (WT n = 153 cells, Nhe6-/Y n = 148 cells, 5 mice per genotype, 5 litters), 5 DIV (WT n = 130 cells, Nhe6-/Y n = 129 cells, 5 mice per genotype, 3 litters, p < 0.0001, Cohen's d = 0.66), and 14 DIV (WT n = 80 cells, Nhe6-/Y n = 80 cells, 4 mice per genotype, 4 litters, p < 0.0001, Cohen's d = 0.76). C, Quantification of number (#) of puncta per cell at 3 DIV (WT n = 161 cells, Nhe6-/Y n = 148 cells, 5 mice per genotype, 5 litters), 5 DIV (WT n = 107 cells, Nhe6-/Y n = 105 cells, 4 mice per genotype, 3 litters, p = 0.05, Glass's Δ = 0.37), and 14 DIV (WT n = 78 cells, Nhe6-/Y n = 78 cells from, 4 mice per genotype, 4 litters, p < 0.0001, Cohen's d = 0.56). D, E, CatD western blot (D) and quantification (E) in WT and Nhe6-/Y male littermate mice, acutely dissected hippocampal tissue at 8 weeks old (WT n = 11 animals, Nhe6-/Y n = 6 animals, 6 litters, cleaved CatD p = 0.003, Hedges' g = 1.77). F, β-NAG and (G) acid phosphatase enzyme activity in Nhe6-/Y male littermate mice, acutely dissected brain tissue (CB, Cerebellum; CT, cortex; HP, hippocampus; p = 0.047, Hedges' g = 0.78) at 8 weeks old as well as primary hippocampal neurons at 14 DIV relative to male WT littermates (HP-C, Hippocampal culture, p = 0.044, Hedges' g = 1.42). The sample sizes are as follows: β-NAG brain tissue (WT n = 9 animals, Nhe6-/Y n = 6 animals, 6 litters), β-NAG hippocampal culture (WT n = 6 animals, Nhe6-/Y n = 6 animals, 6 litters), acid phosphatase brain tissue (WT n = 7 animals, Nhe6-/Y n = 5 animals, 5 litters), and acid phosphatase hippocampal culture (WT n = 5 animals, Nhe6-/Y n = 5 animals, 5 litters). Values are expressed as the percentage of Nhe6-/Y activity relative to its WT male littermate activity. Nuclei are marked in blue by Hoechst. Scale bars, 5 µm. Data are mean ± SEM. A.U., Arbitrary units; CB, cerebellum; CT, cortex; HP, hippocampus; HP-C, hippocampal cultures. One-sample Student's t test with a hypothetical mean = 1 (F,G), unpaired two-tailed Student's t test (E), or Mann–Whitney test (B,C).
Figure 3.
Figure 3.
Intraluminal lysosome pH more acidic in NHE6-null neurons. A, Single-plane confocal microscopy images of lysosome pH loaded with fluorescent dextrans (i.e., pH-sensitive OG 488-dextran and pH-insensitive TMR-dextran) in male WT and NHE6-null mouse primary hippocampal neurons at DIV 8. B, Quantification of intraluminal lysosome pH in soma and processes (WT n = 11 animals, Nhe6-/Y n = 10 animals, 5 litters; soma: p = 0.002, Hedges' g = 1.43; processes: p = 0.002, Hedges' g = 1.60). C, Single-plane confocal microscopy images of lysosome pH loaded with fluorescent dextrans (i.e., pH-sensitive OG 488-dextran and pH-insensitive TMR-dextran) following bafilomycin A1 treatment (100 nm) in male WT and NHE6-null mouse primary hippocampal neurons at DIV 8. D, Quantification of intraluminal lysosome pH in soma and processes following bafilomycin A1 treatment (WT n = 4 animals, Nhe6-/Y n = 7 animals, 3 litters). E, Single-plane confocal microscopy images of endosome pH loaded with fluorescent transferrin (i.e., pH-sensitive FITC-transferrin and pH-insensitive AlexaFluor-546-transferrin) in male WT and NHE6-null mouse primary hippocampal neurons at DIV 5. F, Quantification of luminal endosome pH in soma and processes (WT n = 21, Nhe6-/Y n = 22, 13 litters; soma: p = 0.04, Cohen's d = 0.66; processes: p = 0.01, Cohen's d = 0.83). Orange arrows indicate soma. Yellow arrowheads denote processes. Scale bars, 50 µm. Data are mean ± SEM. Unpaired two-tailed Student's t test (B, processes, F) with Welch's correction (D, soma) or Mann–Whitney test (B, soma).
Figure 4.
Figure 4.
Loss of NHE6 alters CatD activation and distribution across the endosome and lysosome compartment. Confocal microscopy single-plane images of BODIPY-pepstatin A colocalization with different endosomes and the lysosome in male WT and NHE6-null mouse primary hippocampal neurons at DIV 5 and 14. Colocalization of active CatD within distinct endosome and lysosome compartments was tested using BODIPY-pepstatin A colocalization with the following markers: (A) dextran (lysosome), (C) LAMP1 (lysosome and late endosome), (E) RAB7 (late endosome), (G) LBPA (late endosome), and (I) RAB5 (early endosome). BODIPY-pepstatin A colocalization with these markers was quantified using the Manders' coefficient (i.e., degree BODIPY-pepstatin A signal overlaps with marker signal or M1). B, Quantification of BODIPY-pepstatin A colocalization with dextran at 5 DIV (WT n = 50 cells, Nhe6-/Y n = 50 cells, 5 mice per genotype, 3 litters, p = 0.004, Cohen's d = 0.58) and 14 DIV (WT n = 40 cells from 4 mice, Nhe6-/Y n = 50 cells from 5 mice, 3 litters, p = 0.0004, Cohen's d = 0.78). D, Quantification of BODIPY-pepstatin A colocalization with LAMP1 at 5 DIV (WT n = 50 cells, Nhe6-/Y n = 50 cells, 5 mice per genotype, 4 litters, p = 0.018, Cohen's d = 0.48) and 14 DIV (WT n = 40 cells, Nhe6-/Y n = 40 cells, 4 mice per genotype, 3 litters, p < 0.0001, Cohen's d = 1.06). F, Quantification of BODIPY-pepstatin A colocalization with RAB7 at 5 DIV (WT n = 60 cells, Nhe6-/Y n = 60 cells, 6 mice per genotype, 4 litters, p = 0.0004, Cohen's d = 0.66) and 14 DIV (WT n = 50 cells, Nhe6-/Y n = 50 cells, 5 mice per genotype, 3 litters, p < 0.0001, Cohen's d = 0.95). H, Quantification of BODIPY-pepstatin A colocalization with LBPA at 5 DIV (WT n = 40 cells, Nhe6-/Y n = 40 cells, 4 mice per genotype, 3 litters, p < 0.0003, Cohen's d = 0.82) and 14 DIV (WT n = 70 cells, Nhe6-/Y n = 70 cells, 7 mice per genotype, 5 litters). J, Quantification of BODIPY-pepstatin A colocalization with RAB5 at 5 DIV (WT n = 50 cells from 5 mice, Nhe6-/Y n = 60 cells from 6 mice, 4 litters, p = 0.009, Cohen's d = 0.49) and 14 DIV (WT n = 40 cells from 4 mice, Nhe6-/Y n = 50 cells from 5 mice, 3 litters). K, L, CatD western blot (K) and quantification (L) in LEFs from acutely dissected 4-month-old WT and Nhe6-/Y male littermate hippocampus and neocortex combined (WT n = 10, Nhe6-/Y n = 8, 7 litters, pro CatD p = 0.007, Hedges' g = 1.26, cleaved CatD p = 0.0007, Hedges' g = 1.99). CatD was normalized to LAMP1. Scale bars, 10 µm. BOD, BODIPY-pepstatin A; DEX, Dextran. Data are mean ± SEM. Unpaired two-tailed Student's t test (B,D,F, 14 DIV; L, cleaved CatD) or Mann–Whitney test (F, 5 DIV; H,J,L, pro-CatD).
Figure 5.
Figure 5.
Larger lysosome-associated dextran puncta in mature NHE6-null neurons. A, Confocal microscopy images of WT and Nhe6-/Y male primary hippocampal neurons following dextran treatment at DIV 5. Images are denoted as 2D (i.e., fluorescent microscopy images) and 3D (i.e., 3D reconstruction of dextran puncta). B, Quantification of 3D-reconstructed dextran puncta at DIV 5 (WT n = 50 cells from 5 mice, Nhe6-/Y n = 40 cells from 4 mice, 3 litters). Graphs depict the following: number of dextran puncta per cell, average dextran puncta volume per cell, and total summed dextran puncta volume per cell. C, Confocal microscopy images of WT and Nhe6-/Y male primary hippocampal neurons following dextran treatment at DIV 14. D, Quantification of 3D-reconstructed dextran puncta at DIV 14 (WT n = 40 cells from 4 mice, Nhe6-/Y n = 50 cells from 5 mice, 3 litters). Graphs depict the following: number of dextran puncta per cell, average dextran puncta volume per cell (p = 0.04, Glass's Δ = 0.87), and total summed dextran puncta volume per cell (Welch's correction). Scale bars, 5 µm. Data are mean ± SEM. Unpaired two-tailed Student's t test (D, number of dextran puncta and average dextran puncta volume-transformed) or Mann–Whitney test (B,D, total dextran puncta volume).
Figure 6.
Figure 6.
LAMP1 dysfunction in NHE6-null neurons. A, LAMP1 western blot and quantification in WT and Nhe6-/Y male littermate mice, acutely dissected hippocampal tissue at 8 weeks old (WT n = 9 animals, Nhe6-/Y n = 5 animals, 5 litters). B, LAMP1 western blot and quantification in WT and Nhe6-/Y male primary hippocampal neurons at 14 DIV (WT n = 5 animals, Nhe6-/Y n = 5 animals, 5 litters). C, Confocal microscopy images of WT and Nhe6-/Y male primary hippocampal neurons at 5 DIV labeled with LAMP1 antibody. Images are denoted as 2D (i.e., fluorescent microscopy images) and 3D (i.e., 3D reconstruction of LAMP1 puncta). D, Quantification of 3D-reconstructed LAMP1 puncta at DIV 5 (WT n = 50 cells, Nhe6-/Y n = 50 cells, 5 mice per genotype, 3 litters). Graphs depict the following: number of LAMP1 puncta per cell (p = 0.02, Cohen's d = 0.42), average LAMP1 puncta volume per cell, and total summed LAMP1 puncta volume per cell (p = 0.03, Cohen's d = 0.42). E, Confocal microscopy images of WT and Nhe6-/Y male primary hippocampal neurons at 14 DIV labeled with LAMP1 antibody. F, Quantification of 3D-reconstructed LAMP1 puncta at DIV 14 (WT n = 40 cells, Nhe6-/Y n = 40 cells, 4 mice per genotype, 3 litters). Graphs depict the following: number of LAMP1 puncta per cell (p = 0.01, Cohen's d = 0.58), average LAMP1 puncta volume per cell (p = 0.01, Glass's Δ = 0.69), and total summed LAMP1 puncta volume per cell. Scale bars, 5 µm. Data are mean ± SEM. Unpaired two-tailed Student's t test (A,B,F, number of LAMP1 puncta and total LAMP1 puncta volume) with Welch's correction (F, average LAMP1 puncta volume) or Mann–Whitney test (D).
Figure 7.
Figure 7.
Greater RAB7 puncta volume in NHE6-null neurons. A, RAB7 western blot and quantification in WT and Nhe6-/Y male littermate mice, acutely dissected hippocampal tissue at 8 weeks old (WT n = 11 animals, Nhe6-/Y n = 6 animals, 6 litters). B, RAB7 western blot and quantification in WT and Nhe6-/Y male primary hippocampal neurons at 14 DIV (WT n = 5 animals, Nhe6-/Y n = 5 animals, 5 litters). C, Confocal microscopy images of WT and Nhe6-/Y male primary hippocampal neurons at 5 DIV labeled with RAB7 antibody. Images are denoted as 2D (i.e., fluorescent microscopy images) and 3D (i.e., 3D reconstruction of RAB7 puncta). D, Quantification of 3D-reconstructed RAB7 puncta at DIV 5 (WT n = 50 cells, Nhe6-/Y n = 50 cells, 5 mice per genotype, 3 litters). Graphs depict the following: number of RAB7 puncta per cell, average RAB7 puncta volume per cell (p = 0.01, Cohen's d = 0.51), and total summed RAB7 puncta volume per cell (p = 0.04, Cohen's d = 0.38). E, Confocal microscopy images of WT and Nhe6-/Y male primary hippocampal neurons at 14 DIV labeled with RAB7 antibody. F, Quantification of 3D-reconstructed RAB7 puncta at DIV 14 (WT n = 40 cells from 4 mice, Nhe6-/Y n = 50 cells from 5 mice, 3 litters). Graphs depict the following: number of RAB7 puncta per cell, average RAB7 puncta volume per cell, and total summed RAB7 puncta volume per cell. Scale bars, 5 µm. Data are mean ± SEM. Unpaired two-tailed Student's t test (A,B,D, number of RAB7 puncta and average RAB7 puncta volume; F, RAB7 puncta) with Welch's correction (F, total RAB7 puncta volume) or Mann–Whitney test (D, total RAB7 puncta volume; F, average RAB7 puncta volume).
Figure 8.
Figure 8.
RAB5 features unaffected by loss of NHE6. A, RAB5 western blot and quantification in WT and Nhe6-/Y male littermate mice, acutely dissected hippocampal tissue at 8 weeks old (WT n = 9 animals, Nhe6-/Y n = 6 animals, 6 litters). B, RAB5 western blot and quantification in WT and Nhe6-/Y male primary hippocampal neurons at 14 DIV (WT n = 5 animals, Nhe6-/Y n = 5 animals, 5 litters). C, Confocal microscopy images of WT and Nhe6-/Y male primary hippocampal neurons at 5 DIV labeled with RAB5 antibody. Images are denoted as 2D (i.e., fluorescent microscopy images) and 3D (i.e., 3D reconstruction of RAB5 puncta). D, Quantification of 3D-reconstructed RAB5 puncta at DIV 5 (WT n = 50 cells, Nhe6-/Y n = 50 cells, 5 mice per genotype, 4 litters). Graphs depict the following: number of RAB5 puncta per cell, average RAB5 puncta volume per cell, and total summed RAB5 puncta volume per cell. E, Confocal microscopy images of WT and Nhe6-/Y male primary hippocampal neurons at 14 DIV labeled with RAB5 antibody. F, Quantification of 3D-reconstructed RAB5 puncta at DIV 14 (WT n = 50 cells, Nhe6-/Y n = 50 cells, 5 mice per genotype, 3 litters). Graphs depict the following: number of RAB5 puncta per cell, average RAB5 puncta volume per cell, and total summed RAB5 puncta volume per cell. Scale bars, 5 µm. Data are mean ± SEM. Unpaired two-tailed Student's t test (A,B) with Welch's correction (F, average RAB5 puncta volume and total RAB5 puncta volume) or Mann–Whitney test (D,F, number of RAB5 puncta).
Figure 9.
Figure 9.
Greater M6PR puncta volume in mature NHE6-null neurons. A, M6PR western blot and quantification in WT and Nhe6-/Y male littermate mice, acutely dissected hippocampal tissue at 8 weeks old (WT n = 11 animals, Nhe6-/Y n = 6 animals, 6 litters). B, M6PR western blot and quantification in WT and Nhe6-/Y male primary hippocampal neurons at 14 DIV (WT n = 4 animals, Nhe6-/Y n = 4 animals, 4 litters). C, Confocal microscopy images of WT and Nhe6-/Y male primary hippocampal neurons at 5 DIV labeled with M6PR antibody. Images are denoted as 2D (i.e., fluorescent microscopy images) and 3D (i.e., 3D reconstruction of M6PR puncta). D, Quantification of 3D-reconstructed M6PR puncta at DIV 5 (WT n = 50 cells, Nhe6-/Y n = 50 cells, 5 mice per genotype, 3 litters). Graphs depict the following: number of M6PR puncta per cell, average M6PR puncta volume per cell, and total summed M6PR puncta volume per cell. E, Confocal microscopy images of WT and Nhe6-/Y male primary hippocampal neurons at 14 DIV labeled with M6PR antibody. F, Quantification of 3D-reconstructed M6PR puncta at DIV 14 (WT n = 70 cells from 7 mice, Nhe6-/Y n = 80 cells from 8 mice, 6 litters). Graphs depict the following: number of M6PR puncta per cell (p = 0.05, Glass's Δ = 0.44), average M6PR puncta volume per cell, and total summed M6PR puncta volume per cell (p = 0.004, Cohen's d = 0.41). Scale bars, 5 µm. Data are mean ± SEM. Unpaired two-tailed Student's t test (A,B,D, number of M6PR puncta and total M6PR puncta volume) or Mann–Whitney test (D, average M6PR puncta volume, F).
Figure 10.
Figure 10.
Altered M6PR distribution in NHE6-null neurons in vitro. Confocal microscopy single-plane images of M6PR colocalization with different markers of the endocytic pathway in male WT and NHE6-null mouse primary hippocampal neurons at DIV 5 and 14. Colocalization of M6PR was tested using the following markers: (A) TGN46 (TGN), (C) RAB7 (late endosome), (E) LAMP1 (late endosome), and (G) RAB5 (early endosome). M6PR colocalization with these markers was quantified using the Manders' coefficient (i.e., degree M6PR signal overlaps with marker signal or M1). B, Quantification of M6PR colocalization with TGN46 at 5 DIV (WT n = 70 cells, Nhe6-/Y n = 70 cells, 7 mice per genotype, 4 litters, p = 0.01, Cohen's d = 0.43) and 14 DIV (WT n = 60 cells from 6 mice, Nhe6-/Y n = 60 cells from 6 mice, 4 litters, p = 0.009, Cohen's d = 0.50). D, Quantification of M6PR with RAB7 at 5 DIV (WT n = 50 cells, Nhe6-/Y n = 50 cells, 5 mice per genotype, 3 litters, p = 0.0008, Cohen's d = 0.71) and 14 DIV (WT n = 40 cells, Nhe6-/Y n = 40 cells, 4 mice per genotype, 3 litters, p = 0.003, Cohen's d = 0.72). F, Quantification of M6PR with LAMP1 at 5 DIV (WT n = 60 cells from 6 mice, Nhe6-/Y n = 70 cells from 7 mice, 4 litters, p = 0.03, Cohen's d = 0.40) and 14 DIV (WT n = 40 cells from 4 mice, Nhe6-/Y n = 50 cells from 5 mice, 3 litters, p < 0.0001, Cohen's d = 1.03). H, Quantification of M6PR colocalization with RAB5 at 5 DIV (WT n = 50 cells from 5 mice, Nhe6-/Y n = 60 cells from 6 mice, 4 litters, p = 0.009, Glass's Δ = 0.64) and 14 DIV (WT n = 40 cells, Nhe6-/Y n = 40 cells, 4 mice per genotype, 2 litters). Scale bars, 10 µm. Data are mean ± SEM. Unpaired two-tailed Student's t test (F, 14 DIV) or Mann–Whitney test (B,D,F, 5 DIV, H).
Figure 11.
Figure 11.
Delayed endosome-lysosome fusion in NHE6-null neurons in vitro. A, Live-cell confocal microscopy imaging of endosome-lysosome fusion in WT and Nhe6-/Y male mouse primary hippocampal neurons at 5 DIV with and without bafilomycin A treatment. The following time points were measured following incubation with AlexaFluor-647-dextran: 0, 20, 40, 60, 80, 100, and 120 min. B, Quantification of endosome-lysosome fusion (WT n = 7 animals, Nhe6-/Y n = 7 animals, 5 litters). Endosome-lysosome fusion % is expressed as % fold change to time point 0 for the same animal. There was a significant interaction effect for time × genotype (F(6,72.0) = 3.432, p = 0.005). Scale bars, 5 µm. Data are mean ± SEM. Linear mixed model.
Figure 12.
Figure 12.
Loss of NHE6 increases MVB fusion with the PM and exosome secretion. A, Representative TIRF image depicting MVB-PM fusion and exosome release as developed from Verweij et al. (2018). Widefield image of neuron cotransfected with mCherry and CD63-pHluorin expression constructs. White inset, Location of MVB-PM fusion and the zoomed in panels on the right. Each panel represents the progression of a CD63-pHluorin fusion event with the PM with the number of seconds indicated below the panel. Scale bars: large, 10 µm; small, 1 µm. B, Quantification of full MVB-PM fusion/exosome release events per cell over 5 min in WT and Nhe6-/Y male littermate mouse primary hippocampal neurons at 14 DIV (WT n = 28 cells from 7 mice, Nhe6-/Y n = 18 cells from 7 mice, 5 litters, p = 0.009, Glass's Δ = 2.27). C, Quantification of full MVB-PM fusion/exosome release events per cell over 5 min in WT and Nhe6-/Y male mouse primary hippocampal neurons at 14 DIV under the following conditions: untreated (same as in B), U18666A (positive control) (WT n = 14 cells from 5 mice, Nhe6-/Y n = 14 cells from 5 mice, 3 litters), bafilomycin A1 (positive control) (WT n = 14 cells from 7 mice, Nhe6-/Y n = 16 cells from 6 mice, 4 litters, Kruskal–Wallis test with Dunn's test: WT untreated compared with WT bafilomycin A1 p = 0.002, Glass's Δ = 3.04). D, E, CD63 western blot (D) and quantification (E) in WT and Nhe6-/Y male littermate mouse primary hippocampal neurons at 14 DIV (WT n = 5 cultures, Nhe6-/Y n = 5 cultures, 5 litters, p = 0.02, Glass's Δ = 1.68). F, Released β-Hex enzyme activity following short-term incubation in Tyrode's solution followed by treatment with either ionomycin or DMSO (WT n = 9, Nhe6-/Y n = 9, 8 litters). G, Released CatD enzyme activity following short-term incubation in Tyrode's solution followed by treatment with either ionomycin or DMSO (WT n = 6, Nhe6-/Y n = 6, 5 litters). H, Released LDH activity across all β-Hex (WT n = 5, Nhe6-/Y n = 5, 5 litters) and CatD (WT n = 4, Nhe6-/Y n = 4, 3 litters) experiments. Data are mean ± SEM. Unpaired two-tailed Student's t test (C, WT-Nhe6-/Y: bafilomycin A1) with Welch's correction (E), Mann–Whitney test (B,C, WT-Nhe6-/Y: U18666A), Kruskal–Wallis test with Dunn's test (C, differences between treatments by genotype), two-way ANOVA with Tukey's multiple comparisons test (F,G,H).
Figure 13.
Figure 13.
NHE6-null endolysosomal model in neurons. A, Schematic representation of endosomal maturation and trafficking in WT neurons. Newly synthesized CatD enzymes are trafficked through the endocytic pathway by M6PRs until they reach the highly acidic lysosome lumen to assist in degradation, ensuring proper lysosome functioning. B, Loss of NHE6 leads to overacidification of both the endosomal and lysosomal lumen that ultimately results in lysosome dysfunction. CatD becomes prematurely active in hyperacidified endosomal compartments yet is less likely to be trafficked and active in lysosomes, likely due in part to impaired endosome-lysosome fusion. Trafficking of M6PRs, which are responsible for delivering newly synthesized CatD to lysosomes, is also disrupted as they accumulate in endosomes and are unable to be transported back to the TGN. Endolysosomal trafficking is further altered as MVBs are more likely to fuse with the PM, resulting in enhanced exosome release.

References

    1. Alvarez-Erviti L, Seow Y, Schapira AH, Gardiner C, Sargent IL, Wood MJ, Cooper JM (2011) Lysosomal dysfunction increases exosome-mediated alpha-synuclein release and transmission. Neurobiol Dis 42:360–367. 10.1016/j.nbd.2011.01.029 - DOI - PMC - PubMed
    1. Andrews NW (2000) Regulated secretion of conventional lysosomes. Trends Cell Biol 10:316–321. 10.1016/s0962-8924(00)01794-3 - DOI - PubMed
    1. Arighi CN, Hartnell LM, Aguilar RC, Haft CR, Bonifacino JS (2004) Role of the mammalian retromer in sorting of the cation-independent mannose 6-phosphate receptor. J Cell Biol 165:123–133. 10.1083/jcb.200312055 - DOI - PMC - PubMed
    1. Bagh MB, Peng S, Chandra G, Zhang Z, Singh SP, Pattabiraman N, Liu A, Mukherjee AB (2017) Misrouting of v-ATPase subunit V0a1 dysregulates lysosomal acidification in a neurodegenerative lysosomal storage disease model. Nat Commun 8:14612. 10.1038/ncomms14612 - DOI - PMC - PubMed
    1. Ballabio A, Bonifacino JS (2020) Lysosomes as dynamic regulators of cell and organismal homeostasis. Nat Rev Mol Cell Biol 21:101–118. 10.1038/s41580-019-0185-4 - DOI - PubMed

Publication types

MeSH terms

Supplementary concepts