. 2021 Sep 15;12(1):5413.
doi: 10.1038/s41467-021-25516-4.

Blue food demand across geographic and temporal scales

Affiliations

Blue food demand across geographic and temporal scales

Rosamond L Naylor et al. Nat Commun. .

Erratum in

  • Author Correction: Blue food demand across geographic and temporal scales.
    Naylor RL, Kishore A, Sumaila UR, Issifu I, Hunter BP, Belton B, Bush SR, Cao L, Gelcich S, Gephart JA, Golden CD, Jonell M, Koehn JZ, Little DC, Thilsted SH, Tigchelaar M, Crona B. Naylor RL, et al. Nat Commun. 2021 Sep 28;12(1):5799. doi: 10.1038/s41467-021-26063-8. Nat Commun. 2021. PMID: 34584099 Free PMC article. No abstract available.

Abstract

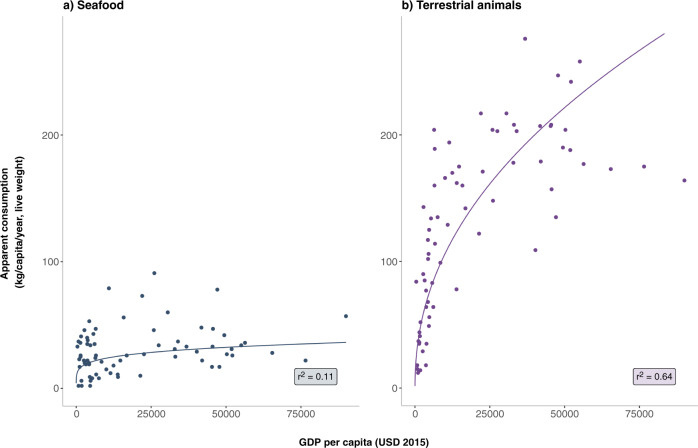
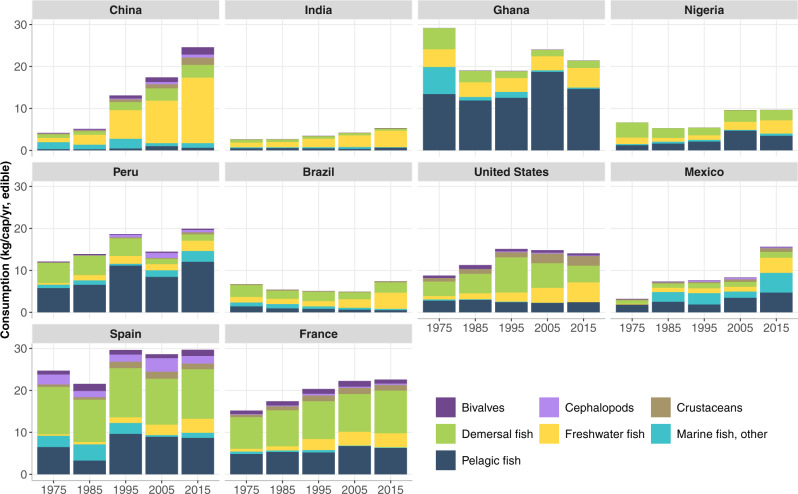
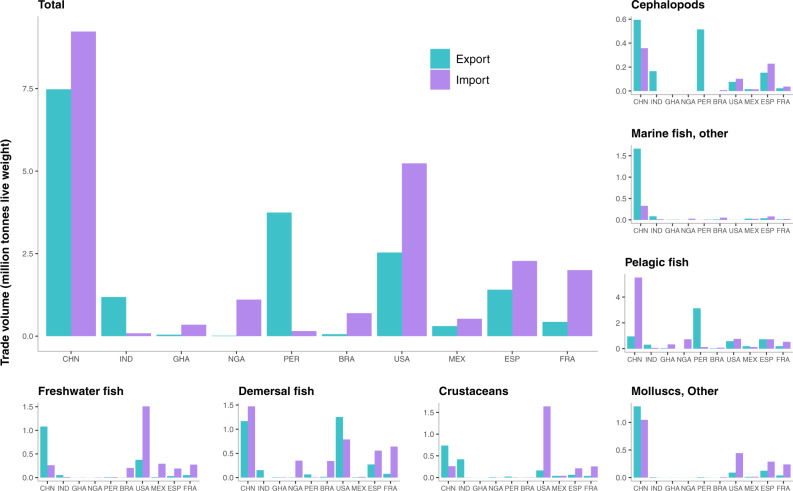
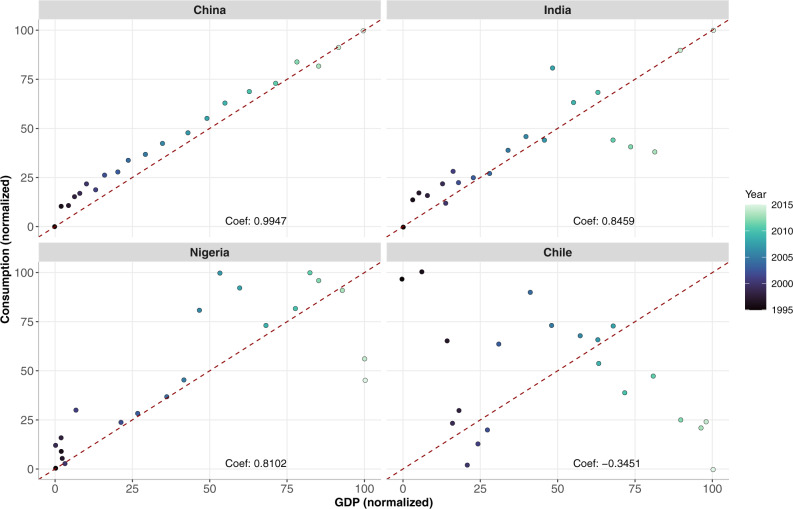
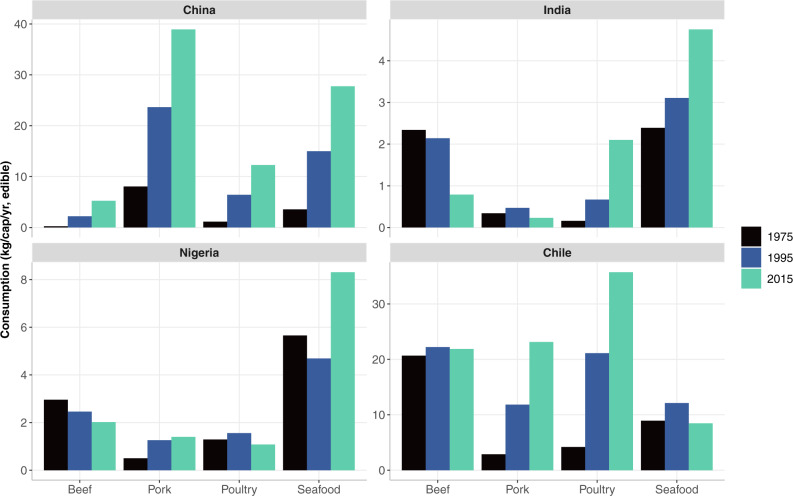
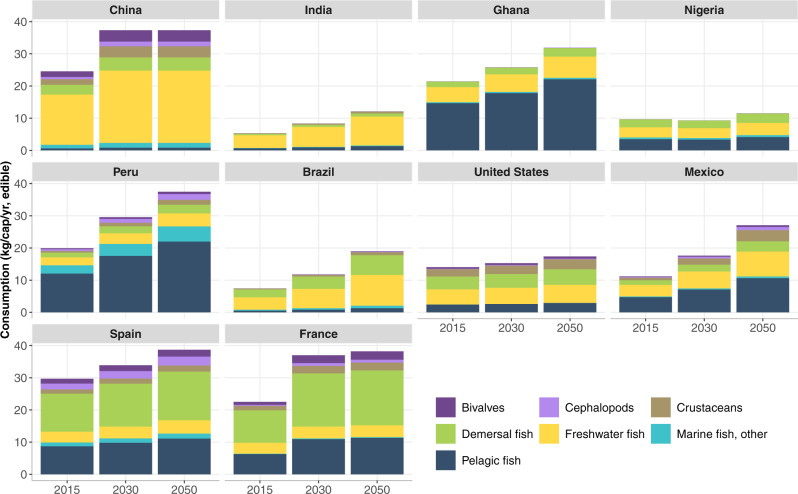
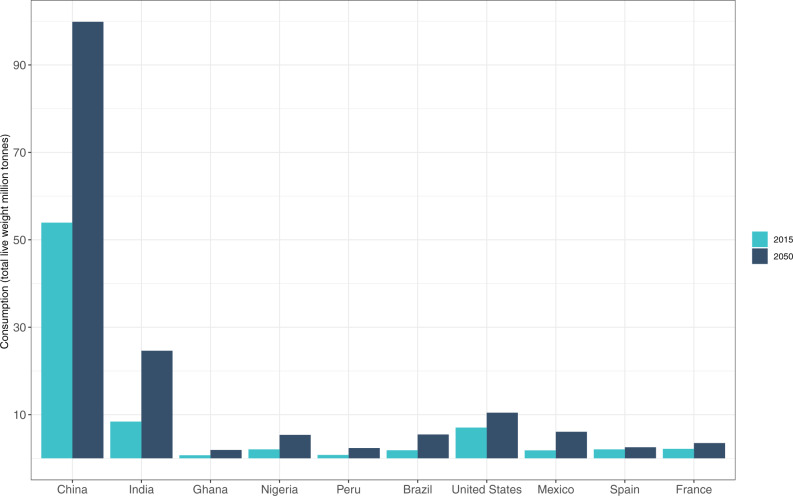
Numerous studies have focused on the need to expand production of 'blue foods', defined as aquatic foods captured or cultivated in marine and freshwater systems, to meet rising population- and income-driven demand. Here we analyze the roles of economic, demographic, and geographic factors and preferences in shaping blue food demand, using secondary data from FAO and The World Bank, parameters from published models, and case studies at national to sub-national scales. Our results show a weak cross-sectional relationship between per capita income and consumption globally when using an aggregate fish metric. Disaggregation by fish species group reveals distinct geographic patterns; for example, high consumption of freshwater fish in China and pelagic fish in Ghana and Peru where these fish are widely available, affordable, and traditionally eaten. We project a near doubling of global fish demand by mid-century assuming continued growth in aquaculture production and constant real prices for fish. Our study concludes that nutritional and environmental consequences of rising demand will depend on substitution among fish groups and other animal source foods in national diets.


Conflict of interest statement

R.L.N. is a member of the Forest Protection Advisory Panel at Cargill, and the Center on Food Security and the Environment has received funding from the Cargill Foundation for visiting scholars and staff support, but not for research. D.C.L. has received in kind and financial support from a wide range of commercial and non-commercial entities, serves as a committee member for standards organizations and is a director of a commercial tilapia hatchery in Thailand. B.C. has contributed, without direct funding, to the development of sustainability strategies of dominant companies in the seafood industry through SeaBOS. R.L.N., C.D.G., and J.A.G. are members of the scientific advisory board for Oceana. All other authors claim no conflict of interest.

Figures

Fig. 1
Fig. 1. Role of income in global seafood and meat consumption.
Relationship between apparent consumption (live weight) and GDP per capita for seafood (dark blue dots) and terrestrial animals (purple dots). Line of best fit modeled as y = axb. a Per capita fish consumption (yfish) as a function of per capita GDP (x) (yfish = 4.11x0.19; r2 = 0.11; r = 0.33). b Per capita terrestrial animal consumption (yanimal) as a function of GDP per capita (x) (yanimal = 1.56x0.46; r2 = 0.64; r = 0.80). The relationship between per capita consumption and GDP per capita is significantly weaker for fish than for terrestrial meat. Countries with very high per capita consumption of fish (>50 kg/cap/year, live weight) include French Polynesia, Maldives, Fiji, Antigua & Barbuda, Iceland, Malaysia, Barbados, Lithuania, Spain, South Korea, Portugal, and Norway. Data represent 2015 values for 72 countries with GDP and population data from The World Bank (https://data.worldbank.org/) and apparent consumption from FAOSTAT.
Fig. 2
Fig. 2. Global meat and fish consumption in edible weight from 1961 to 2017.
a Per capita animal consumption by type. Annual per capita consumption of poultry increased five-fold from ~3 kg to 15 kg, while that of seafood more than doubled from ~7 kg to nearly 16 kg. Global annual per capita consumption of beef has declined since the mid-1970s. In 2017, in absolute terms, per capita seafood and poultry meat consumption converged and pork consumption leveled off. b Normalized global per capita animal consumption by type from 1961 to 2017, pegged to 1961. Annual growth rates of poultry meat, seafood, pork, and beef during this period were 3.4%, 1.6%, 1.4%, and −0.08% respectively. Data Source: FAOSTAT.
Fig. 3
Fig. 3. Per capita apparent fish consumption by region and species group (kg/cap/year, edible weight) in 2015.
Numbers in parentheses above the bars represent the share of global consumption. Asia, Europe, and Oceania demonstrate a high level of edible fish consumption per capita in relation to the global average (14.6 kg/cap/year, edible). Fish consumption in North America is close to the global average, whereas Africa and South America are significantly below the global per capita average. Data Source: FAOSTAT.
Fig. 4
Fig. 4. Per capita fish consumption by region for selected species groups (kg/cap/year, edible weight) from 1975 to 2015.
Asia (China and India): Widespread consumption of freshwater fish, but China is also a large global consumer of bivalves, crustaceans, and demersal fish. Africa (Ghana and Nigeria): High consumption of small pelagic fish and freshwater species. South America (Peru and Brazil): All categories of fish species consumed, with high consumption of pelagic fish in Peru. Europe (Spain and France): Wide mix of fish groups consumed, with strong preference for demersal fish, followed by pelagic and freshwater fish and bivalves. North America (USA and Mexico): All categories of fish species consumed with high consumption of crustaceans in the USA relative to most other countries in the regional analysis. Each continent represented in the figure accounts for 5% or more of global consumption as indicated in Fig. 3 and thus exclude Oceania, which accounts for only 1% of global consumption Data Source: FAOSTAT.
Fig. 5
Fig. 5. International fish trade in 2015.
Data show fish and fishery product for seven species groups and their sum (in million tonnes, live weight) for 10 countries in our regional comparison set. Note that the displayed data includes fishery product trade not destined for human consumption, leading to particularly high exports of pelagic fish from Peru and imports of pelagic fish by China. Data Source: FAO Food Balance Sheets.
Fig. 6
Fig. 6. Per capita fish consumption relative to GDP per capita for four case study countries from 1995 to 2015.
The case study countries include China, India, Nigeria, and Chile. Both GDP per capita and per capita apparent fish consumption were normalized between 0 and 100 for comparability across countries. Each year is represented by a blue dot. China shows a strong positive correlation between consumption per capita and GDP per capita (r = 0.99); India and Nigeria show a moderately high positive correlation between fish consumption per capita and GDP per capita (r = 0.85 and 0.81, respectively), with greater variation at mid to high income levels; Chile shows a negative correlation between consumption per capita and GDP per capita (r = −0.35), with fish consumption falling as income rises. Data Source: FAOSTAT.
Fig. 7
Fig. 7. Per capita meat and seafood consumption for four case study countries in 1975, 1995, and 2015.
Meat is disaggregated by beef, poultry, and pork. Seafood includes all freshwater and marine species of finfish, crustaceans, cephalopods, and bivalves in edible weight with conversion from live-to-edible based on conversion factors reported in the “Methods” section. Note the differences in scales along the y-axes, indicating that India and Nigeria consume significantly less seafood and meat on a per capita basis than China and Chile. Seafood consumption per capita has risen in all locations except for Chile, where terrestrial meat consumption (particularly poultry and pork) has increased significantly. China has higher consumption per capita of pork than seafood. Data source: FAOSTAT.
Fig. 8
Fig. 8. Per capita fish consumption by species groups in the 10 countries in our regional comparison set (kg/year, edible weight), 2015–2050.
Future consumption is based on projected growth in population, income per capita, and income elasticities of demand by species group (see “Methods”; Supplementary Table 4). Asia: Freshwater fish and overall consumption continue to grow across all countries, but per capita consumption remains relatively low in India. Africa: Pelagic fish continue to play an important role in fish-consuming countries. Nigeria’s slow recovery from an economic recession in 2016 and COVID dampen predicted consumption. South America: Pelagic fish consumption dominates in Peru, whereas Brazil mainly consumes freshwater and demersal species with lower consumption per capita. North America: Per capita fish consumption is varied by species and is predicted to remain at moderate levels in the USA and show more significant growth in Mexico. Europe: Fish consumption in Spain and France is highly varied and remains relatively stable at the current high consumption rate. Data on fish consumption per capita in 2015 are taken from FAO Food Balance Sheets.
Fig. 9
Fig. 9. Total fish demand for human consumption (million tonnes, live weight) for the 10 countries in our regional dataset in 2015 (light blue) and 2050 (dark blue).
2050 projections are based on estimates for population and income growth and income elasticities of demand for the 7 species groups in our regional analysis (see “Methods”; Supplementary Table 4). China remains the largest fish consumer and is expected to account for over half of the growth in total fish consumption within this set by 2050. Total live-weight fish demand is also projected to double in India, Nigeria, Brazil, and Mexico by 2050. Data source: FAO Food Balance Sheets (2020).

References

    1. Dey MM, et al. Demand for fish in Asia: a cross-country analysis. Aust. J. Agric. Resour. Econ. 2008;52:321–338.
    1. Muhammad, A., Seale, J. L., Meade, B. & Regmi, A. International evidence on food consumption patterns: an update using 2005 International Comparison Program Data. Report No. 1929, USDA-ERS Technical Bulletin (2011).
    1. Cai, J. & Leung, P. Short-term projection of global fish demand and supply gaps. Report No. 9789251098578, 114–114 (2017)..
    1. Chen, O. L. In Predicting Future Oceans 241–248 (Elsevier, 2019).
    1. Fish to 2030: Prospects for fisheries and aquaculture. Report No. 83177-GLB (The World Bank, Washington, D.C., 2013).

Publication types