. 2021 Sep 15;11(1):18322.
doi: 10.1038/s41598-021-97834-y.

Acute regional changes in myocardial strain may predict ventricular remodelling after myocardial infarction in a large animal model

Affiliations

Acute regional changes in myocardial strain may predict ventricular remodelling after myocardial infarction in a large animal model

D S Mansell et al. Sci Rep. .

Abstract

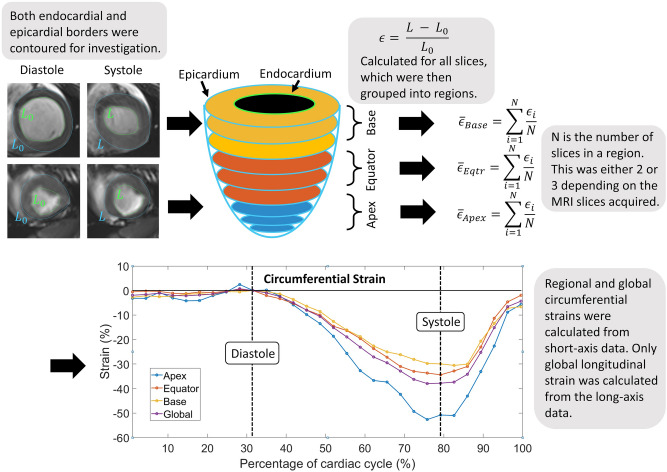
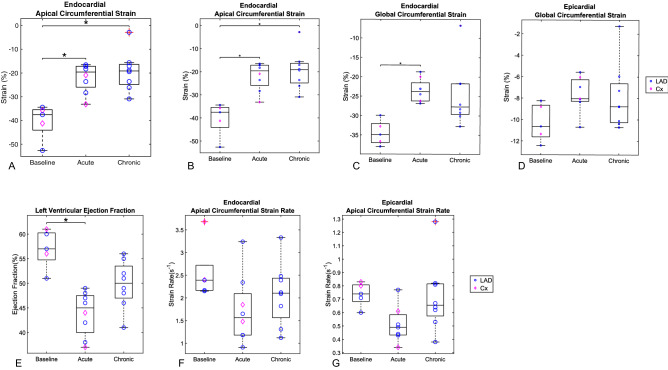
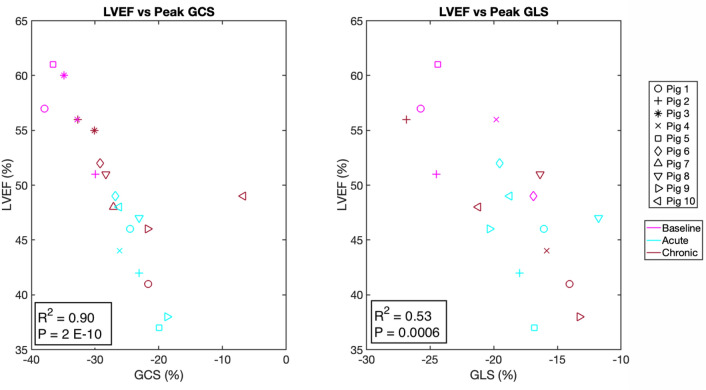
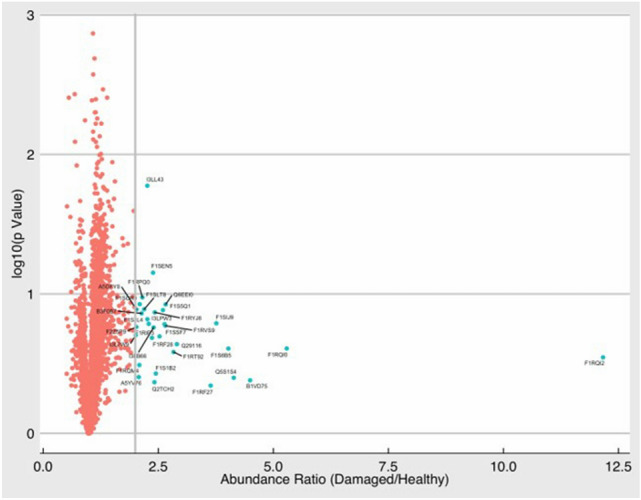
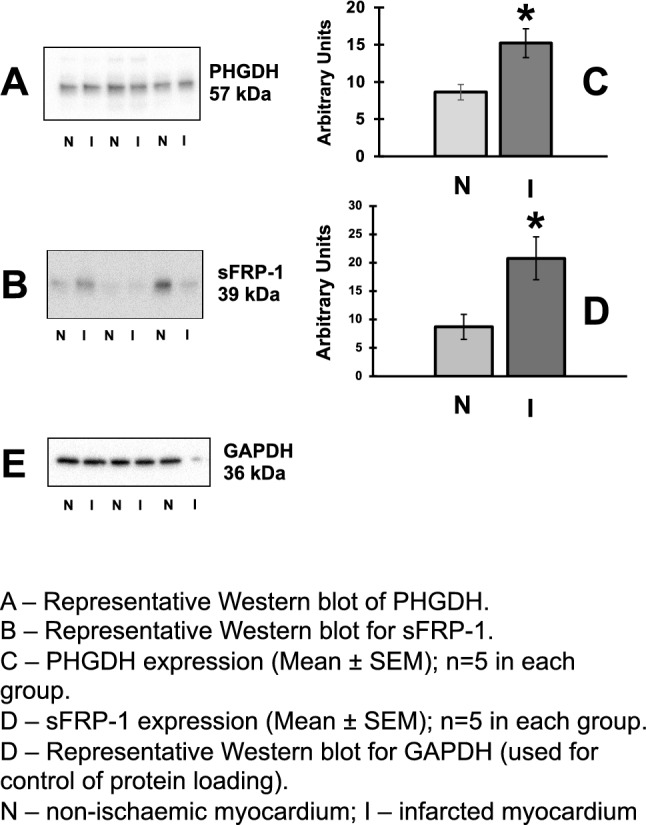
To identify predictors of left ventricular remodelling (LVR) post-myocardial infarction (MI) and related molecular signatures, a porcine model of closed-chest balloon MI was used along with serial cardiac magnetic resonance imaging (CMRI) up to 5-6 weeks post-MI. Changes in myocardial strain and strain rates were derived from CMRI data. Tissue proteomics was compared between infarcted and non-infarcted territories. Peak values of left ventricular (LV) apical circumferential strain (ACS) changed over time together with peak global circumferential strain (GCS) while peak GLS epicardial strains or strain rates did not change over time. Early LVR post-MI enhanced abundance of 39 proteins in infarcted LV territories, 21 of which correlated with LV equatorial circumferential strain rate. The strongest associations were observed for D-3-phosphoglycerate dehydrogenase (D-3PGDH), cysteine and glycine-rich protein-2, and secreted frizzled-related protein 1 (sFRP1). This study shows that early changes in regional peak ACS persist at 5-6 weeks post-MI, when early LVR is observed along with increased tissue levels of D-3PGDH and sFRP1. More studies are needed to ascertain if the observed increase in tissue levels of D-3PGDH and sFRP1 might be casually involved in the pathogenesis of adverse LV remodelling.


Conflict of interest statement

The authors declare no competing interests.

Figures

Figure 1
Figure 1
Depiction of workflow from imaging to derived final strains. Short-axis CMRIs with endocardial (green) and epicardial (blue) borders were traced, stacked and grouped into three regions: base, equator/mid, and apex. Strain was calculated for all slices, and the mean was then found by averaging strains in their regions. Finally, the resultant regional and global circumferential strains were found for each time point.
Figure 2
Figure 2
Representative longitudinal CMRI imaging of failing Left Ventricle. From left to right showing CMRI images from the same animal at baseline (A), acute (B) and chronic (C) time-points. Large images show stills of cinematic imaging in 3-chamber view orientation at end diastole demonstrating progressive thinning of the mid to apical antero-septal wall (orange arrows). Inset images show corresponding late gadolinium enhancement imaging demonstrating full thickness late gadolinium enhancement (red arrows).
Figure 3
Figure 3
(A-D) Overtime changes in apical and global circumferential strains. (A) Endocardial apical circumferential strain (ACS); (B) Epicardial apical circumferential strain (ACS); (C) Endocardial global circumferential strain (GCS); (D) Epicardial global circumferential strain (GCS). The two data points at the chronic time point with a red cross (in endocardial ACS and GCS) represent outliers greater than the third quartile plus 1.5 times the interquartile range. (EG): Overtime changes in LVEF, endocardial and epicardial ACS rates. (E) Left Ventricular Ejection Fraction (LVEF); (F) Endocardial apical circumferential strain (ACS) rates; (G) Epicardial ACS rates. The asterisk denotes changes considered significant with p < 0.0024. Statistical test: Mann–Whitney (* = identifies significant difference)”.
Figure 4
Figure 4
Correlation between endocardial GCS and GLS with LVEF. Scatterplot between endocardial GCS and LVEF (A) and between endocardial GLS and LVEF (B). Each individual porcine specimen is denoted by a different marker and three different line colours are used to indicate the experimental time point of baseline, acute, and chronic.
Figure 5
Figure 5
Volcano plot representation of proteomics. Abundance ratios for changes in each protein are shown as log10 of p value of infarcted/health segments within the same hearts (n = 5) (R Software version 3.4.4, R Foundation for Statistical Computing, Vienna, Austria. URL https://www.R-project.org/).
Figure 6
Figure 6
Quantification of D-3PGDH and sFRP1 proteins by western blotting. All data presented as Mean ± SEM; n = 5 in each group. Quantification of D-3-phosphoglycerate dehydrogenase (D-3PGDH) and secreted frizzled-related protein 1 (sFRP1) in lysates of the infarcted myocardium (I) and non-infarcted myocardium (N). (A) Representative western blot of D-3PGDH; (B) Densitometric quantification of D-3PGDH; (C) Representative western blot for sFRP1; (D) Densitometric quantification of sFRP1 expression; (E) Representative western blot for anti-glyceraldehyde 3-phosphate dehydrogenase (GAPDH, used for control of protein loading); *P < 0.05 versus non-ischaemic myocardium. MW: molecular weight. Statistical Test used: Mann–Whitney. (Figure S1 shows the full blots for the proteins shown in this figure).

References

    1. Benjamin EJ, et al. Heart disease and stroke statistics—2018 update: A report from the American Heart Association. Circulation. 2018;137:E67–E492. doi: 10.1161/CIR.0000000000000558. - DOI - PubMed
    1. Cameli M, et al. Echocardiographic assessment of left ventricular systolic function: From ejection fraction to torsion. Heart Fail. Rev. 2016;21:77–94. doi: 10.1007/s10741-015-9521-8. - DOI - PubMed
    1. Altiok E, et al. Layer-specific analysis of myocardial deformation for assessment of infarct transmurality: Comparison of strain-encoded cardiovascular magnetic resonance with 2D speckle tracking echocardiography. Eur. Hear. J. Cardiovasc. Imaging. 2013;14:570–578. doi: 10.1093/ehjci/jes229. - DOI - PubMed
    1. Chan J, et al. Differentiation of subendocardial and transmural infarction using two-dimensional strain rate imaging to assess short-axis and long-axis myocardial function. J. Am. Coll. Cardiol. 2006;48:2026–2033. doi: 10.1016/j.jacc.2006.07.050. - DOI - PubMed
    1. Pedrizzetti G, Claus P, Kilner PJ, Nagel E. Principles of cardiovascular magnetic resonance feature tracking and echocardiographic speckle tracking for informed clinical use. J. Cardiovasc. Magn. Reson. 2016;18:51. doi: 10.1186/s12968-016-0269-7. - DOI - PMC - PubMed

Publication types

MeSH terms