. 2021 Sep 15;4(1):135.
doi: 10.1038/s41746-021-00510-8.

A deep transfer learning approach for wearable sleep stage classification with photoplethysmography

Affiliations

A deep transfer learning approach for wearable sleep stage classification with photoplethysmography

Mustafa Radha et al. NPJ Digit Med. .

Abstract

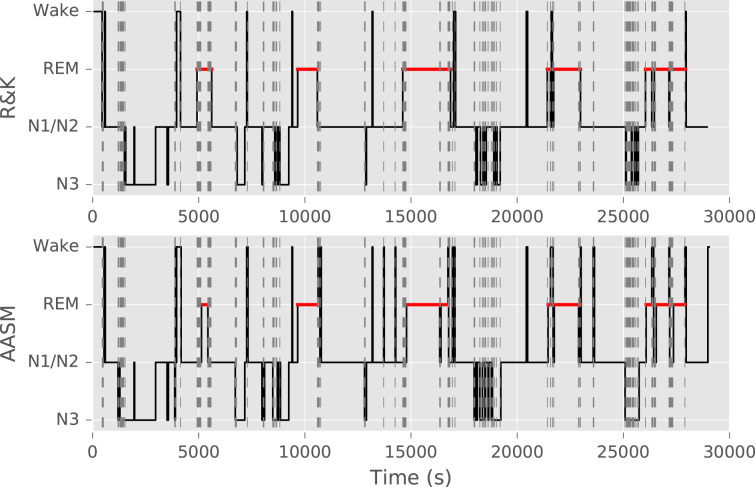
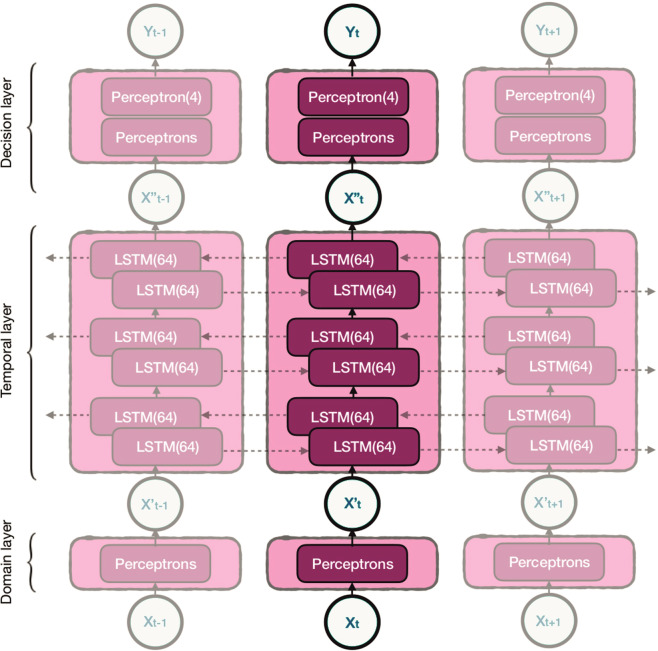
Unobtrusive home sleep monitoring using wrist-worn wearable photoplethysmography (PPG) could open the way for better sleep disorder screening and health monitoring. However, PPG is rarely included in large sleep studies with gold-standard sleep annotation from polysomnography. Therefore, training data-intensive state-of-the-art deep neural networks is challenging. In this work a deep recurrent neural network is first trained using a large sleep data set with electrocardiogram (ECG) data (292 participants, 584 recordings) to perform 4-class sleep stage classification (wake, rapid-eye-movement, N1/N2, and N3). A small part of its weights is adapted to a smaller, newer PPG data set (60 healthy participants, 101 recordings) through three variations of transfer learning. Best results (Cohen's kappa of 0.65 ± 0.11, accuracy of 76.36 ± 7.57%) were achieved with the domain and decision combined transfer learning strategy, significantly outperforming the PPG-trained and ECG-trained baselines. This performance for PPG-based 4-class sleep stage classification is unprecedented in literature, bringing home sleep stage monitoring closer to clinical use. The work demonstrates the merit of transfer learning in developing reliable methods for new sensor technologies by reusing similar, older non-wearable data sets. Further study should evaluate our approach in patients with sleep disorders such as insomnia and sleep apnoea.


Conflict of interest statement

At the time of writing, all authors were employed and/or affiliated with Royal Philips, a commercial company and manufacturer of consumer and medical electronic devices, commercializing products in the area of sleep diagnostics and sleep therapy.

Figures

Fig. 1
Fig. 1. Sleep hypnogram from the Siesta database simultaneously annotated according to R&K and AASM annotation standards.
Due to differences in annotation rules, a total of 59 min of this night were differently annotated (differences highlighted with vertical grey stripes). Note that some changes may also be related to inter-rater disagreement. For ease of visual comparison, instead of presenting full hypnograms, this figure shows only 4-class hypnograms (Wake, REM sleep, N1/N2 sleep, and N3 sleep), which is also the objective of automatic sleep stage classification in this study.
Fig. 2
Fig. 2. Transfer learning.
The source model (ECG model) is trained using ECG data and PSG based labels scored according to the R&K rules (Siesta data set in this work) and then its knowledge is transferred to learn a new task, involving PPG input data and PSG annotation according to the AASM rules (Eindhoven data set in this work), resulting in the PPG model.
Fig. 3
Fig. 3. Overview of the validation scheme.
The top horizontal lane describes operations done using the Siesta data while the bottom lane describes the validations on the Eindhoven data. Square boxes describe model training operations, rounded black boxes describe endpoints that are statistically compared to confirm the hypothesis of this work, and the rounded grey box denotes the trained ECG model, which is used either as a pre-trained model or adapted via knowledge transfer for PPG-based sleep stage classification as indicated by the arrows flowing out of it. CV means cross-validation across participants.
Fig. 4
Fig. 4. Discrepancy between ECG- and PPG-derived HRV features.
a Inter-beat interval. A sequence of inter-beat intervals as recorded by ECG (blue, RR-interval, RRI) and PPG (red, peak-to-peak interval, PPI). Pulse arrival time (PAT) is also shown. b Distribution of correlations between ECG-derived and PPG-derived HRV features. The features were obtained from ECG and PPG signals simultaneously recorded in the Eindhoven data set. The detailed description of the features can be found in Supplementary Table 1. c Bland-Altman density plots of example features with low correlation. From left to right, the features are the slope of network degree distribution using a visibility graph method, the mean of inter-beat-interval series amplitudes (after empirical mode decomposition), and the standard deviation of inter-beat-interval series amplitudes at transition points detected based on a Teager energy method, with a correlation coefficient of 0.069, 0.264, and 0.308, respectively. d Bland-Altman density plots of example features with high correlation. From left to right, the features are the 75th percentile of inter-beat intervals, the 10th percentile of heart rates, and the 50th percentile of inter-beat intervals, with a correlation coefficient of 0.997, 0.995, and 0.994, respectively. AVG and DIFF indicate the mean and the difference between ECG and PPG feature values, respectively.
Fig. 5
Fig. 5. Comparison of sleep stage classification performance.
a Evaluation of different model training strategies on the Eindhoven PPG data set. Distributions of participants in the data set are shown using letter value plots, in which box sizes are proportional to the number of participants in the box range. Performance reported in Cohen’s kappa and accuracy. b Comparison of the combined retrain transfer learning strategy with the two non-transfer baselines for each sleep stage, presented in F1 score. The same letter value plots and statistical testing annotation are used. Statistical comparisons between different models have been performed using Wilcoxon’s signed rank test (two-sided). Stars denote p-value of the test, where *, **, ***, and **** denote p < 0.05, p < 0.01, p < 0.001, and p < 0.0001, and “NS” denotes “not significant” or p > 0.05.
Fig. 6
Fig. 6. Bland-Altman analysis of the four main sleep-wake statistics, between reference and the combined retrain transfer learning approach.
AVG on the horizontal axis is the mean between true and predicted values and DIFF on the vertical axis is the error (predicted value–true value).
Fig. 7
Fig. 7. A partially rolled-out overview of the neural network architecture to visualise the temporal interaction.
The dotted arrows indicate the flow direction of temporal information through LSTM connections.

References

    1. Patel SR, Hu FB. Short sleep duration and weight gain: a systematic review. Obesity. 2008;16:643–653. doi: 10.1038/oby.2007.118. - DOI - PMC - PubMed
    1. Irwin MR, Olmstead R, Carroll JE. Sleep disturbance, sleep duration, and inflammation: a systematic review and meta-analysis of cohort studies and experimental sleep deprivation. Biol. Psychiatry. 2016;80:40–52. doi: 10.1016/j.biopsych.2015.05.014. - DOI - PMC - PubMed
    1. Spiegel K, Tasali E, Leproult R, Van Cauter E. Effects of poor and short sleep on glucose metabolism and obesity risk. Nat. Rev. Endocrinol. 2009;5:253–261. doi: 10.1038/nrendo.2009.23. - DOI - PMC - PubMed
    1. Czeisler CA, et al. Sleep-deprived motor vehicle operators are unfit to drive: a multidisciplinary expert consensus statement on drowsy driving. Sleep. Heal. 2016;2:94–99. doi: 10.1016/j.sleh.2016.04.003. - DOI - PubMed
    1. Perez-Pozuelo I, et al. The future of sleep health: a data-driven revolution in sleep science and medicine. npj Digital Med. 2020;3:42. doi: 10.1038/s41746-020-0244-4. - DOI - PMC - PubMed