. 2021 Sep;597(7878):726-731.
doi: 10.1038/s41586-021-03903-7. Epub 2021 Sep 15.

UTX condensation underlies its tumour-suppressive activity

Affiliations

UTX condensation underlies its tumour-suppressive activity

Bi Shi et al. Nature. 2021 Sep.

Abstract

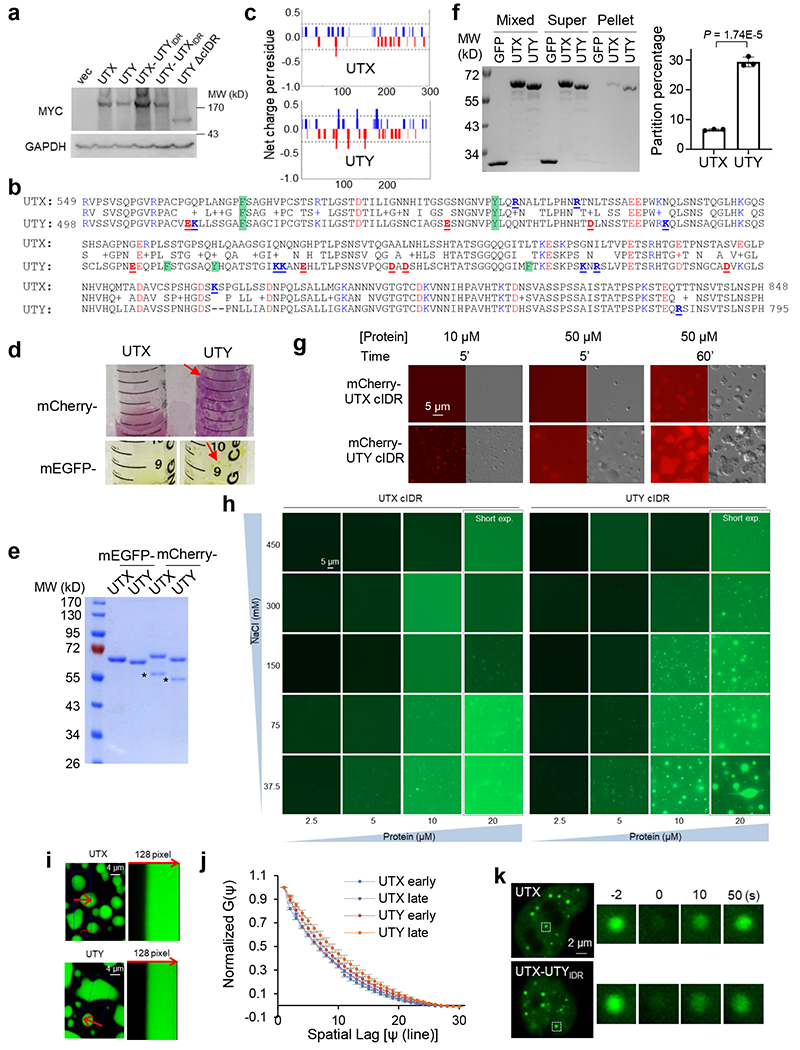
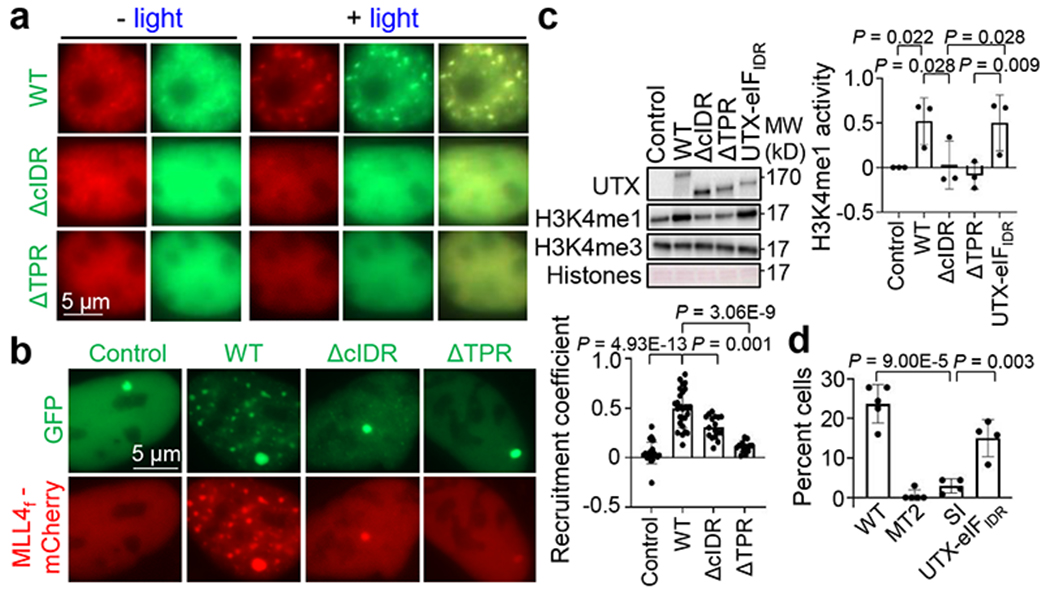
UTX (also known as KDM6A) encodes a histone H3K27 demethylase and is an important tumour suppressor that is frequently mutated in human cancers1. However, as the demethylase activity of UTX is often dispensable for mediating tumour suppression and developmental regulation2-8, the underlying molecular activity of UTX remains unknown. Here we show that phase separation of UTX underlies its chromatin-regulatory activity in tumour suppression. A core intrinsically disordered region (cIDR) of UTX forms phase-separated liquid condensates, and cIDR loss caused by the most frequent cancer mutation of UTX is mainly responsible for abolishing tumour suppression. Deletion, mutagenesis and replacement assays of the intrinsically disordered region demonstrate a critical role of UTX condensation in tumour suppression and embryonic stem cell differentiation. As shown by reconstitution in vitro and engineered systems in cells, UTX recruits the histone methyltransferase MLL4 (also known as KMT2D) to the same condensates and enriches the H3K4 methylation activity of MLL4. Moreover, UTX regulates genome-wide histone modifications and high-order chromatin interactions in a condensation-dependent manner. We also found that UTY, the Y chromosome homologue of UTX with weaker tumour-suppressive activity, forms condensates with reduced molecular dynamics. These studies demonstrate a crucial biological function of liquid condensates with proper material states in enabling the tumour-suppressive activity of a chromatin regulator.


Conflict of interest statement

Competing interests

The authors declare no competing interests.

Figures

Extended Data Figure 1.
Extended Data Figure 1.. UTX undergoes cIDR-dependent phase separation
a. Relative expression of UTX 555* mutant in 10 cancer patient samples that harbor this mutation and for which the mRNA level data are available. From cBioportal. Each bar is a patient sample. z-score indicates the number of standard deviations away from the mean of expression in the reference. It shows that 3 samples showed increase in mRNA level, and 4 samples showed reduction within 1 standard deviation of expression in reference samples, suggesting that this nonsense mutation does not usually lead to transcript decay and should express a truncated UTX (1-554) b. Top, a schematic of the full-length UTX. Bottom, a plot for number of non-synonymous mutations (type indicated in legend) within each 100 amino acids-long region on UTX, from 394 patients in TCGA. The plot is aligned with the top schematic c. Top, a schematic showing division of the full-length UTX into 5 regions that were individually purified as fusion with Maltose-binding protein (MBP, to enhance solubility). See Constructs in Methods for rationale for region division. Bottom, phase contrast images of 50 μM MBP-UTX fragments corresponding to each indicated UTX region in 30 mM NaCl after treatment with TEV protease for 1 hr to remove the MBP tag d. Coomassie blue staining image of purified EGFP and EGFP-cIDR e. Fluorescence (left) and DIC (right) microscopy images of 30 μM EGFP-cIDR at increasing concentrations of NaCl at indicated times after dilution in the condensation buffer. Note the increase of droplet size and the occasional appearance of irregular shape at 45 min, suggesting growth and aging phenomena that are typical for phase separation f. Fluorescence (left) and DIC (right) images showing wetting of 30 μM EGFP-cIDR at the surface of the coverslip immediately after dilution. g. Coomassie blue staining image of purified EGFP-UTX (419-848) h. Fluorescence (up) and DIC (bottom) images of EGFP-UTX (419-848) at indicated concentrations i. Coomassie blue staining image of purified mEGFP and mEGFP-UTX (419-848) j. Fluorescence (up) and DIC (bottom) images of mEGFP and mEGFP-UTX (419-848) at indicated concentrations and time points after dilution in condensation buffer. k. Coomassie blue staining image of purified mCherry and mCherry-UTX (419-848). Note that, throughout this manuscript, a band of unknown identity, indicated by the asterisk, always appeared at ~15kD smaller than the purified mCherry or mCherry-tagged protein of interest, regardless of the identity of the protein of interest. We thus speculate that it is either a degradation product of mCherry or an unrelated protein tightly associated with mCherry l. Fluorescence (up) and DIC (bottom) images of 40 μM mCherry and mCherry-UTX (419-848) at indicated time points after dilution m. Immunoblotting by indicated antibody of total lysates from untransfected control or 293T cells transfected with indicated constructs that are fused to EGFP n. Quantification of nuclear UTX concentration by anti-UTX immunoblotting. Total lysates from indicated number of 293T and mouse ES cells were loaded, along with indicated ng of purified EGFP-UTX (1-848). We determined that the nuclear concentration of endogenous UTX to be ~153 nM in 293T cancer cells and ~383 nM in mouse ESCs o. Transfected UTX forms nuclear foci at a concentration that is on the same order of magnitude as the endogenous level. Left, immunoblotting (top, by anti-UTX antibody) and Ponceau S staining (bottom) of total lysates from untransfected control or 293T cells transfected with a very low dose of plasmid for UTX-EGFP, with a transfection efficiency of ~30% as examined under microscope. Three different amounts (1:2 serial dilution) of the lysates and purified EGFP-UTX (1-848) were loaded as indicated. UTX-EGFP amount was roughly 2 times that of the endogenous UTX, and estimated to be < 1 μM in the transfected cells, assuming that the negative cell under microscope had little contribution to the UTX-EGFP immunoblotting signal. The fluorescence image of the corresponding cells is shown on the right.
Extended Data Figure 2.
Extended Data Figure 2.. UTX cIDR and the key residues in cIDR are important for forming condensates and its tumor suppressive activity.
a. Growth curves of THP-1 cells electroporated with indicated constructs, shown as mean ± SD. n = 3 independent experiments. P value is between MT2 and ΔcIDR at the last time point . b. Immunoblotting by indicated antibody of total lysates from THP-1 cells electroporated with empty vector or indicated UTX WT or mutants. c. Fluorescence and bright field images of THP-1 cells electroporated with indicated UTX constructs fused to EGFP. d. Analysis of amino acid enrichment for UTX cIDR. By Composition Profiler, using indicated background sample. e. Fluorescence images of 293T cells transfected with the corresponding UTX WT or mutants fused with EGFP. f. Immunoblotting by indicated antibody of total lysates from 293T cells transfected with empty vector or indicated UTX WT or mutants fused to EGFP. g. Immunoblotting by indicated antibody of total lysates from THP-1 cells electroporated with empty vector or indicated UTX WT or mutants. h. Representative fluorescence microscopy images of foci in FRAP assays for full-length UTX WT and HY fused to mEGFP in nuclei following transfection into 293T cells. The photobleached focus is indicated by the dashed box and its images at indicated time points are amplified. i-n all used 20 μM mEGFP, mEGFP-UTX (419-848) WT or HY as indicated. i. Pictures and OD600 plotted as mean ± SD. n = 3 independent experiments. j. Representative fluorescence microscopy and DIC images at indicated times in condensation. Scale bar, 10 μm. k. FRAP recovery curves as mean ± SD at indicated early and late times in condensation. n = 13 and 12 droplets each for WT and HY, respectively, for early times, and n = 8 and 12 droplets each for WT and HY, respectively, for late times. l-n. Line RICS assays for WT (n = 32 droplets) and HY (n = 12) over the time range of 0-100 min in condensation. l. Fluorescence Images and line carpets. m. Line RICS autocorrelation curves. n. Plot showing the mean ± SD of the diffusion coefficients. *P<0.05, ***P<0.001, and ****P<0.0001, by two-sided t-test for all.
Extended Data Figure 3.
Extended Data Figure 3.. Tumor suppressive activity of UTX can be maintained by replacing its cIDR with unrelated protein IDRs.
a. Immunoblotting by anti-UTX or GAPDH of total lysates from THP-1 cells electroporated with empty vector or indicated UTX WT or mutants. b. Immunoblotting by anti-UTX (top) or GAPDH (bottom) of total lysates from THP-1 or MiaPaca2 cells that were transduced with empty vector or indicated UTX WT or mutants and induced with doxycycline. c. Confocal images of 293T cells transfected with indicated UTX chimeric constructs all fused to EGFP. d. Growth curves of THP-1 cells electroporated with indicated vector or UTX constructs, shown as average ± SD. n = 3 independent experiments. e. Representative results of colony formation assay of THP-1 cells transduced with indicated UTX WT or mutant construct. Bottom left, the number of colonies are plotted as mean ± SD (n = 3 independent experiments). Bottom right, the size of colonies are plotted as mean ± SD. n = 100 colonies for each except 73 colonies for UTX-eIFIDR. f. Kaplan Meier Curves for survival of the animals grafted with THP-1 cells stably transduced with indicated vector or UTX constructs. P = 0.0024 for WT vs. ΔcIDR, and 0.015 for ΔcIDR vs. UTX-eIFIDR. n = 8 mice each, except n = 10 for Vector. g. Representative crystal violet staining images of MiaPaca2 cells transduced with indicated UTX WT or mutant construct. Two thousand cells were seeded and cultured for 7 days in the absence or presence of doxycycline (to induce transgene expression) before staining. Right, staining absorbance for cells with doxycycline are plotted as mean ± SD from n = 3 independent repeats. h. MiaPaca2 cells stably transduced with indicated vector or UTX constructs were grafted into immune-deficient mice. Tumors from day 20 were imaged and their weights are plotted as average ± SD. n = 5 mice each for Vector and UTX-FUS(IDR), or 6 mice each for the others. i. Immunoblotting of total lysates (Input) and anti-FLAG antibody-mediated immunoprecipitation (IP) from 293T cells transfected with empty vector, or FLAG-tagged UTX WT or ΔcIDR, using indicated antibodies. j-o. RNA-seq analysis for gene expression in the THP-1 cells transduced with indicated UTX constructs (two samples each). j. Volcano plot. Blue and red dots represent genes that were significantly (adj. P<0.05) up-or down-regulated (over 1.25 fold), respectively, by WT versus vector control. The adjusted P values on y axis were from DESeq2. The detailed gene information is in Supplementary Table 1. k. Gene ontology analysis for the indicated gene clusters from the heat map in Fig. 1j. Red plot shows the significantly enriched gene functions for the 300 genes in the red bracket in Fig. 1j, which were strongly induced by WT and UTX-eIFIDR, but not as strongly by ΔcIDR, and not affected by ΔTPR. Blue shows the significantly enriched gene functions for the 200 genes in the blue bracket in Fig. 1j, which were markedly repressed by WT and UTX-eIFIDR, but not ΔcIDR and ΔTPR. l. Principal component analysis of quantile normalized gene expression (log2 of TPM, pseudo-count=1) using 1,271 DEGs in WT versus vector control. m. Scatter plots for gene expression changes between indicated samples. Black dashed line indicates the linear fit with correlation coefficient (r) labeled. Red and blue dots are genes significantly up-or down-regulated (over 1.25 fold) in WT over vector, respectively, as in j. n. Box plots for gene expression changes between indicated samples for the up- and down-regulated genes (defined in m) in WT over vector. Data are median (horizontal line), 25–75th percentiles (box) and 1.5 times the interquartile range recorded (whiskers). P values are shown for data significantly greater or less than 0 by two-sided one sample t-test. Left, n = 675 genes each; right, n = 596 genes each. o. Heatmap showing relative expression levels of genes that were significantly (adj. P<0.05) up-or down-regulated (1.25 fold each) by WT compared to vector control in the THP-1 cells transduced with vector control, UTX WT or catalytically inactive (MT2) mutant (two samples each). Each row represents a gene. P values by one-way ANOVA followed by Tukey’s post hoc test for all analyses except by two-sided log-rank test for g, two-sided modified Fisher’s exact test for k, and two-sided one sample t-test for n.
Extended Data Figure 4.
Extended Data Figure 4.. Condensation of the endogenous Utx is important for ESC differentiation.
a. Schematic of FLAG-mEGFP Knock-in (KI) at Utx in ESCs. b. Genomic PCR products by indicated primers for different clones. The predicted sizes are 961 bp (by F1+R1) and 954 bp (by F2+R2) for the KI clones. c. Immunoblotting for KI clones by green circles (neighboring lanes are clones of mixed population). d. Schematic for generating a Utx KO ESC clone. e. Sequencing results showing the 4 bp loss in Utx in the KO clone. f. Immunoblotting for the Utx KO clone. g. Schematic for generating Utx ΔcIDR ESC clones. h. Genomic PCR products for different clones. The bottom right gel used the primer pair in yellow shown in g, with predicted size of 205 bp for ΔcIDR. The other gels used the primer pair in black in g, with predicted size of 1040 bp for ΔcIDR. i. Sequencing of the indicated ΔcIDR clones. The in-frame deleted genomic regions are shown in the square brackets. The deletion of amino acids additional to the cIDR was due to the design of the gRNAs to ensure efficient recognition of CRISPR/Cas9. These residues are all in the disordered region. A phenylalanine was also added (in red) by the repair process in clone #72 j. Immunoblotting for the Utx ΔcIDR clones. k. Schematic of FLAG-mEGFP KI at Utx in the Utx ΔcIDR ESC clones. l. Genomic PCR products for different clones using the F2 and R2 primer pair shown in a. m. Immunoblotting for mEGFP-tagged WT and UtxΔ cIDR clones. n. Representative confocal microscopic images of ESCs that did not have mEGFP KI (Negative) or had mEGFP KI in the Utx WT or ΔcIDR clones. Two different samples of ΔcIDR clone #25 that had relatively high and low mEGFP signal levels are here to show that the signal levels did not affect the fuzziness or how dispersed UTX was. o. Granularity of the mEGFP signal was plotted as mean ± SD. n = 28 Utx WT and 38 ΔcIDR cells, each containing two different clones shown in panel n. Granularity, or mEGFP signal fluctuation, was calculated as SD of the relative signal intensity of a line plot (normalized to the mean signal intensity of the entire line) at each pixel on the line through an individual cell. P value by two-sided t-test. The line plot was generated by ImageJ, and an example is shown as the yellow line on a mEGFP-ΔcIDR clone in n. p. Venn diagrams for genes that, compared to the corresponding WT EBs, were downregulated (left) or upregulated (right) by KO (cyan) or ΔcIDR (salmon, two clones) in late EBs (day 8 or 9 in differentiation). Fold changes are indicated. From RNA-seq of two 2 independent differentiation assays. P values by two-sided Fisher’s exact test. q. Significantly enriched Biological Processes in embryonic development for genes downregulated (↓) or upregulated (↑) over 2 fold by Utx KO or ΔcIDR in EBs late in differentiation, compared to the corresponding WT EBs. By Metascape. P values by two-sided hypergeometric test.
Extended Data Figure 5.
Extended Data Figure 5.. UTX co-condenses with and enhance chromatin recruitment of MLL4 and p300 in cells.
a. A schematic showing the domain compositions of MLL4, MLL4f, and MLL4C(N). b. Left, a schematic showing the optoDroplet system used for the right, which are confocal images of 293T cells expressing MLL4C(N)-mCherry-Cry2, before and after light activation. c. Left, a schematic showing the optoDroplet system used for the right, which are confocal images of 293T cells expressing UTX-mCherry-Cry2, before and after light activation. d. Left, a schematic showing the optoDroplet system used for the right, which are confocal images of 293T cells expressing both UTX (WT or indicated mutant)-mCherry-Cry2 and MLL4C(N)-EGFP, before and after light activation. e. Left, a schematic showing the LacO-array system. Middle, fluorescence microscopy images of LacO-cells transfected with EGFP-LacI (control) or UTX (WT or mutant)-EGFP-LacI, each together with p300(251-550)-mCherry. Right, recruitment coefficients of p300(251-550) relative to the LacO-bound control or UTX (WT or mutant) are determined as described in Methods and plotted as average ± SD. n = 11, 19, 17, 24 cells for control, WT, ΔcIDR, and ΔTPR, respectively. P values by one-way ANOVA followed by Tukey’s post hoc test.
Extended Data Figure 6.
Extended Data Figure 6.. Purified UTX and MLL4 or p300 regions form co-condensates through specific interaction mediated by TPR.
a. Coomassie blue staining image of purified EGFP-UTX (419-848), EGFP-UTX (1-848), and mCherry-MLL4C(N). b. Fluorescence images of purified proteins individually diluted to indicated concentrations. c. Fluorescence images of purified proteins mixed and diluted to the final concentration as indicated, equal to the concentrations in b. d. Fluorescence images of purified proteins individually diluted to indicated concentrations. e. Fluorescence images of purified proteins mixed and diluted to the final concentration equal to that of the corresponding protein in d. The exposure time for GFP in the top row was longer than those in the other two rows to adjust the GFP brightness due to the much lower concentration of the GFP-fused proteins in the top row. f. Recruitment coefficient for MLL4C(N) was determined as the relative ratio of the mCherry signal amount inside the GFP condensates over that inside the mCherry condensates, and plotted as mean ± SD. n = 3 independent fields each. Note that each field had ~100 total droplets. **P<0.01 by one-way ANOVA followed by Tukey’s post hoc test. g. Domain schematic of p300. P300 (251-550) containing ZF1 domain is labeled. h. luorescence images of purified proteins mixed to the indicated final concentrations.
Extended Data Figure 7.
Extended Data Figure 7.. UTX condensates enrich histone modification activities.
a. Schematic of the procedures to isolate the UTX (WT or ΔcIDR) and MLL4f proteins for in vitro histone methylation (HMT) and imaging analyses. Note that all HMT assays involved endogenous MLL3/4 associated with isolated UTX. b. Immunoblotting for UTX in the UTX (WT or ΔcIDR) pulldowns, along with indicated ng of purified EGFP-UTX (1-848). This allowed an estimate of the concentration of WT-GFP or ΔcIDR-GFP to be ~40 nM in the pulldowns. c. Fluorescence images of the UTX (WT or ΔcIDR) pulldowns in the condensation buffer, with ~25 nM UTX protein and 150 mM NaCl. d. Immunoblotting for the indicated proteins in the isolated UTX (WT or ΔcIDR) complexes. e. Representative results of in vitro HMT assays using the UTX (WT or ΔcIDR)-GFP pulldown. UTX and indicated histone modifications at indicated time points of HMT assay were determined by Immunoblotting. Total Histones are shown by Ponceau S staining. Right, Relative H3K4me1 increase (from time 0) is plotted as mean from 2 independent experiments. f. Representative results of in vitro HMT assays using the UTX (WT or 555*) pulldown. Top, immunoblotting by indicated antibodies and Ponceaus S staining for total histones in HMT assay. Bottom, H3K4me1 activity was determined as relative H3K4me1 increase from preexisting methylation (in control) and plotted as mean ± SD. n = 3 independent experiments. P values by two-sided t-test. g. Immunoblotting using anti-FLAG antibody for the isolated UTX (WT or ΔcIDR) complexes, MLL4f-mCherry, or their mixture as indicated. UTX (WT or ΔcIDR) and MLL4f all had FLAG tag. h. Fluorescence microscopy images of indicated protein complex, either as individual protein (top row) or mixed as indicated (bottom two rows) in the condensation buffer. The concentration of each protein in the mixture was the same as that of the corresponding individual protein shown on top row. i. Immunostaining for Myc (for Myc-tagged UTX), H3K27me3, and DAPI in COS-7 cells transfected with indicated UTX WT or mutant construct. Cells with UTX overexpression (indicated by arrows) were scored for the signal intensity of H3K27me3 and quantified in j. j. Quantification of the cells showing Decrease (↓), no change (−), or increase (↑) of H3K27me3. Shown are the percentage of cells showing the indicated changes in one out of a total of five biological repeats. In parenthesis is the number of cells showing the changes/total number of cells scored. In each repeat, around 100 cells were scored for each sample.
Extended Data Figure 8.
Extended Data Figure 8.. UTX condensates regulate genomic histone modifications and enhancer transcription.
a. A Venn diagram for genomic sites bound by UTX WT and ΔcIDR. The overlap number refers to the number of WT peaks that overlapped with ΔcIDR peaks. b. Genomic features of all 15,554 UTX WT-bound sites. The number of sites for each feature is shown in the parenthesis. c. Number and percentage of the genomic sites bound by either UTX WT (normal) or specifically by ΔcIDR (aberrant, not bound by WT) that overlap (within indicated distance) with any of the activating histone marks (H3K4me1, 2, 3, and H3K27ac) merged across all cell samples. d. Heatmap (left) and composite plot (right) for all 15,554 UTX WT-binding peaks in indicated cells. Heatmap rows were ranked by UTX peak levels (MACS2 peaks q-value, high to low). UTX ChIP-seq signals per 20bp non-overlapped bins covering 4kb regions centered at UTX peaks were shown. Details in Supplementary Table 3. e, f. Heatmap (left) and composite plot (right) for H3K4me1 (e) or H3K27ac (f) peaks in indicated cells at the UTX-binding sites (number indicated) with higher H3K4me1 (e) or H3K27ac (f) intensity in WT than vector expressing cells. Heatmap rows were ranked by UTX peak significance (MACS2 q-value, high to low). ChIP-seq signals from indicated histone modification per 20bp non-overlapped bins covering 4kb regions centered at UTX peaks were shown. g-j. Left, scatter plot using the indicated H3K4me3 (g), H3K4me2 (h), H3K27me3 (i), and MLL4 binding (j) signal level change in cells indicated on the x and y axes, for all 15,554 UTX WT-bound sites. Black dashed line indicates the linear fit with correlation coefficient (r) labeled. Right, composite plot for indicated modification or binding signals centered at UTX peaks in indicated cells. k. Scatter plots using the indicated histone modification signal level change in cells indicated on the x and y axes, for all 15,554 UTX WT-bound sites. Black dashed line indicates the linear fit with correlation coefficient (r) labeled. l. Top, scatter plot for PRO-seq signal change at all 4,806 UTX WT-bound enhancers in indicated cells. Black dashed line indicates the linear fit with correlation coefficient (r) labeled. Bottom, composite plot for the PRO-seq signals centered at PRO-seq peaks in indicated cells. m. Heatmap (left) and composite plot (right) for PRO-seq signals at UTX WT-bound enhancers that had increased (top row) or decreased (bottom row) PRO-seq signals over 1.2 fold in WT compared to vector expressing cells, in indicated cells. PRO-seq signals centered at PRO-seq peaks were shown.
Extended Data Figure 9.
Extended Data Figure 9.. UTX condensates regulate long-range chromatin interactions.
a. Distribution of types of genomic interactions. P, promoter (TSS ± 2kb); E, enhancer (promoter non-overlapped, union DNase I hypersensitive sites); Desert: all other interactions, <1% in all. b. Distribution of the chromatin loop size in indicated cells. A loop is the connection of two different 5 kb chromatin regions by high-confidence contact reads. c. Number of chromatin loops identified in indicated cells. For simplicity, Venn diagrams for only Vector, WT, and ΔcIDR cells are shown. d. Box plots for the number of normalized HiChIP reads per loop for identified loops in indicated cells. The normalized read counts in a loop represents the relative intensity of the interaction. For H3K4me3 HiChIP (left), n = 57632, 67755, 88993, 95696, 90566 loops in Vector, WT, ΔcIDR, UTX-eIFIDR, ΔcTPR samples, respectively. For H3K27ac HiChIP (right), n = 20912, 27794, 37811, 31232, 26556 loops in Vector, WT, ΔcIDR, UTX-eIFIDR, ΔcTPR samples, respectively. e. Scatter plots for all 26,237 genes using the promoter H3K27ac HiChIP DCI of cells indicated on the x and y axes. Dashed line shows the linear fit with indicated correlation coefficient (r). Red and blue dots represent 479 and 112 genes with DCI of WT over vector > 5 and < −5, respectively. f. Box plots for DCI scores comparing cells indicated on x axis for genes represented by the red (left) and blue (right) dots from e. P values are shown for data significantly greater or less than 0 by two-sided one sample t-test. Left, n = 479 genes each; right, n = 112 genes each. g. Box plots for DCI scores at promoter (TSS ± 2kb) of cell samples (indicated on top of each plot) for genes whose expression was up-or downregulated (indicated on x axis) in the corresponding cells (indicated on top of each plot). Genes were selected as those both have expression and DCI data. The trend of change and the P value between indicated two groups of genes are shown. n = indicated number on x axis. h. Gene pathway analysis using DCI scores from indicated HiChIP data. Red shows pathways relevant to cancer or leukemia inhibition among the top 20 significantly enriched Biological Processes for genes with promoter chromatin interactions substantially increased in WT over vector expressing cells. Blue shows pathways particularly relevant to cell growth and survival among the top 20 significantly enriched Biological Processes for genes with promoter chromatin interactions substantially decreased in WT over vector expressing cells. All by Metascape. Details in Supplementary Table 5. i, j. BART3D results showing transcriptional regulators that were likely to be associated with genomic regions that had increased (i) or decreased (j) chromatin interactions in WT over vector expressing cells from indicated HiChIP datasets. Top 10 ranked transcriptional regulators are labeled in red and their names are shown. For all box plots, data are median (horizontal line), 25-75th percentiles (box) and 1.5 times the interquartile range recorded (whiskers). P values by two-sided t-test for all except by hypergeometric test for h, and from BART3D for i, j.
Extended Data Figure 10.
Extended Data Figure 10.. Integrated genomic analysis for example genes.
a. Normalized RNA-seq reads of indicated genes that are shown for integrated genomic analysis, in Vector (V), WT (W), ΔcIDR (c), UTX-eIFIDR (e), ΔcTPR (T) samples. One repeat of the Vector sample was set to 1. HK2 gene (boxed) differs from the other genes in that it was repressed by UTX WT but not ΔcIDR. b. Integrated genomic analysis for MX2-MX1 cluster, OAS1-3-2 cluster, OASL, UBE2W-LY96 cluster, KCNJ2, and HK2. as examples for UTX condensates-regulated gene expression associated with chromatin interactions. Top, PRO-seq 3′ end coverage tracks (red, + strand; blue, – strand), with the same scale for all samples. A higher MX2 transcriptional activity in WT than ΔcIDR cells is shown by the denser WT PRO-seq signals when IGV-zoomed in in the dashed box on top. Also note the higher transcriptional activity of LY96 in UTX WT than vector and ΔcIDR cells, as shown by the PRO-seq signal density and the - strand eRNA (in green oval) at both LY96 promoter and gene-downstream enhancer. Green arrows show the higher H3K4me1 or H3K27ac signal in WT than the other two cell samples at OASL promoter. PRO-seq confirmed transcriptional changes and, together with the H3K4me1 and H3K27ac peaks, revealed actively and bi-directionally transcribing enhancers. Note that H3K27ac and/or H3K4me1 were increased at MX2, OASL, and KCNJ2 promoters or enhancers upon WT but not ΔcIDR expression. Bottom, H3K27ac HiChIP arc plots of loops are shown on WashU EpiGenome Browser. All arc plots have the same scale for statistical significance (arc darkness) of the loop calls. Black arrows indicate normal loops in WT-expressing cells that were lost in vector, ΔcIDR, or ΔTPR cells. Cyan arrows indicate loops normally suppressed by UTX WT but aberrantly formed in vector, ΔcIDR, or ΔTPR cells.
Extended Data Figure 11.
Extended Data Figure 11.. UTY is a weaker tumor suppressor than UTX due to its altered physical property of condensates.
a. Immunoblotting by indicated antibody of total lysates from THP-1 cells electroporated with empty vector or indicated Myc-tagged UTX WT or mutants. b. Amino acid sequence alignment of UTX and UTY cIDR. Middle row shows identical residues (by letter) and conservative mutations (by “+”). Y and F are labeled with green box. Negatively charged residues (E and D) are in red font, and positively charged residues (R and K) are in blue font. Charged residues that are unique in UTX or UTY cIDR are bold and underlined. c. Net charge per residue for cIDR of UTX and UTY, determined by CIDER. d. Images of Ni resin after binding with bacterial lysates during purification of indicated proteins. Red arrows point to the unusual aggregation of the resin bound to UTY cIDR. e. Coomassie blue staining image of purified UTX cIDR and UTY cIDR with indicated fluorescence tag. A non-specific band is indicated by the asterisk. f. Indicated proteins all at 30 μM protein and in 150 mM NaCl were subjected to centrifugation. The unspun mixture (“mixed”), supernatant (“super”), and pellets were resolved on SDS-PAGE gel followed with coomassie blue staining. Partition Percentage is plotted (right) as described in Methods as mean ± SD of 3 repeats. ***P<0.001 by two-sided t-test. g. Fluorescence and DIC images of mCherry-UTX cIDR or mCherry-UTY cIDR at indicated concentrations and time points after dilution into the condensation buffer. h. Fluorescence microscopy images of mEGFP-UTX cIDR or mEGFP-UTY cIDR at increasing concentrations of protein and NaCl. A shorter exposure time was used for all images of 20 μM protein. i. Fluorescence Image and line carpet of mEGFP-UTX cIDR and mEGFP-UTY cIDR droplets. j. Line RICS autocorrelation curves of 50 μM mEGFP-UTX cIDR and mEGFP-UTY cIDR at early (< or = 100 min) or late (> 170 min) time of phase separation after dilution into the condensation buffer, shown as mean ± SD. n UTX early = 8, n UTY early = 9, n UTX late = 8, n UTY late = 9 droplets. k. Representative fluorescence microscopy images for FRAP assays of UTX or UTX-UTYIDR fused to EGFP in nuclei following transfection into 293T cells. The photobleached focus was boxed and also amplified in the images on the right. Photobleached at time 0.
Extended Data Figure 12.
Extended Data Figure 12.. UTX cancer-associated missense mutations alter condensate properties.
All panels in this figure used 20 μM (unless otherwise indicated in a) mEGFP-UTX (419-848) WT or mutants as indicated. S781Y and S814F mutation was found in one and two patients, respectively, and both were predicted by ICGC to have high functional impact. 5M is a compound missense mutation containing S674Y, S781Y, H808Y, S814F, and S818L, all found in one cancer patient. See Methods “Cancer database analysis for mutations” for details. a. Pictures and relative turbidity as OD600 normalized to the value of WT and plotted as mean ± SD. n = 3 independent experiments. Bottom, coomassie blue staining of the corresponding proteins, sometimes with finely adjusted (10%) different concentrations (for S814F) to ensure fair comparison with WT. b. Representative fluorescence microscopy and DIC images at indicated times in condensation. Scale bar, 10 μm. c. FRAP recovery curves as mean ± SD at indicated early and late times in condensation. Top two panels, n = 13 droplets for WT and S781Y each at early times, and n = 9 for each of them at late times. Bottom two panels, n = 9, 10, 10 for WT, 5M, S814F, respectively, at early times, and n = 8 for each of them at late times. The statistics is for the last time points, but, for WT and S814F at late condensation times, is for 0-143 seconds after photobleaching. d-f. Line RICS assays for WT (n = 21 droplets), S781Y (n = 12), S814F (n = 10), and 5M (n = 11) over the time range of 0-100 min in condensation. d. Fluorescence Images and line carpets. e. Line RICS autocorrelation curves. f. Plot showing the mean ± SD of the diffusion coefficients. ***P<0.001, and ****P<0.0001 by two-sided t-test for all.
Figure 1.
Figure 1.. cIDR-dependent UTX phase separation is critical for tumor suppression.
a. Top, distribution of all UTX mutations of indicated types. From cBioPortal. Bottom, disorder plot of UTX predicted by IUPred. The bottom bar indicates UTX (549-848) as cIDR. b. Fluorescence (upper) and DIC (bottom) microscopy images of 30 μM EGFP-cIDR. Scale bar, 5 μm. c. Fusion of three droplets formed by 30 μM EGFP-cIDR. Scale bar, 1 μm. d. Fluorescence microscopy images of 293T cells transfected with indicated UTX constructs fused to EGFP. e, f. Growth curves of THP-1 cells electroporated with indicated UTX constructs, shown as mean ± SD. n = 3 independent experiments. g. FRAP recovery curves of transfected UTX (WT or HY)-mEGFP in 293T cells, as mean ± SD (n = 7 cells each). h. THP-1 cells transduced with indicated constructs were grafted into immune-deficient mice. Bioluminescence images (inset) and signals at the indicated days are presented as mean ± SD. n = 6, 8, 7, 8, 8 mice for Vector, WT, ΔcIDR, ΔTPR, UTX-eIF(IDR), respectively. i. A diagram summarizing the structure, nuclear foci, and tumor suppressive activity (TS) of the indicated UTX proteins. j. Heatmap for expression of 1,271 genes significantly changed by WT from vector in THP-1 cells transduced with indicated constructs (two samples each). Statistical analyses are for the last time point. P values by two-sided t-test for all.
Figure 2.
Figure 2.. Endogenous UTX condensation regulates ESC differentiation.
a. Representative confocal images of endogenous mEGFP-UTX in live ESCs. b. Normalized fluorescence recovery of mEGFP-UTX signals in ESCs by FRAP assays, as mean ± SD of n = 13 cells. Photobleaching at t = 0. c. WT and genomically edited Utx KO and ΔcIDR ESCs in EB differentiation assays. d. Venn diagrams for genes down (↓)- or up (↑)-regulated by KO or ΔcIDR (two clones) compared to WT ESCs. From RNA-seq of two 2 independent differentiation assays. P values by two-sided Fisher’s exact test.
Figure 3.
Figure 3.. Co-condensation of UTX and MLL4 enriches histone modification activities.
a. Confocal images of 293T cells expressing both MLL4C(N)-mCherry-Cry2 and UTX (WT or indicated mutant)-EGFP, before and after light activation. b. Fluorescence microscopy images of LacO-cells co-transfected with MLL4f-mCherry and EGFP-LacI (control) or UTX (WT or mutant)-EGFP-LacI. Right, normalized recruitment coefficients of MLL4f, as mean ± SD. n = 22, 27, 17, 15 cells for control, WT, ΔcIDR, and ΔTPR, respectively. c. Representative results of in vitro HMT assays using the indicated UTX WT or mutant pulldowns. Left, immunoblotting by indicated antibodies. Right, normalized H3K4me1 activity, as mean ± SD. n = 3 independent experiments. d. Quantification of percentage of cells showing H3K27me3 decrease after transfection of indicated UTX constructs, as mean ± SD. n = 4 independent experiments for WT and MT2, and 5 for the others each. P values by one-way ANOVA followed by Tukey’s post hoc test for all.
Figure 4.
Figure 4.. UTX condensates regulate genome-wide chromatin activities.
a, b. Left, scatter plot for H3K4me1 (a) or H3K27ac (b) signal level change in cells indicated on the x and y axes for all 15,554 UTX-binding sites. Black dashed line indicates the linear fit with correlation coefficient (r) labeled. Right, composite plot for indicated histone modification signals centered at UTX binding sites in indicated cells. c. Scatter plots for DCI scores at promoters of all 26,237 genes from H3K4me3 HiChIP comparing cells indicated on the x and y axes. Red and blue dots represent 936 and 866 genes with DCI of WT over vector > 5 and < −5, respectively. Details in Supplementary Table 5. d. Box plots for DCI scores comparing cells indicated on x axis for genes represented by the red (left) and blue (right) dots from (c). Data are median (horizontal line), 25–75th percentiles (box) and 1.5 times the interquartile range recorded (whiskers). P values are shown for data significantly greater or less than 0 by two-sided one sample t-test. Left, n = 936 genes, right, n = 866 genes.
Figure 5.
Figure 5.. UTY is a weaker tumor suppressor with altered condensate properties.
a. Growth curves of THP-1 cells electroporated with indicated constructs, shown as mean ± SD. n = 4 independent experiments. Statistical analyses for the last time point. b. Turbidity, as shown by pictures and OD600, of 30 μM mEGFP, mEGFP-UTX cIDR, or-UTY cIDR. OD600 is presented as mean ± SD. n = 3 independent experiments. c, d. Representative fluorescence images of 293T cells transfected with UTX or UTX-UTYIDR fused to EGFP (c). d. Partition coefficient for the top 3 brightest GFP foci in each randomly selected cell. n = 10 cells for UTX, and 17 cells for UTX-UTYIDR. e. FRAP of 50 μM mEGFP-UTX cIDR or -UTY cIDR, at early (5’-40’) and late (120’-160’) times in condensation. Left, representative images of early droplets at indicated time points (photobleaching at 0). Right, recovery curves as mean ± SD. n = 5 UTX droplets and 6 UTY droplets. Scale bar, 2 μm. f. Left, scatter plot of mEGFP-UTX or UTY cIDR diffusion coefficients in droplets in vitro by Line RICS assays, over time in condensation. Right, bar plot for mean ± SD of the diffusion coefficients at early (< or = 100 min) or late (> 170 min) times. n = 8 UTX droplets and 9 UTY droplets. g. FRAP of transfected UTX or UTX-UTYIDR fused to EGFP in 293T cells. Recovery curves as mean ± SD. Statistics between the two samples at different time points. The half time of recovery is shown as mean ± SD. n = 8 cells for UTX, and 9 cells for UTX-UTYIDR. h. A diagram showing the impact of condensation and the different material properties of the UTX WT, cancer mutant, and UTY on the activities in tumor suppression. *P<0.05, **P<0.01, by two-sided t-test for all.

Comment in

References

    1. Wang L & Shilatifard A UTX Mutations in Human Cancer. Cancer cell 35, 168–176, doi:10.1016/j.ccell.2019.01.001 (2019). - DOI - PMC - PubMed
    1. Gozdecka M et al. UTX-mediated enhancer and chromatin remodeling suppresses myeloid leukemogenesis through noncatalytic inverse regulation of ETS and GATA programs. Nature genetics 50, 883–894, doi:10.1038/s41588-018-0114-z (2018). - DOI - PMC - PubMed
    1. Andricovich J et al. Loss of KDM6A Activates Super-Enhancers to Induce Gender-Specific Squamous-like Pancreatic Cancer and Confers Sensitivity to BET Inhibitors. Cancer cell 33, 512–526.e518, doi:10.1016/j.ccell.2018.02.003 (2018). - DOI - PMC - PubMed
    1. Morales Torres C, Laugesen A & Helin K Utx is required for proper induction of ectoderm and mesoderm during differentiation of embryonic stem cells. PloS one 8, e60020, doi:10.1371/journal.pone.0060020 (2013). - DOI - PMC - PubMed
    1. Wang C et al. UTX regulates mesoderm differentiation of embryonic stem cells independent of H3K27 demethylase activity. Proceedings of the National Academy of Sciences of the United States of America 109, 15324–15329, doi:10.1073/pnas.1204166109 (2012). - DOI - PMC - PubMed

Publication types