. 2021 Sep;597(7878):732-737.
doi: 10.1038/s41586-021-03898-1. Epub 2021 Sep 15.

Structure-based classification predicts drug response in EGFR-mutant NSCLC

Affiliations

Structure-based classification predicts drug response in EGFR-mutant NSCLC

Jacqulyne P Robichaux et al. Nature. 2021 Sep.

Abstract

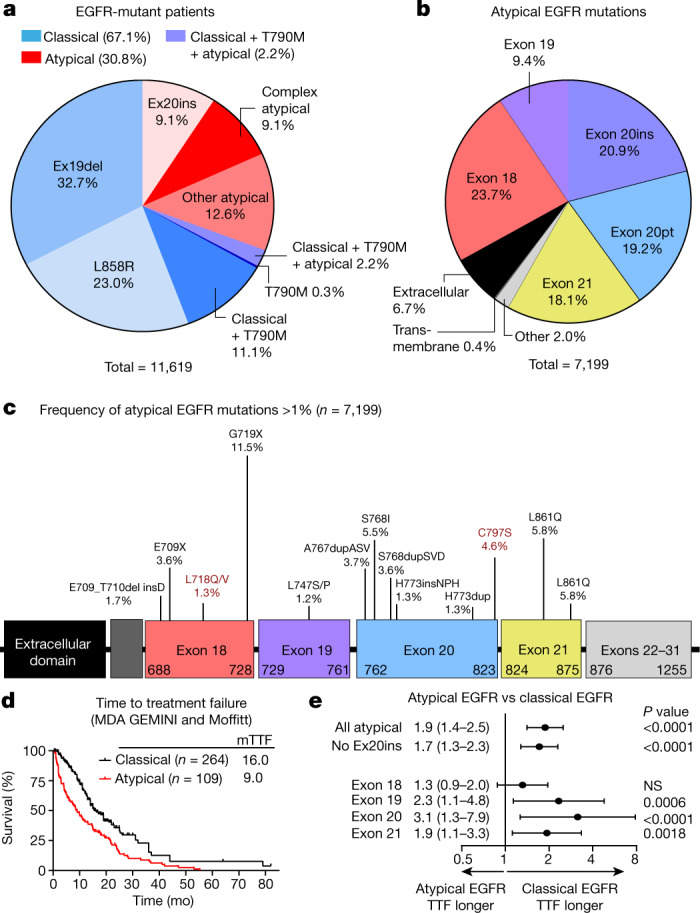
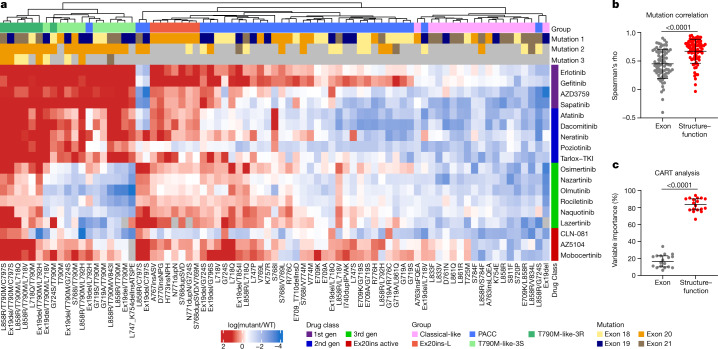
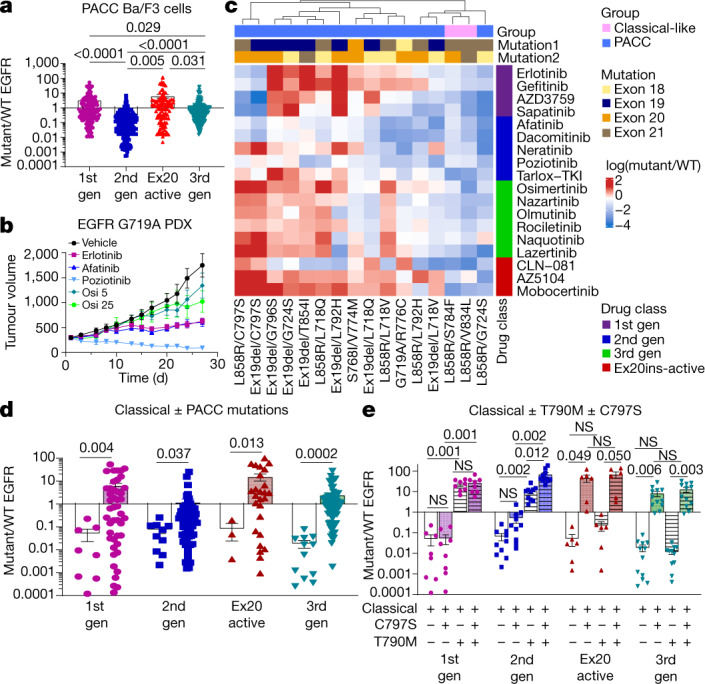
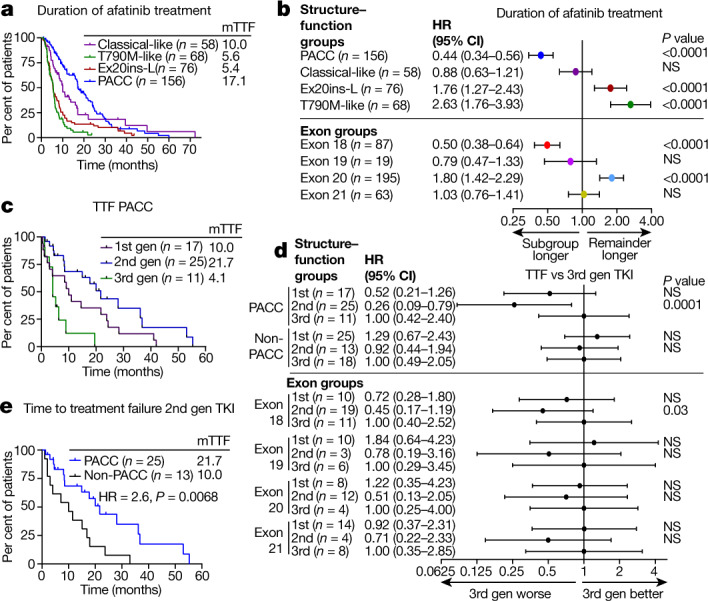
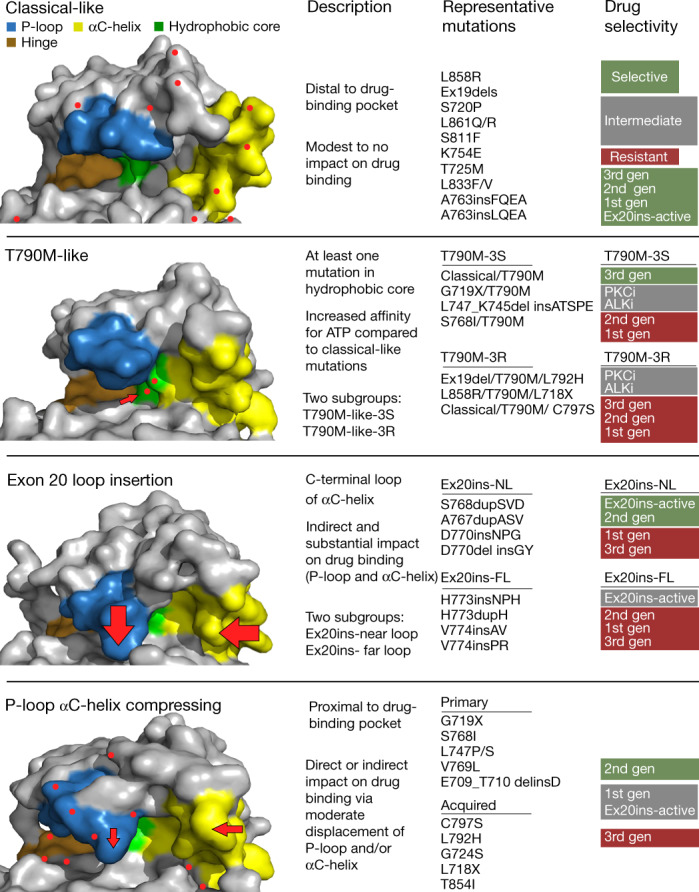
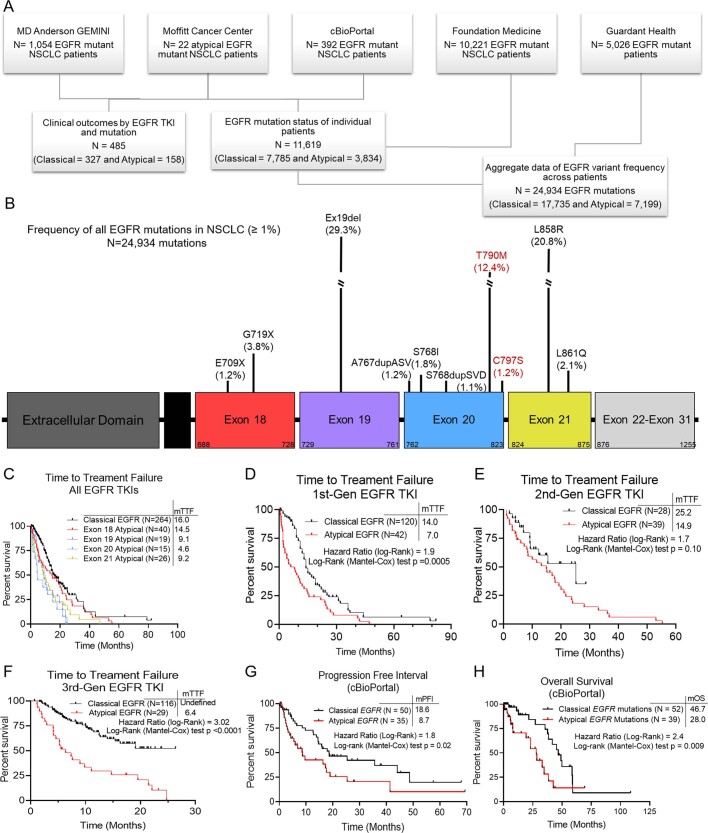
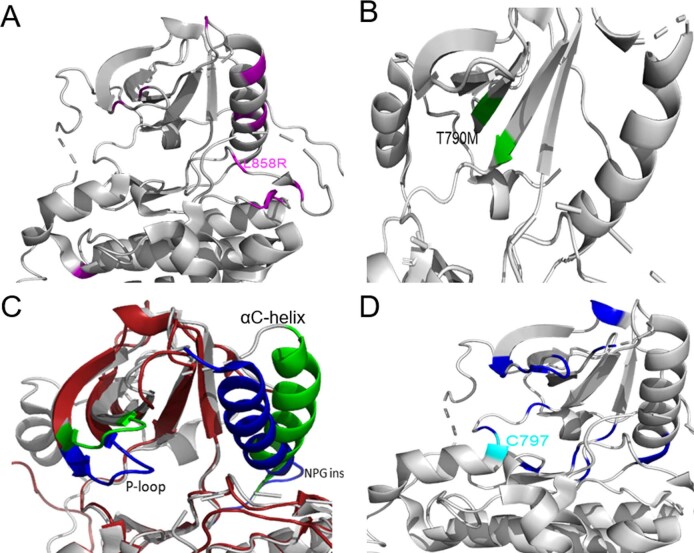
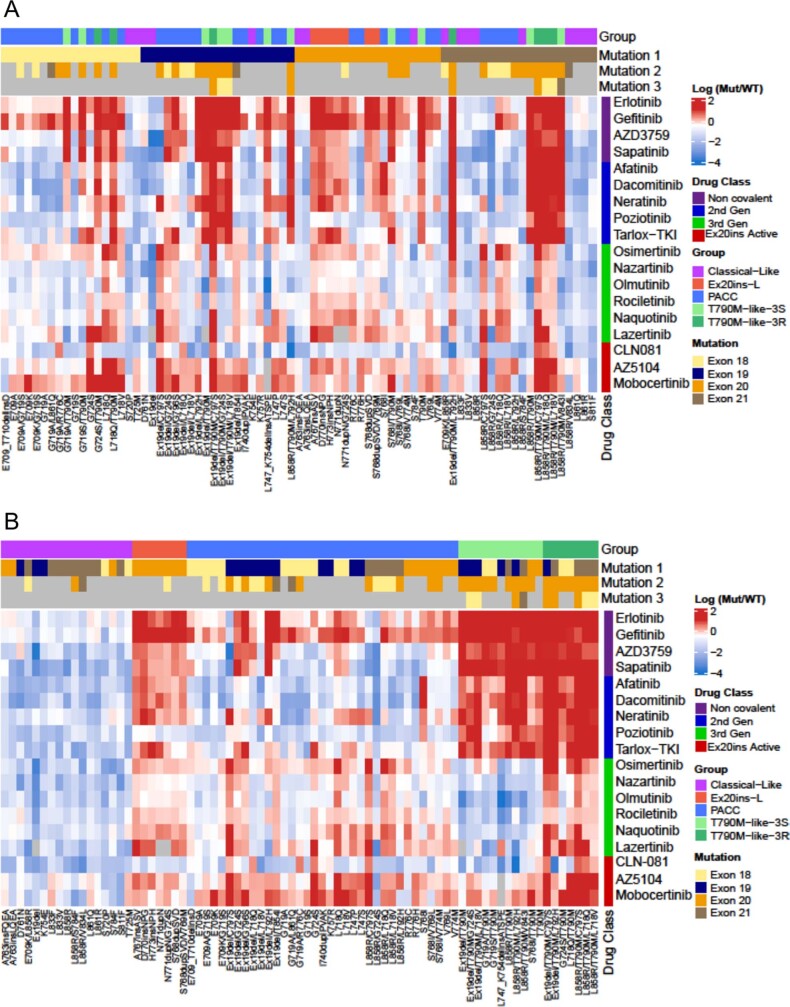
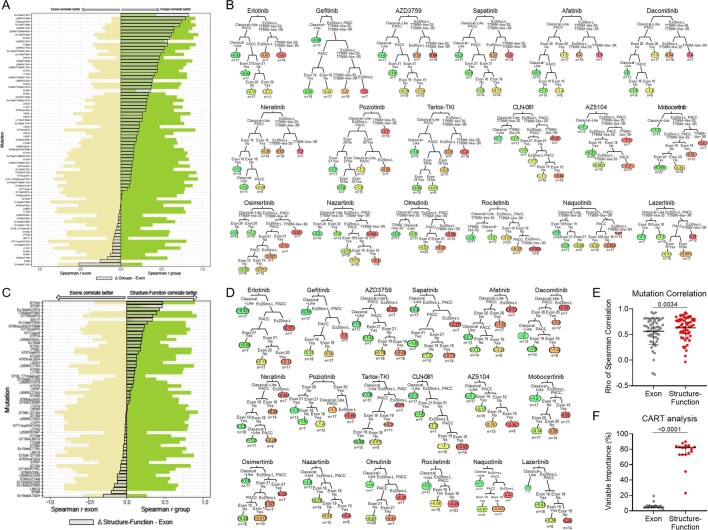
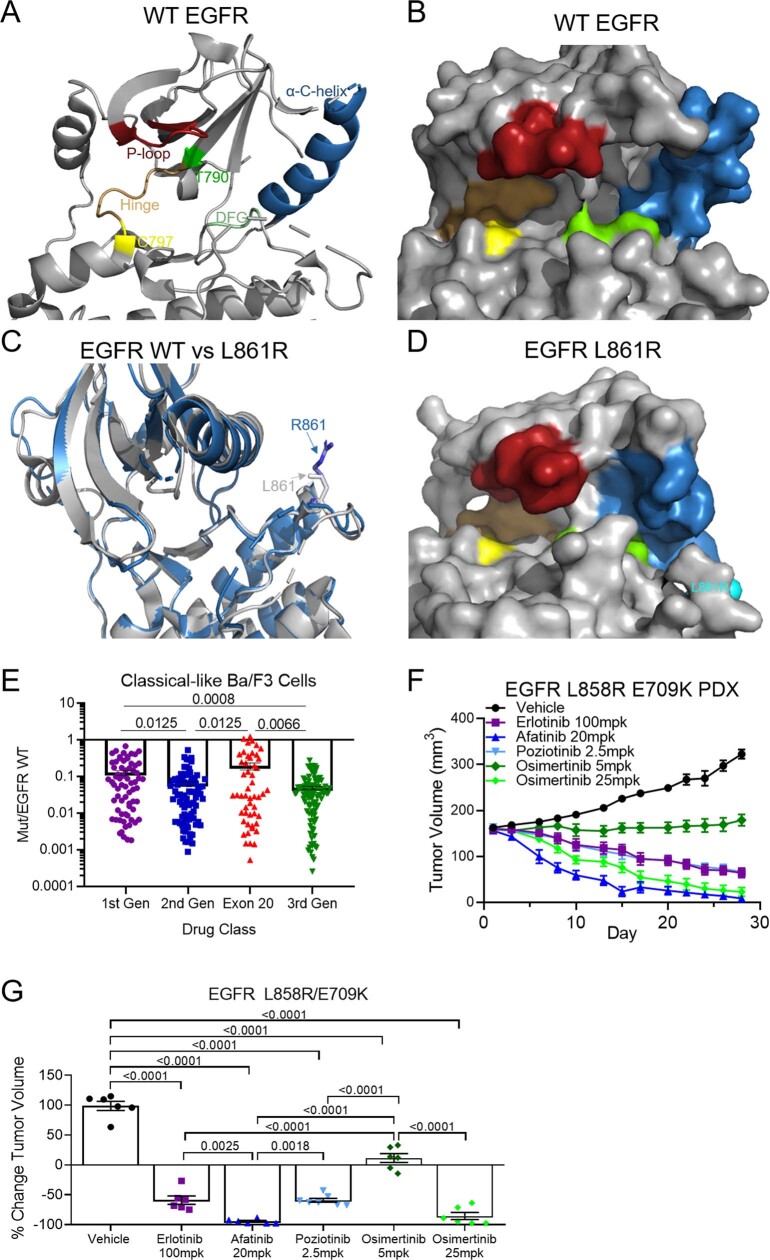
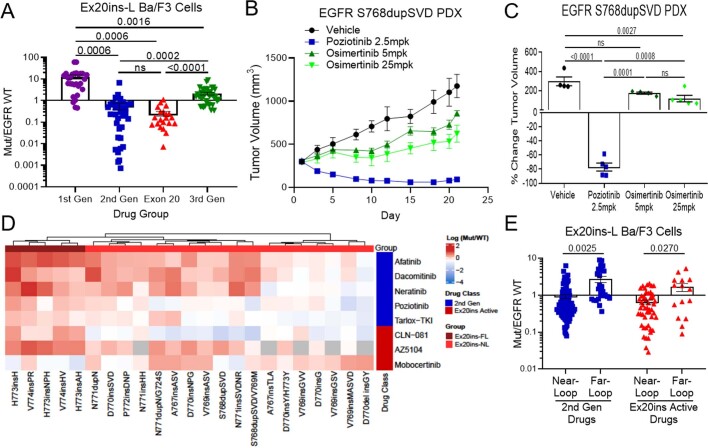
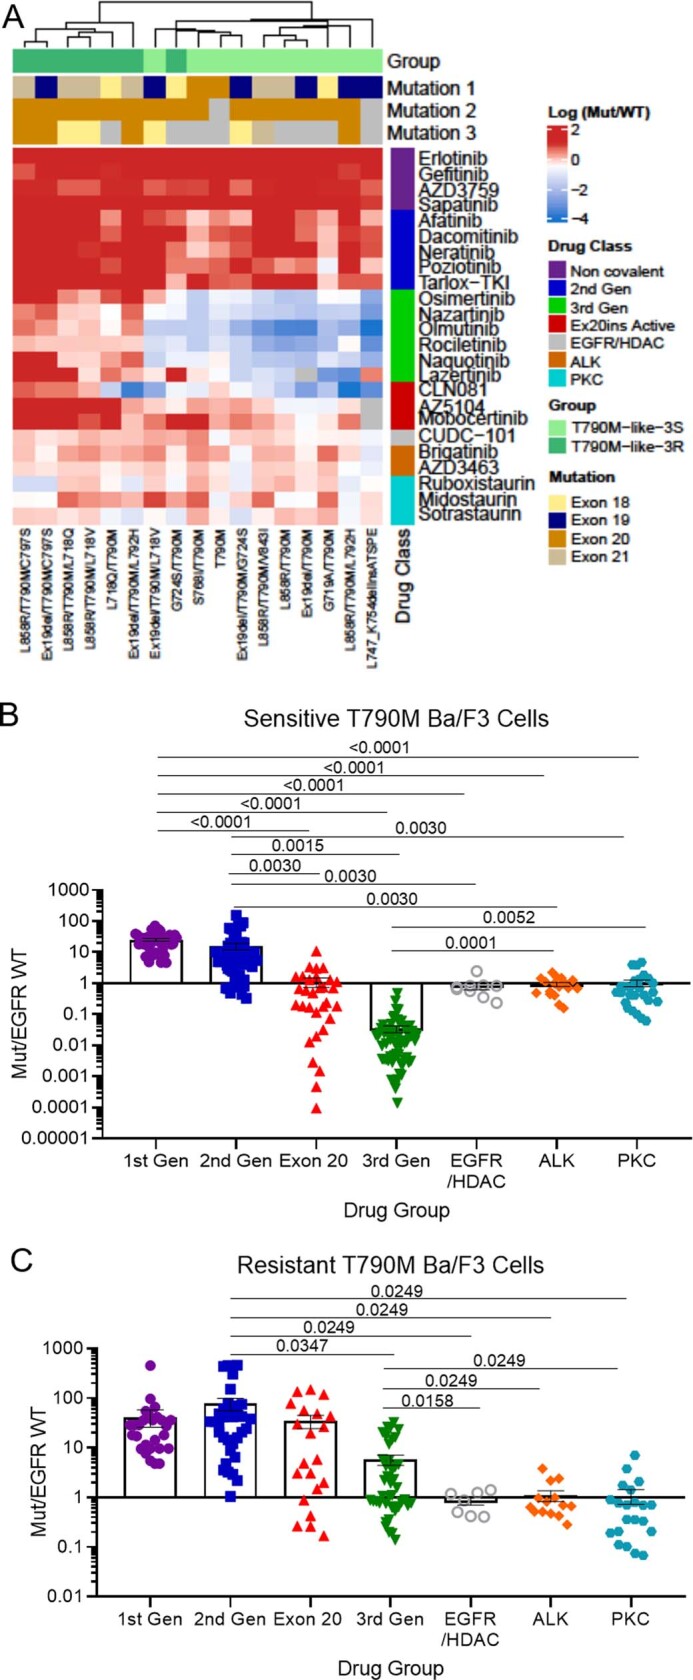
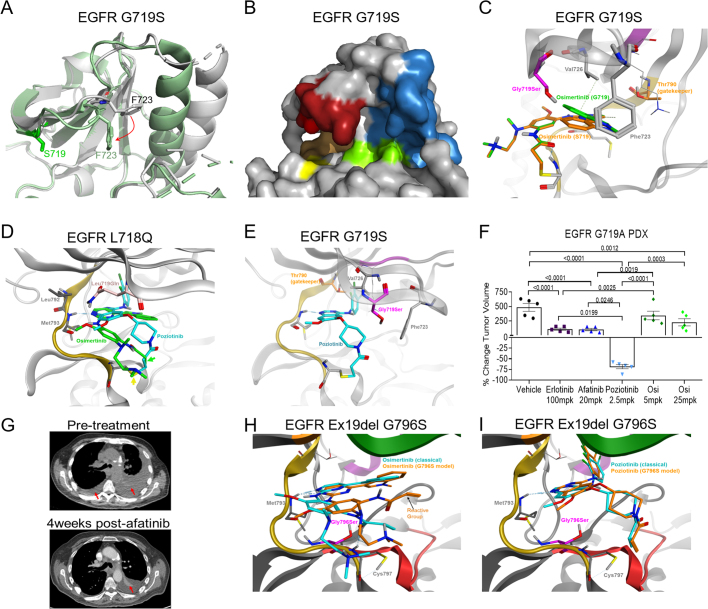
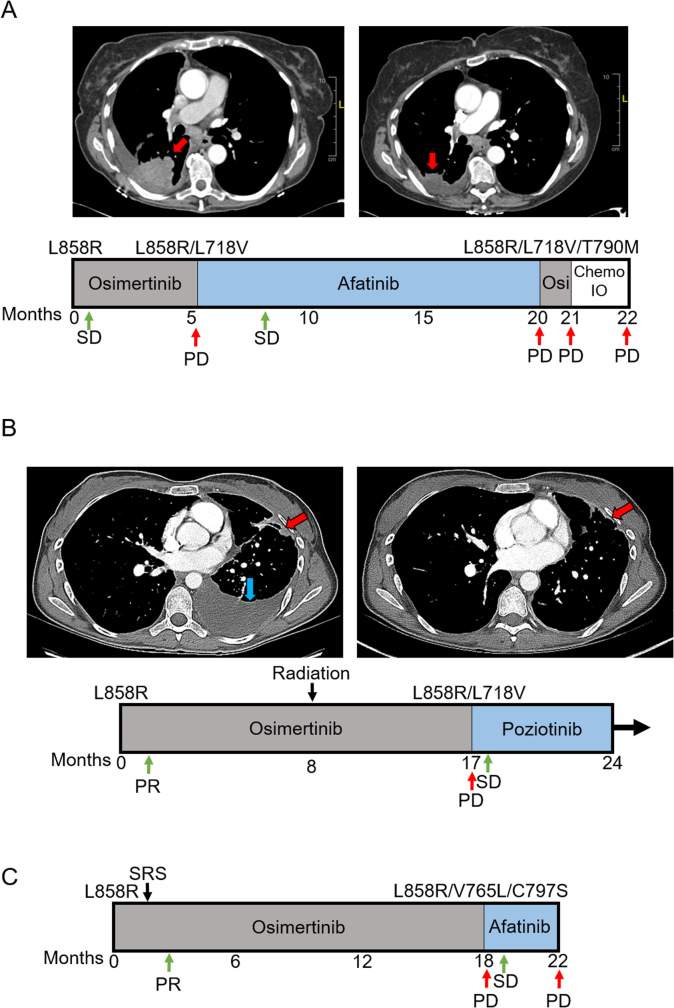
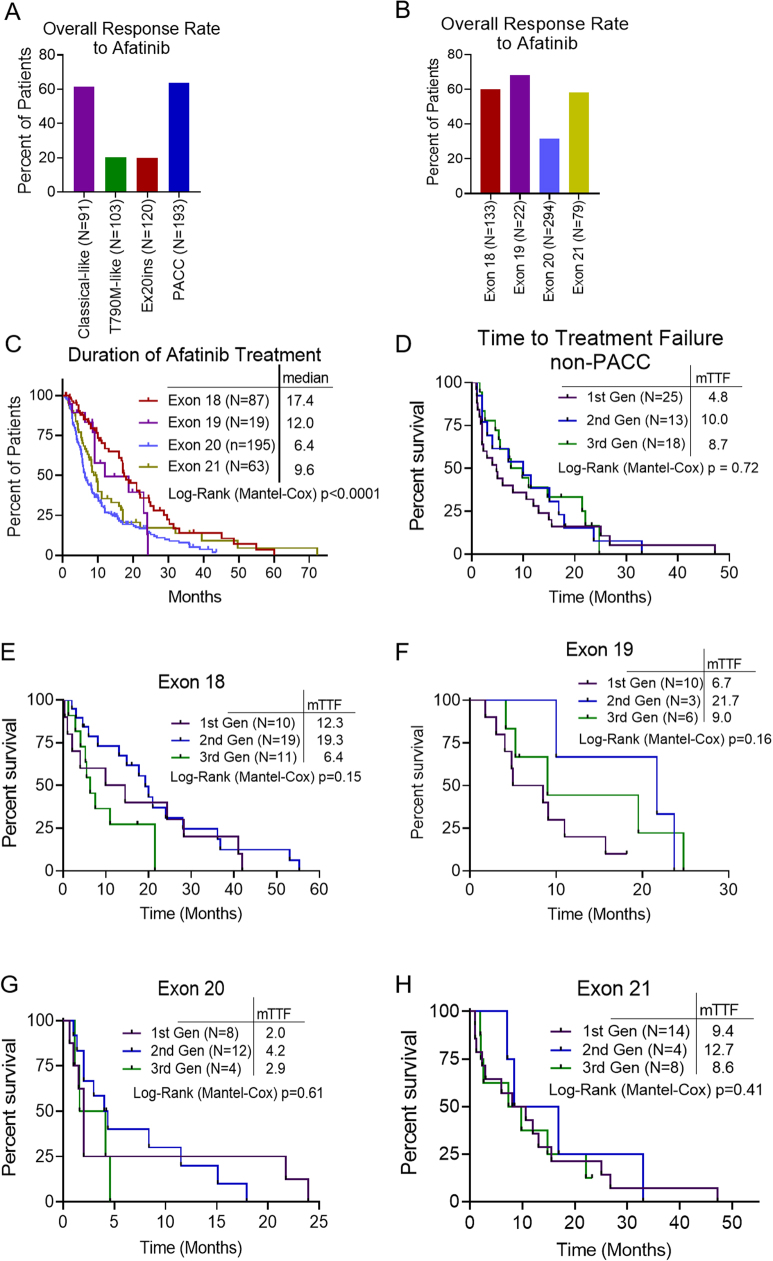
Epidermal growth factor receptor (EGFR) mutations typically occur in exons 18-21 and are established driver mutations in non-small cell lung cancer (NSCLC)1-3. Targeted therapies are approved for patients with 'classical' mutations and a small number of other mutations4-6. However, effective therapies have not been identified for additional EGFR mutations. Furthermore, the frequency and effects of atypical EGFR mutations on drug sensitivity are unknown1,3,7-10. Here we characterize the mutational landscape in 16,715 patients with EGFR-mutant NSCLC, and establish the structure-function relationship of EGFR mutations on drug sensitivity. We found that EGFR mutations can be separated into four distinct subgroups on the basis of sensitivity and structural changes that retrospectively predict patient outcomes following treatment with EGFR inhibitors better than traditional exon-based groups. Together, these data delineate a structure-based approach for defining functional groups of EGFR mutations that can effectively guide treatment and clinical trial choices for patients with EGFR-mutant NSCLC and suggest that a structure-function-based approach may improve the prediction of drug sensitivity to targeted therapies in oncogenes with diverse mutations.


Conflict of interest statement

The research being reported in this publication is research in which The University of Texas MD Anderson Cancer Center has an institutional financial conflict of interest. Because MD Anderson is committed to the protection of human subjects and the effective management of its financial conflicts of interest in relation to its research activities, MD Anderson has implemented an Institutional Conflict of Interest Management and Monitoring Plan to manage and monitor the conflict of interest with respect to MD Anderson’s conduct of this research. MD Anderson, including J.P.R., M.B.N. and J.V.H. have filed a patent for the use of poziotinib for treating EGFR- and HER2-mutant cancers and licensed the technology to Spectrum Pharmaceuticals. J.P.R. and J.V.H. receive research support from Spectrum Pharmaceuticals, Takeda and Enliven Therapeutics. MD Anderson, including M.B.N., J.P.R. and J.V.H. have a pending patent submitted for treatment of EGFR TKI resistant NSCLC, and another, including J.P.R., S.H. and J.V.H., for the classification of EGFR mutations. J.P.R. and M.B.N. have no non-financial competing interests. J.V.H. also receives grant or research support from AstraZeneca and GlaxoSmithKline and has served on advisory committees for AstraZeneca, Boehringer Ingelheim, Bristol-Myers Squibb, Catalyst, EMD Serono, Foundation Medicine (FMI), Hengrui Therapeutics, Genentech, GlaxoSmithKline, Guardant Health, Eli Lilly, Merck, Novartis, Pfizer, Roche, Sanofi, Seattle Genetics, Spectrum Pharmaceuticals, Takeda. As non-financial competing interests, J.V.H. serves as scientific advisor for Rexanna Foundation and the EGFR resisters. X. Le receives consulting/advisory fees from EMD Serono (Merck KGaA), AstraZeneca, Spectrum Pharmaceuticals, Eli Lilly, Boehringer Ingelheim, Bristol-Myers Squibb, Novartis, Hengrui Therapeutics, Daiichi Sankyo, and Celgene, and research funding to the institution from Eli Lilly and Boehringer Ingelheim, and no non-financial competing interests. Y.Y.E. discloses research support from Spectrum Pharmaceuticals, AstraZeneca, Takeda, Eli Lilly, Xcovery, Turning Point Therapeutics; advisory role for AstraZeneca, Eli Lilly and Turning Point Therapeutics; and accommodation expenses from Eli Lilly, and no non-financial competing interests. J.Z. reports research funding and consulting fees from Bristol-Myers Squibb, AstraZeneca, Geneplus, OrigMed, Innovent, Merck, Johnson and Johnson, and no non-financial competing interests. F.S. receives consulting/advisory fees from Amgen, Navire Pharma, Intellisphere LLC; research funding to the institution from Amgen, Mirati Therapeutics, Boehringer Ingelheim, Merck&Co, Novartis, Pfizer; speaker’s fees from Bristol-Myers Squibb and RV Mais Promocao Eventos LTDS; other support from AstraZeneca Pharmaceuticals; travel expenses from Tango Therapeutics and reports past stock ownership of Moderna Inc and BioNTech SE. As non-financial competing interests F.S. serves as scientific advisor for Tango Therapeutics and has previously served as advisor for Calithera Biosciences. J.E.G. reports research support from AstraZeneca, Boehringer Ingelheim, Bristol-Myers Squibb, Genentech, G1 Therapeutics, Merck, Novartis, Pfizer, and the Lurdwig Institute of Cancer Research, and serves as a consultant/advisor for Daiichi Sankyo, Janssen, Novartis, Merck, Inivata, EMD Serono, Bristol-Myers Squibb, Blueprint Medicines, and AstraZeneca. H.T. reports research support from Bayer AS, Guardant Health, Ziopharm, and no non-financial interests. J.S. and V.R. are shareholders/full time employees of Guardant Health and report no non-financial interests. R.M. and A.B.S. are full time employees of Foundation medicine, a wholly-owned subsidiary of Roche, and have Roche stock ownership, with no non-financial competing interests. J.K.H. receives research support from OneOme, is a consultant for Quest Diagnostics and 23andMe, and has served on an advisory committee for Novartis, and has provided educational content for the American College of Clinical Pharmacy, Florida Pharmacy Association and HorizonCME. All other authors report no financial or non-financial competing interests.

Figures

Fig. 1
Fig. 1. Atypical EGFR mutations are associated with worse patient outcomes.
a, Percentage of patients with NSCLC containing classical and atypical EGFR mutations (n = 11,619 patients). Classical EGFR mutations are L858R, T790M and various Ex19dels (Methods). b, Percentage of atypical EGFR mutations observed in patients with NSCLC (n = 7,199 mutations). Atypical EGFR mutations are defined as non-classical, non-synonymous mutations. c, Lollipop plot of frequency of atypical EGFR mutations in patients with NSCLC (n = 7,199 mutations). EGFR mutations associated with acquired drug resistance are highlighted in red. d, Kaplan–Meier plot of time to treatment failure (TTF) (time from TKI commencement until radiologic progression, discontinuation, or death) of patients with NSCLC tumours containing classical (n = 245 patients) or atypical (n = 109 patients) EGFR mutations after EGFR TKI treatment. e, Forest plot of HR calculated from Kaplan–Meier plots of patients with various subsets of atypical mutations or classical EGFR mutations. In d, e, HR and P value were calculated using two-sided Mantel–Cox log-rank tests. Data are HR ± 95% confidence interval. All atypical, n = 109; all atypical without Ex20ins, n = 97; exon 18, n = 29; exon 19, n = 22; exon 20, n = 41; exon 21, n = 18. NS, not significant. Source data.
Fig. 2
Fig. 2. EGFR mutations can be separated into four distinct subgroups.
a, Heat map with unsupervised hierarchical clustering of log(mutant/wild type (WT)) ratios from Ba/F3 cells expressing indicated mutations after drug treatment. To determine the mutant/WT ratio, half-maximal inhibitory concentration (IC50) values for each drug and cell line were calculated and then compared to the average IC50 values for Ba/F3 cells expressing wild-type EGFR (+10 ng ml−1 EGF). Squares are representative of the median of n = 3 replicates. The order of co-occurring mutations was assigned arbitrarily. Groups were assigned on the basis of structural predictions (Methods). Gen, generation. b, Dot plot of Spearman’s rho values for correlations of mutations versus exon-based group averages or structure–function-based averages for each drug. Dots are representative of rho value of each mutation; bars show mean ± s.d., n = 77 cell lines or mutations. c, Dot plot of variable importance calculated from CART. Dots are representative of variable importance for each drug; bars show median + 95% confidence interval of variable importance for all drugs (n = 18 drugs) (Supplementary Table 2). In b, c, P value was determined using a paired two-sided t-test. Source data.
Fig. 3
Fig. 3. PACC mutations are robustly sensitive to second-gneeration TKIs.
a, Dot plot of mutant/WT IC50 values of Ba/F3 cells expressing PACC mutations. b, Tumour growth curves for PDXs containing EGFR G719A PACC mutation treated with TKIs five days per week. Symbols show mean tumour volume ± s.e.m., n = 5 mice. Osi 5, osimertinib 5 mg kg−1; osi 25, osimertinib 25 mg kg−1. c, Heat map with unsupervised hierarchical clustering of log(mutant/WT) ratios from Ba/F3 cells expressing indicated mutations after drug treatment. Squares represent the median of n = 3 replicates. Mutation order was assigned arbitrarily; groups were assigned on the basis of predicted mutational impact. d, Dot plot of mutant/WT IC50 values of Ba/F3 cells expressing classical EGFR mutations (white bars) with or without PACC mutations (coloured bars). In a, d, P values were determined by one-way analysis of variance (ANOVA) with unequal s.d. and Holm–Sidak’s multiple comparisons test. e, Average mutant/WT ratio of Ba/F3 cells expressing classical EGFR mutations (white bars), and classical EGFR mutations plus C797S (shaded bar), T790M (hashed bars) or T790M and C797S (shaded and hashed bars). P values were determined by one-way ANOVA with repeated measures and post hoc Fishers’ multiple comparisons test. In a, f, h, bars show mean ± s.e.m. of mutant/WT ratio for all mutations and drugs; dots show representative average mutant/WT of n = 3 replicates. Source data.
Fig. 4
Fig. 4. Structure–function groups better predict patient outcomes than exon-based groups.
a, Kaplan–Meier plot of DOT of patients with NSCLC tumours containing atypical EGFR mutations (n = 358 patients) stratified by structure-based groups treated with afatinib. b, Forest plot of HRs calculated from Kaplan–Meier plots in a and Extended Data Fig. 10c. In a, b, classical-like, n = 58; T790M-like, n = 68; Ex20ins-L, n = 76; PACC, n = 156; exon 18, n = 87; exon 19, n = 19; exon 20, n = 195; exon 21, n = 63. c, Kaplan–Meier plot of TTF of patients with PACC mutations treated with first-, second- or third-generation EGFR TKIs. d, Forest plot of HRs calculated from Kaplan–Meier plots in c and Extended Data Fig. 10d–h. In c, d, PACC, n = 53; non-PACC, n = 56; exon 18, n = 40; exon 19, n = 19; exon 20, n = 24; exon 21, n = 26. e, Kaplan–Meier plot of TTF of patients with PACC mutations (n = 25) or non-PACC mutations (n = 13) treated with second-generation TKIs. In ae, HRs and P values were calculated using two-sided Mantel–Cox log-rank tests. In b, d, data are representative of HR ± 95% confidence interval. Source data.
Fig. 5
Fig. 5. EGFR mutations can be divided into four distinct subgroups.
Representative space-filling models of each EGFR subgroup demonstrate changes in overall shape of drug-binding pocket. The P-loop (blue), hinge region (ATP-binding site (orange)), hydrophobic cleft (green), and αC-helix (yellow) are shown. Red dots represent location of mutations. Arrows indicate location of structural changes compared with wild-type EGFR. The most common mutations are shown for each group, and drug sensitivity or selectivity is colour-coded and listed from most selective or sensitive (green) to resistant (red). PKCi, PKC inhibitor; ALKi, ALK inhibitor.
Extended Data Fig 1
Extended Data Fig 1. Patients with atypical EGFR mutations have worse clinical outcomes than those with classical EGFR mutations.
a, Diagram of patient sample sources and types across databases. b, Lollipop plot of frequency of all EGFR mutations observed in patients with NSCLC (N=24,934 mutations). EGFR mutations associated with acquired drug resistance, as described by the literature, are highlighted in red. cf, Kaplan-Meier plot of TTF of patients with NSCLC tumors harboring classical (N=264 patients) or atypical EGFR mutations stratified by (c) exon after treatment with an EGFR TKI (Exon 18 N= 40, Exon 19 N=19, Exon 20 N=15, Exon 21 N=26), or EGFR TKI class including 1st- (d), 2nd- (e), or 3rd- (f) gen TKIs in MD Anderson GEMINI and Moffitt Cancer center databases. Patients that received prior chemotherapy or immunotherapy were included, but TTF was calculated for first EGFR TKI received. g, h, Kaplan-Meier plot of PFI (g) and OS (h) of patients with NSCLC tumors harboring classical (N=50 for PFI and N=52 for OS) or atypical (N=35 for PFI and N=39 for OS) EGFR mutations from cBioPortal. Atypical EGFR mutations were limited to mutations in the tyrosine kinase domain, and treatment and stage were unknown. ch, HRs and p-values were calculated using two-sided Mantel-Cox, Log-Rank tests Source data.
Extended Data Fig 2
Extended Data Fig 2. Mutational mapping of EGFR mutations.
ad, Mutational mapping of classical-like (a), T790M-like (b), exon 20 loop insertion (red/blue) and WT (grey/green) (c), and PACC mutants (d) onto WT EGFR crystal (PDB 2ITX).
Extended Data Fig 3
Extended Data Fig 3. Heat maps generated through supervised clustering by structure-function-based groups cluster drug sensitivity better than exon-based groups.
a, b, Heat maps supervised clustering by exon-based (a) or structure-function-based (b) groups of log (Mutant/WT) ratios from Ba/F3 cells expressing indicated mutations after 72 h of indicated drug treatment. To determine the mutant/WT ratio, IC50 values for each drug and cell line were calculated and then compared to the average IC50 values of Ba/F3 cells expressing WT EGFR (+10ng/ml EGF to maintain viability). Squares are representative of the median of n=3 replicates. For co-occurring mutations, the order of mutations 1, 2, and 3 were assigned arbitrarily. Groups were assigned based on structural predictions Source data.
Extended Data Fig. 4
Extended Data Fig. 4. Structure-function-based groupings are more predictive of drug and mutation sensitivity compared to exon-based groupings.
a, Bar plot of Spearman rho values for indicated mutations compared to exon-based groups (yellow) or structure-function-based groups (green). The delta of the two rho values is shown as an overlapped grey bar. When the delta bar shifts to the right, the spearman rho value was higher for structure-function-based groups, and when the grey bar shifts to the left, the spearman rho value was higher for the exon-based groups. b, Representative classification and regression trees for each indicated drug. Colors represent drug sensitivity (green) or resistance (red) as defined by log (mutant IC50/WT EGFR IC50). c, Bar plot of Spearman rho values for indicated mutations (excluding T790M mutations) compared to exon-based groups (yellow) or structure-function-based groups (green). The delta of the two rho values is shown as an overlapped grey bar. d, Representative classification and regression trees for each indicated drug excluding T790M from the analysis. Colors represent drug sensitivity (green) or resistance (red) as defined by log (mutant IC50/WT EGFR IC50). e, Dot plot of rho values from Spearman correlations of mutations vs exon-based group averages or structure-function based averages for each drug excluding T790M mutations. Dots are representative of each mutation; bars are representative of the average rho value ± standard deviation (SD). p-value was determined using a paired two-sided t-test, and n = 59 cell lines/mutations. f, Dot plot of variable importance calculated as sum of the goodness of split for each split in the classification and regression trees (CART). Dots are representative of variable importance for each drug in the exon and structure-function-based groups as indicated and excluding T790M mutations. Bars are representative of the median + 95% confidence interval of variable importance for all drugs (Supplementary Table 3). p-value was determined using a paired two-sided t-test, and n = 18 drugs Source data.
Extended Data Fig. 5
Extended Data Fig. 5. Classical-like EGFR mutations are not predicted to alter the drug-binding pocket and are most sensitive to 3rd-gen EGFR TKIs.
a, b, Rendering of crystal structure of WT EGFR (PDB 2ITX) visualized as both a ribbon (a) and space filling (b) models. Residues important in receptor signaling and drug binding are highlighted. c, d, Overlapped rendering of WT crystal (grey) (c) and L861R (blue) and space filing model (d) of L861Q demonstrate the R861 substitution is distal from the drug binding pocket and has minimal impact on the overall structure of EGFR compared to WT. e, Dot plot of mutant/WT IC50 values of Ba/F3 cells expressing classical-like EGFR mutations and treated with indicated classes of EGFR TKIs. Dots are representative of average of n=3 replicate mutant/WT IC50 values of individual cell lines expressing classical-like mutations with individual drugs. Bars are representative of average mutant/WT IC50 values ± SEM for each class of EGFR TKI and all classical-like cell lines. p-values were determined by one-way ANOVA with unequal SD as determined by Brown-Forsythe test to determine differences in SD. Holm-Sidak’s multiple comparisons test was used to determine differences between groups. f, Tumor growth curves for PDXs harboring EGFR L858R E709K complex mutation treated with indicated inhibitors. Tumors were measured three times per week and symbols are average of tumor volumes ± SEM. Mice were randomized into six groups: vehicle (N=6), poziotinib 2.5mg/kg (N=7), erlotinib 100mg/kg (N=6), afatinib 20mg/kg (N=6), osimertinib 5mg/kg (N=6), and osimertinib 25mg/kg (N=6). Mice received drug 5 days per week, and mice were euthanized at day 28 to harvest tumors. g, Dot plot of percent change in tumor volume on day 28 of tumors described in f. Dots are representative of each tumor, and bars are representative of average ± SEM for each group. Statistical differences were determined by ordinary one-way ANOVA with post-hoc Tukey’s multiple comparisons test to determined differences between groups vehicle, N=6 mice, poziotinib 2.5mg/kg, N=7 mice, erlotinib 100mg/kg, N=6 mice, afatinib 20mg/kg, N=6 mice, osimertinib 5mg/kg, N=6, and osimertinib 25mg/kg, N=6 mice. Source data
Extended Data Fig. 6
Extended Data Fig. 6. Exon 20 loop insertions are a distinct class of EGFR mutations.
a, Dot plot of mutant/WT IC50 values of Ba/F3 cells expressing exon 20 loop insertion mutations and treated with indicated classes of EGFR TKIs. Dots are representative of average of n=3 replicate mutant/WT IC50 values of individual cell lines expressing exon 20 insertion mutations with individual drugs. Bars are representative of average mutant/WT IC50 values ± SEM for each class of EGFR TKI and all Ba/F3 cell lines. p-values were determined by one-way ANOVA with unequal SD as determined by Brown-Forsythe test to determine differences in SD. Holm-Sidak’s multiple comparisons test was used to determine differences between groups. b, Tumor growth curves for PDXs harboring EGFR S768dupSVD exon 20 insertion mutation treated with indicated inhibitors. Tumors were measured three times per week and symbols are average of tumor volumes ± SEM. Mice were randomized into four groups: vehicle (N=4), poziotinib 2.5mg/kg (N=5), osimertinib 5mg/kg (N=4), and osimertinib 25mg/kg (N=5) . Mice received drug 5 days per week, and mice were euthanized at day 21 to harvest tumors. c, Dot plot of percent change in tumor volume on day 21 of tumors described in panel c (vehicle, N=4 mice, poziotinib 2.5mg/kg, N=5 mice, osimertinib 5mg/kg, N=4 mice, and osimertinib 25mg/kg, N=5 mice). Dots are representative of each tumor, and bars are representative of average ± SEM for each group. Statistical differences were determined by ordinary one-way ANOVA with post-hoc Tukey’s multiple comparisons test to determined differences between groups. d, Heat map with unsupervised hierarchical clustering of log (Mutant/WT) ratios from Ba/F3 cells expressing indicated exon 20 loop insertions after 72 h of indicated drug treatment. Squares are representative of the median of n=3 replicates. e, Bar plot of average mutant/WT ratio of Ba/F3 cells expressing exon 20 loop insertions separated by mutational groups for indicated drug classes. Bars are representative of average mutant/WT ratio for all mutations and drugs in the indicated groups, dots are representative of average (n=3) mutant/WT ratio of individual mutations and drugs. Error bars are representative of SEM for each bar. Statistical differences between near- and far-loop mutants was determined by two-sided unpaired t-test with unequal variance Source data.
Extended Data Fig. 7
Extended Data Fig. 7. Drug repurposing can overcome T790M-like resistance mutations.
a, Heat map with unsupervised hierarchical clustering of log (mutant/WT) ratios from Ba/F3 cells expressing indicated mutations after 72 h of indicated drug treatment. Squares are representative of the median of n=3 replicates. For co-occurring mutations, the order of mutations 1, 2, and 3 were assigned arbitrarily. Groups were assigned based on hierarchal clustering and known resistance mutations. b, c, Dot plot of mutant/WT IC50 values of Ba/F3 cells expressing T790M-like-3S (3rd-gen TKI sensitive) (b) and T790M-like-3R (3rd-gen TKI resistant) (c) treated with indicated classes of EGFR TKIs. Dots are representative of average of n=3 replicate mutant/WT IC50 values of individual cell lines with individual drugs and drugs of each class are grouped together. Bars are representative of average mutant/WT IC50 values ± SEM for each class of EGFR TKI and all cell lines. p-values were determined by one-way ANOVA with unequal variance as determined by Brown-Forsythe test to determine differences in variance. Holm-Sidak’s multiple comparisons test was used to determine differences between groups Source data.
Extended Data Fig. 8
Extended Data Fig. 8. PACC mutations alter the orientation of the P-loop and/or αC-helix and are sensitive to 2nd-gen TKIs.
a, Overlap of G719S (PDB 2ITN, green) and WT EGFR (PDB 2ITX, grey) crystal structures demonstrate arobust shift of F723 (red arrow) in the P-loop orienting the benzyl ring in a downward position condensing the P-loop in the drug binding pocket. Further, G719S displays an inward shift of the αC-helix compared to the WT crystal structure. b, Surface representation of G719S (PDB 2ITN) with P-loop (red), αC-helix (blue), hinge region (orange), C797 (yellow), and DFG motif (green) highlighted to demonstrate steric hindrance of drug binding pocket caused by shifted P-loop. c, Comparison of osimertinib bound to wild-type EGFR (PDB 4ZAU, green) or EGFR G719S (PDB 2ITN, purple) demonstrates destabilization of TKI-protein interactions. d, In silico homology model of EGFR L718Q (pink) with predicted binding modes of osimertinib and poziotinib structures demonstrates that Q718 hinders the interaction of osimertinib (green) with M793 and shifts the Michael acceptor (reactive group, green arrow) out of alignment with C797 (yellow arrow). In contrast, poziotinib (blue) is less effected by Q718 and is still positioned to react with C797, even in the context of L718Q mutations. e, In silico modeling of EGFR G719S (purple) with poziotinib (blue) shows no predicted changes in poziotinib binding or TKI-protein interactions. f, Dot plot of percent change in tumor volume on day 28 of tumors described in Fig. 3c. Dots are representative of each tumor, and bars are representative of average ± SEM for each group, N=5 mice per treatment group. Statistical differences were determined by ordinary one-way ANOVA with post-hoc Tukey’s multiple comparisons test to determined differences between groups. g, Representative CT images from a patient harbouring E709K G719S complex mutation before and after four weeks of afatinib treatment. Red arrow indicates resolved pleural effusion on the left lobe and reduced pleural effusion and tumor in the right lobe. h, In silico modeling of EGFR Ex19del G796S (purple) with osimertinib in the reactive (blue) and predicted (orange) conformations demonstrate destabilization of TKI-protein interactions in the hinge region (yellow), displacing the reactive group (arrow). i, In silico modeling of EGFR Ex19del G796S (purple) with the reactive conformation of poziotinib (blue) and the predicted conformation of poziotinib (orange) predicted minimal changes in poziotinib binding and similar TKI-protein interactions. Source data
Extended Data Fig. 9
Extended Data Fig. 9. 2nd-gen TKIs confer durable clinical benefit in patients with acquired osimertinib-resistant NSCLC.
a, Representative CT images from a patient after 5.5 months  of osimertinib and 6 months after afatinib treatment. Red arrow indicates lesion harboring L858R/L718V. b, CT scan of a patient after 17 months of osimertinib treatment showed new pleural lesion that tested positive for both EGFR L858R and L718V mutations (red arrow), and CT image of patient four weeks after beginning poziotinib treatment shows reduction in size of the pleural lesion (red arrow). Blue arrow indicates resolved pleural effusion. a, b, Schematic below CT images shows timeline of patient treatments and outcomes. c, Schematic representations of a patient treatments and outcomes that acquired two PACC mutations (V765L and C797S) after 18 months of osimertinib treatment. PR = partial response, PD = progressive disease, SD = stable disease, SRS = stereotactic radiosurgery Chemo/IO = carboplatin/ pemetrexed+ pembrolizumab.
Extended Data Fig. 10
Extended Data Fig. 10. Structure-function groups identify patients with greater benefit to 2nd-gen TKIs than exon-based groups.
a, b, Overall response rate to afatinib stratified by structure-function-based groups (N= 507: Classical-like N=91, T790M-like N=103, Ex20ins-L N=120, and PACC N=193) (a) or exon based groups (N= 528: Exon 18 N=133, Exon 19 N=22, Exon 20 N=294, Exon 21 N=79) (b). When mutations were not explicitly stated (N=21), those patients were excluded from the structure-function based analysis. c, Kaplan-Meier plot of duration of afatinib treatment of patients with NSCLC tumors harboring atypical EGFR mutations (N= 364 patients) stratified by exon-based groups. Exon 18 N=87, Exon 19 N=19, Exon 20 N=195, and Exon 21 N=63. d, Kaplan-Meier plot of TTF of patients with NSCLC harboring non-PACC atypical EGFR mutations (N= 56) treated with 1st- (N=25), 2nd- (N=13), or 3rd-gen (N=18) EGFR TKIs. Forrest plot comparing PACC and non-PACC mutants can be found in Fig. 4d. eh, Kaplan-Meier plots of TTF of patients atypical EGFR mutations stratified by EGFR TKI class for exons 18 (N=40) (e), 19 (N=19) (f), 20 (N=24) (g), and 21 (N=26) (h). Forrest plot comparing HRs and p-values across exons can be found in Fig. 4d. Source data

Comment in

References

    1. Russo A, et al. Heterogeneous responses to epidermal growth factor receptor (EGFR) tyrosine kinase inhibitors (TKIs) in patients with uncommon EGFR mutations: new insights and future perspectives in this complex clinical scenario. Int. J. Mol. Sci. 2019;20:1431. doi: 10.3390/ijms20061431. - DOI - PMC - PubMed
    1. Kobayashi Y, et al. EGFR exon 18 mutations in lung cancer: molecular predictors of augmented sensitivity to afatinib or neratinib as compared with first- or third-generation TKIs. Clin. Cancer Res. 2015;21:5305–5313. doi: 10.1158/1078-0432.CCR-15-1046. - DOI - PubMed
    1. Klughammer B, et al. Examining treatment outcomes with erlotinib in patients with advanced non-small cell lung cancer whose tumors harbor uncommon EGFR mutations. J. Thorac. Oncol. 2016;11:545–555. doi: 10.1016/j.jtho.2015.12.107. - DOI - PubMed
    1. Rosell R, et al. Erlotinib versus standard chemotherapy as first-line treatment for European patients with advanced EGFR mutation-positive non-small-cell lung cancer (EURTAC): a multicentre, open-label, randomised phase 3 trial. Lancet Oncol. 2012;13:239–246. doi: 10.1016/S1470-2045(11)70393-X. - DOI - PubMed
    1. Sequist LV, et al. Phase III study of afatinib or cisplatin plus pemetrexed in patients with metastatic lung adenocarcinoma with EGFR mutations. J. Clin. Oncol. 2013;31:3327–3334. doi: 10.1200/JCO.2012.44.2806. - DOI - PubMed

Publication types