. 2021 Aug 30:12:723152.
doi: 10.3389/fmicb.2021.723152. eCollection 2021.

Respiratory Microbiota Profiles Associated With the Progression From Airway Inflammation to Remodeling in Mice With OVA-Induced Asthma

Affiliations

Respiratory Microbiota Profiles Associated With the Progression From Airway Inflammation to Remodeling in Mice With OVA-Induced Asthma

Jun Zheng et al. Front Microbiol. .

Abstract

Background: The dysbiosis of respiratory microbiota plays an important role in asthma development. However, there is limited information on the changes in the respiratory microbiota and how these affect the host during the progression from acute allergic inflammation to airway remodeling in asthma.

Objective: An ovalbumin (OVA)-induced mouse model of chronic asthma was established to explore the dynamic changes in the respiratory microbiota in the different stages of asthma and their association with chronic asthma progression.

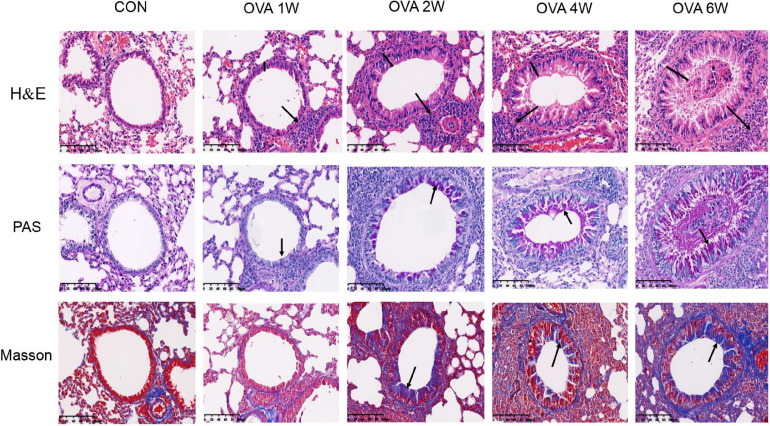
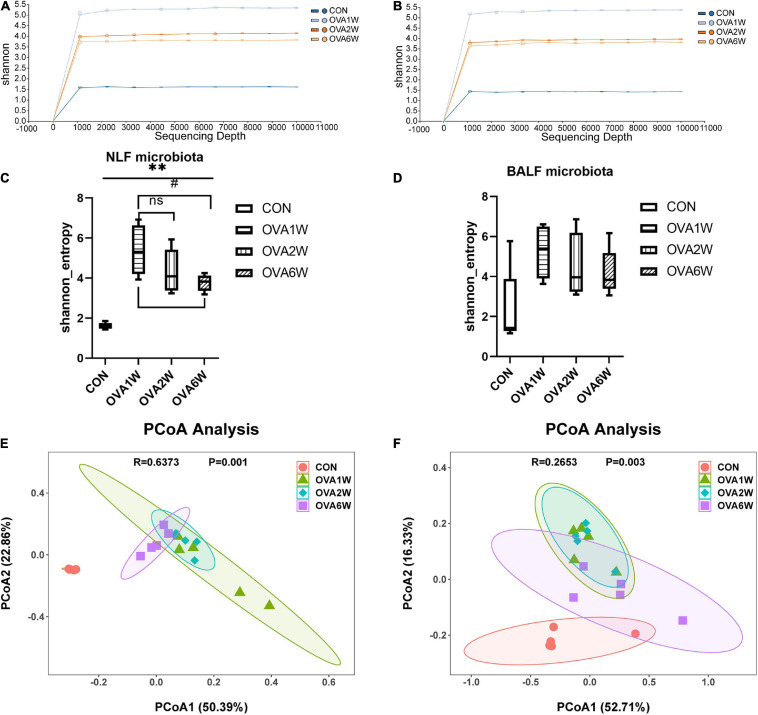
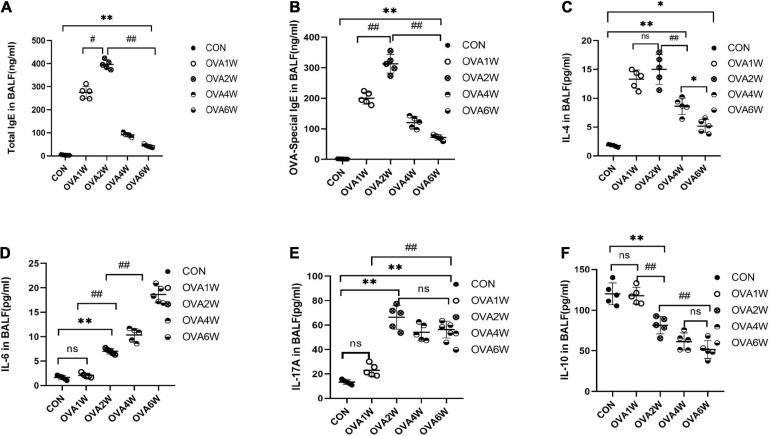
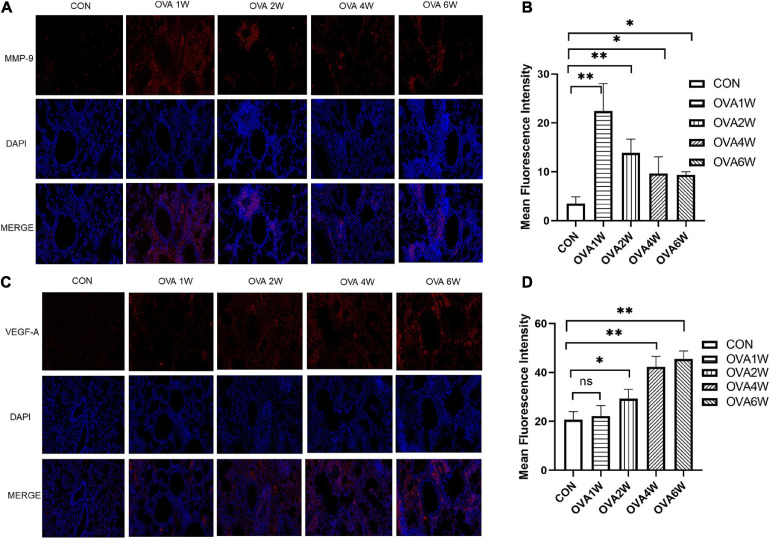
Methods: Hematoxylin and eosin (H&E), periodic acid-schiff (PAS), and Masson staining were performed to observe the pathological changes in the lung tissues of asthmatic mice. The respiratory microbiota was analyzed using 16S rRNA gene sequencing followed by taxonomical analysis. The cytokine levels in bronchoalveolar lavage fluid (BALF) specimens were measured. The matrix metallopeptidase 9 (MMP-9) and vascular endothelial growth factor (VEGF-A) expression levels in lung tissues were measured to detect airway remodeling in OVA-challenged mice.

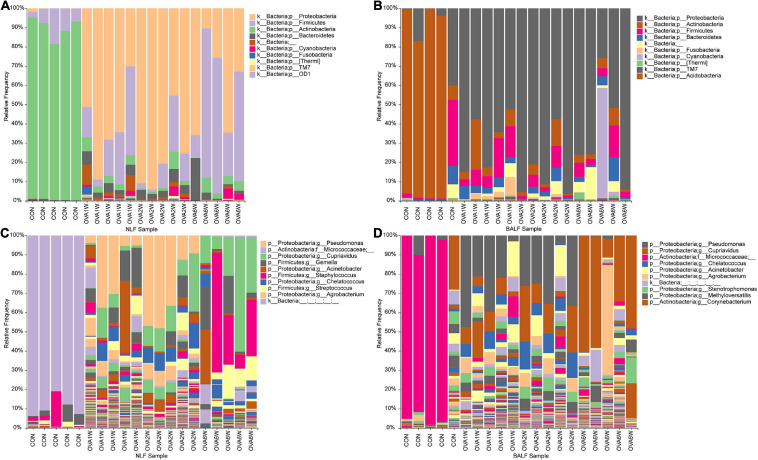
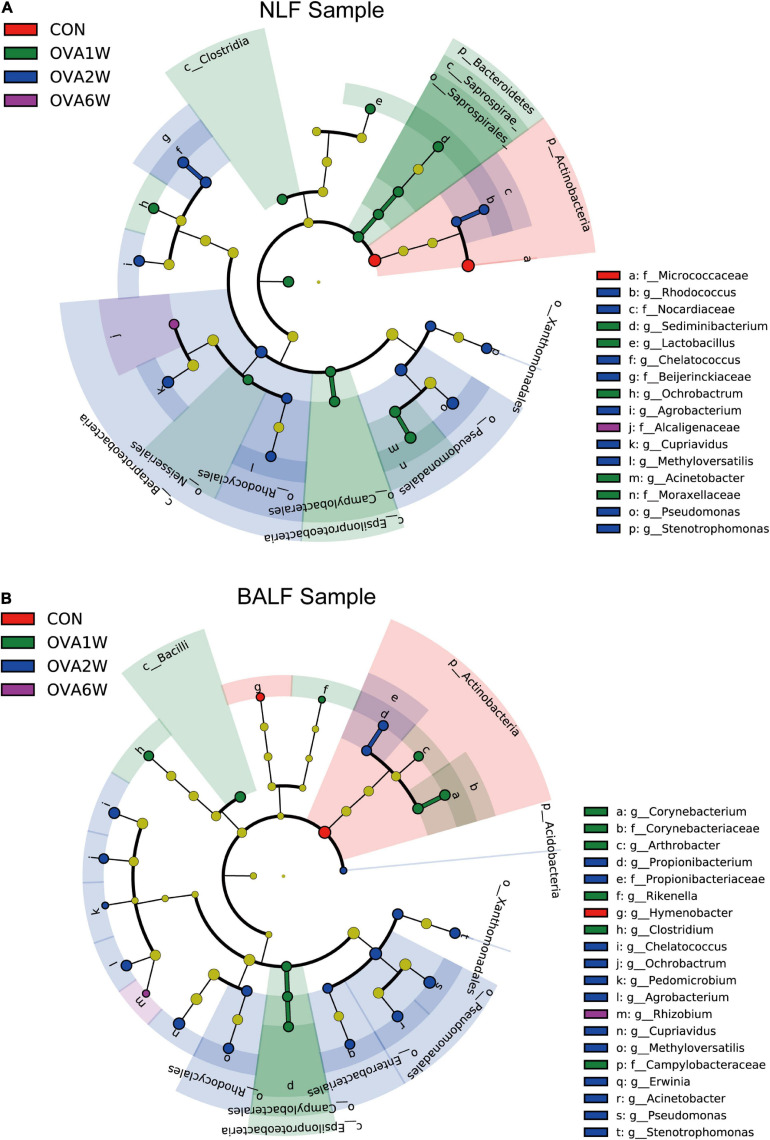
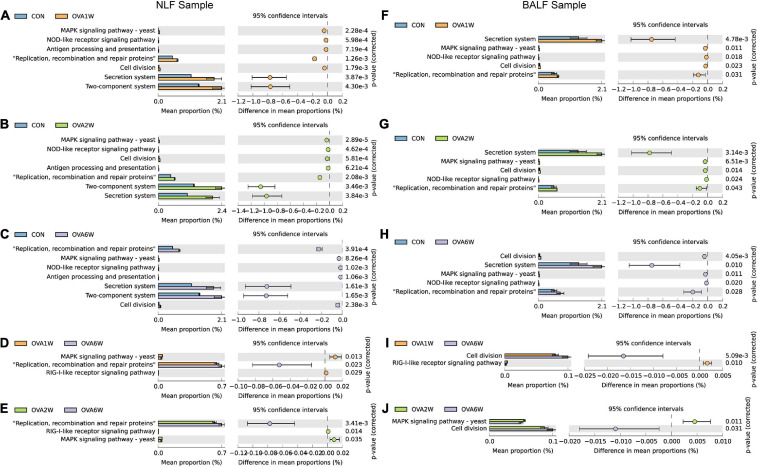
Results: Acute allergic inflammation was the major manifestation at weeks 1 and 2 after OVA atomization stimulation, whereas at week 6 after the stimulation, airway remodeling was the most prominent observation. In the acute inflammatory stage, Pseudomonas was more abundant, whereas Staphylococcus and Cupriavidus were more abundant at the airway remodeling stage. The microbial compositions of the upper and lower respiratory tracts were similar. However, the dominant respiratory microbiota in the acute inflammatory and airway remodeling phases were different. Metagenomic functional prediction showed that the pathways significantly upregulated in the acute inflammatory phase and airway remodeling phase were different. The cytokine levels in BALF and the expression patterns of proteins associated with airway remodeling in the lung tissue were consistent with the metagenomic function results.

Conclusion: The dynamic changes in respiratory microbiota are closely associated with the progression of chronic asthma. Metagenomic functional prediction indicated the changes associated with acute allergic inflammation and airway remodeling.

Keywords: airway inflammation; airway remodeling; asthma; metagenomic functional prediction; respiratory microbiota.


Conflict of interest statement

The authors declare that the research was conducted in the absence of any commercial or financial relationships that could be construed as a potential conflict of interest.

Figures

FIGURE 1
FIGURE 1
Sensitization-challenge protocols for mice with OVA-induced asthma.
FIGURE 2
FIGURE 2
Changes in the pulmonary pathology of mice with OVA-induced chronic asthma. Representative hematoxylin and eosin (H&E)-stained lung sections showing inflammatory cell infiltration around the small airways, bronchial wall thickening, and constriction (200×; the black arrows indicate the aggregation of inflammatory cells, and the black vertical line indicates the airway wall thickness). PAS staining indicating the mucus-producing goblet cells around the small airways (200×; similar to the purple area indicated by the black arrow). Masson’s trichome staining indicating collagen fiber deposition around small airways (200×; similar to the blue area indicated by the black arrow).
FIGURE 3
FIGURE 3
Diversity of the respiratory microbiota in mice with OVA-induced chronic asthma. (A) The alpha rarefaction curve in NLF microbiota; (B) The alpha rarefaction curve in BALF microbiota; (C) α diversity analysis (using Shannon index) of the NLF microbiota; (D) α diversity analysis (using Shannon index) of the BALF microbiota; (E) PCoA plot showing the β diversity of NLF microbiota (P = 0.001); (F) PCoA plot showing the β diversity of BALF microbiota (P = 0.003). PCoA of all samples using weighted UniFrac distance. PCoA, principal coordinates analysis. (n = 5 in each group).
FIGURE 4
FIGURE 4
Microbial composition in the URT and LRT at the phylum and genus levels. (A) The composition of URT microbiota (NLF samples) at the phylum level. (B) The composition of LRT microbiota (BALF samples) at the phylum level. (C) The composition of URT microbiota (NLF samples) at the genus level. (D) The composition of the LRT microbiota (BALF samples) at the genus level (n = 5 in each group; only the top 10 legends with high abundance are shown).
FIGURE 5
FIGURE 5
Different abundances of bacterial communities in the respiratory samples, as indicated in LEfSe analysis. The differences are indicated by the color of over-represented taxa: red indicating control mice, green indicating OVA1W mice, blue indicating OVA2W mice and purple indicating OVA6W mice. (A) Different abundances of bacterial communities in the URT (NLF samples) with LDA scores > 2.6. (B) Different abundances of bacterial communities in the LRT (BALF samples) with LDA scores > 2.5. The circles represent phylogenetic levels from phylum (innermost circle) to genera (outermost circle). n = 5 in each group; adjusted P values ≤ 0.05.
FIGURE 6
FIGURE 6
Metagenomic functional prediction of the respiratory microbiota using PICRUSt. Bacterial metagenomic functional categories were derived from level 3 KEGG pathways. Gene functions with a significant difference (corrected P value < 0.05) and parts of the pathways associated with asthma are shown. (A) Control group vs OVA1W group in URT samples. (B) Control group vs OVA2W group in URT samples. (C) Control group vs OVA6W group in URT samples. (D) OVA1W group vs OVA6W group in URT samples. (E) OVA2W group vs OVA6W group in URT samples. (F) Control group vs OVA1W group in LRT samples. (G) Control group vs OVA2W group in LRT samples. (H) Control group vs OVA6W group in LRT samples. (I) OVA1W group vs OVA6W group in LRT samples. (J) OVA2W group vs OVA6W group in LRT samples.
FIGURE 7
FIGURE 7
Levels of IgE and inflammatory cytokines in BALF samples. BALF was collected from control mice and OVA-challenged asthmatic mice to measure the levels of total IgE (A), OVA-specific IgE (B), IL-4 (C), IL-6 (D), IL-17A (E), and IL-10 (F) using ELISA. Data are expressed as mean ± SD, tested using one-way ANOVA. n = 5, *P ≤ 0.05 vs the control group, **P ≤ 0.01 vs the control group; #P ≤ 0.05 vs group OVA2W, ##P ≤ 0.01 vs group OVA2W. ns: no difference.
FIGURE 8
FIGURE 8
Expression of MMP-9 and VEGF-A proteins in lung tissues. (A) Immunofluorescent staining of MMP-9 (200×, red: MMP-9; blue: DAPI). (B) Mean fluorescence intensity of MMP-9. Each bar represents the mean ± SD (n = 6, *P ≤ 0.05 vs the control group; **P ≤ 0.01 vs the control group). (C) Immunofluorescent staining of VEGF-A (200×, red: VEGF-A; blue: DAPI). (D) Mean fluorescence intensity of VEGF-A. Each bar represents the mean ± SD (n = 6, *P ≤ 0.05 vs the control group; **P ≤ 0.01 vs the control group; ns: no difference).

References

    1. Banno A., Reddy A. T., Lakshmi S. P., Reddy R. C. (2020). Bidirectional interaction of airway epithelial remodeling and inflammation in asthma. Clin. Sci. 134 1063–1079. 10.1042/cs20191309 - DOI - PubMed
    1. Bao A., Yang H., Ji J., Chen Y., Bao W., Li F., et al. (2017). Involvements of p38 MAPK and oxidative stress in the ozone-induced enhancement of AHR and pulmonary inflammation in an allergic asthma model. Respir. Res. 18:216. 10.1186/s12931-017-0697-4 - DOI - PMC - PubMed
    1. Barcik W., Boutin R. C. T., Sokolowska M., Finlay B. B. (2020). The Role of Lung and Gut Microbiota in the Pathology of Asthma. Immunity 52 241–255. 10.1016/j.immuni.2020.01.007 - DOI - PMC - PubMed
    1. Bokulich N. A., Dillon M. R., Bolyen E., Kaehler B. D., Huttley G. A., Caporaso J. G. (2018). q2-sample-classifier: machine-learning tools for microbiome classification and regression. J. Open Res. Softw. 3:934. 10.21105/joss.00934 - DOI - PMC - PubMed
    1. Boonpiyathad T., Satitsuksanoa P., Akdis M., Akdis C. A. (2019). Il-10 producing T and B cells in allergy. Semin. Immunol. 44:101326. 10.1016/j.smim.2019.101326 - DOI - PubMed