. 2021 Aug 30:12:728429.
doi: 10.3389/fmicb.2021.728429. eCollection 2021.

Differential Early in vivo Dynamics and Functionality of Recruited Polymorphonuclear Neutrophils After Infection by Planktonic or Biofilm Staphylococcus aureus

Affiliations

Differential Early in vivo Dynamics and Functionality of Recruited Polymorphonuclear Neutrophils After Infection by Planktonic or Biofilm Staphylococcus aureus

Aizat Iman Abdul Hamid et al. Front Microbiol. .

Abstract

Staphylococcus aureus is a human pathogen known for its capacity to shift between the planktonic and biofilm lifestyles. In vivo, the antimicrobial immune response is characterized by the recruitment of inflammatory phagocytes, namely polymorphonuclear neutrophils (PMNs) and monocytes/macrophages. Immune responses to planktonic bacteria have been extensively studied, but many questions remain about how biofilms can modulate inflammatory responses and cause recurrent infections in live vertebrates. Thus, the use of biologically sound experimental models is essential to study the specific immune signatures elicited by biofilms. Here, a mouse ear pinna model of infection was used to compare early innate immune responses toward S. aureus planktonic or biofilm bacteria. Flow cytometry and cytokine assays were carried out to study the inflammatory responses in infected tissues. These data were complemented with intravital confocal imaging analyses, allowing the real-time observation of the dynamic interactions between EGFP + phagocytes and bacteria in the ear pinna tissue of LysM-EGFP transgenic mice. Both bacterial forms induced an early and considerable recruitment of phagocytes in the ear tissue, associated with a predominantly pro-inflammatory cytokine profile. The inflammatory response was mostly composed of PMNs in the skin and the auricular lymph node. However, the kinetics of PMN recruitment were different between the 2 forms in the first 2 days post-infection (pi). Two hours pi, biofilm inocula recruited more PMNs than planktonic bacteria, but with decreased motility parameters and capacity to emit pseudopods. Inversely, biofilm inocula recruited less PMNs 2 days pi, but with an "over-activated" status, illustrated by an increased phagocytic activity, CD11b level of expression and ROS production. Thus, the mouse ear pinna model allowed us to reveal specific differences in the dynamics of recruitment and functional properties of phagocytes against biofilms. These differences would influence the specific adaptive immune responses to biofilms elicited in the lymphoid tissues.

Keywords: Staphylococcus aureus; biofilm; innate immunity; intravital imaging; macrophages; murine model; polymorphonuclear neutrophils.


Conflict of interest statement

The authors declare that the research was conducted in the absence of any commercial or financial relationships that could be construed as a potential conflict of interest.

Figures
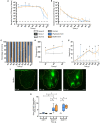
FIGURE 1
FIGURE 1
Bacterial load and inflammatory responses in S. aureus infected tissue. (A,B) Bacterial load quantification, expressed in CFUs/mg of tissue, from 2 h pi to day 7 pi, and at day 10 pi in the ear pinnae (A) and dLNs (B) of WT C57BL/6J mice following micro-injection of PBS (C) or WT SH1000 planktonic (P) or biofilm (B) bacteria. Dotted line represents the limit of detection (median ± IQR, number of ear pinnae: NC = 8–10 ear pinnae, NP = 10–12 ear pinnae, NBF = 11–12 ear pinnae, from 3 different experiments, Mann-Whitney two-tailed test, p < 0.05). (C) Evaluation of ear pinnae inflammation from 2 h pi to day 7 pi, and at day 10 pi for the 3 groups of mice, by scoring based on erythema. Results expressed as percentage of each score (Number of mice: NC = 6–10 mice, NP = 4–17 mice, NBF = 5–13 mice, from 3 different experiments). (D) Ear pinna thickness measurements from 2 h pi to day 2 pi for the 3 groups of mice (median ± IQR, number of ear pinnae: NC = 4–7 ear pinnae, NP = 6–8 ear pinnae, NBF = 6–7 ear pinnae, from 3 different experiments, Mann-Whitney two-tailed test, p < 0.05). (E) dLN weight measurements from 2 h pi to day 7 pi, and at day 10 pi for the 3 groups of mice (median ± IQR, number of dLNs: NC = 8–10 dLNs, NP = 10–12 dLNs, NBF = 11–12 dLNs, from 3 different experiments, Mann-Whitney two-tailed test, p < 0.05). (F) Reconstituted confocal images of LysM-EGFP transgenic mouse ear pinna tissue following micro-injection of mCherry-SH1000 biofilm bacteria. Images correspond to the maximal projection intensities of the EGFP signal, and the yellow line indicates the ROI where the “Sum of EGFP fluorescence intensities” was measured. Scale bar: 2 mm. One representative image is shown from at least 3 independent experiments. (G) Ratio of the sum of EGFP fluorescence intensities to ROI areas (median ± IQR, number of ear pinnae tissues: NC = 4, NP = 5–8, NBF = 4–9, from at least 3 different experiments, Mann-Whitney two-tailed test, p < 0.05).
FIGURE 2
FIGURE 2
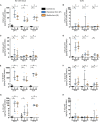
Chemokine and cytokine production in S. aureus infected tissue. (A–H) Chemokine (A–D) and cytokine (E–H) levels, expressed in pg/mg of total protein, analyzed by Bioplex in the supernatants of ear pinna tissues (A,C,E,G) and dLNs (B,D,F,H) homogenates at 24, 48, and 72 h pi (median ± IQR, number of mice: NC = 5–8, NP = 6–10, NBF = 6–9, from at least 3 different experiments, Mann-Whitney two-tailed test, p < 0.05).
FIGURE 3
FIGURE 3
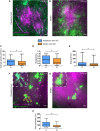
Early dynamics of recruited EGFP + cells in the skin of S. aureus infected tissue. (A,B) Live confocal imaging, using X10 objectives, in the ear pinna tissue of LysM-EGFP transgenic mice following micro-injection of mCherry-SH1000 planktonic (A) or biofilm (B) bacteria. Average projections of green (EGFP + innate immune cells) and magenta (mCherry-SH1000) fluorescence, acquired at 2.50 h pi (A) and 2.55 h pi (B), show immune cells recruited toward the injection site. Asterisk: autofluorescent hair (also in magenta). Scale bar: 100 μm. One representative experiment is shown for each group of mice from at least 9 independent experiments. (C–E) Quantification of EGFP + innate immune cell average speed (C), straightness (D), and displacement (E), from X20 time-lapse acquisitions of infected mice (median ± minimum and maximum values, number of cells: NP = 209, NBF = 126, from at least 3 different experiments, Mann-Whitney two-tailed test, p < 0.05). (F,G) Live confocal imaging, using X40 objectives, in the ear pinna tissue of LysM-EGFP transgenic mice following micro-injection of mCherry-SH1000 planktonic (F) or biofilm (G) bacteria. Maximum projections of green (EGFP + innate immune cells) and magenta (mCherry bacteria) fluorescence, acquired at 3.35 h pi (F) and 3.45 h pi (G), show immune cells interacting with bacteria. The yellow line indicates the ROI where cell perimeter was measured. Scale bar: 15 μm. One representative experiment is shown for each group of mice from at least 9 independent experiments. (H) Measure of EGFP + innate immune cell perimeter, from maximum projection time-lapse acquisitions of infected mice (median ± minimum and maximum values, number of cells: NP = 19, NBF = 25, from 4 different experiments, Mann-Whitney one-tailed test, p < 0.05).
FIGURE 4
FIGURE 4
Myeloid cell recruitment in the skin of S. aureus infected tissue. (A) Flow cytometric analysis showing the gating strategy of myeloid cells (CD45+CD11b+, left plot—upper right region), PMNs (Ly6G+Ly6C+, right plot—right most region), MOs/MΦs (Ly6G Ly6Chi, right plot—upper left). Representative dot plots and percentages of cells gated are shown from planktonic infected WT C57BL/6J mice at 48 h pi. (B) Total number of myeloid cells among live cells in ear pinna tissue of control and planktonic or biofilm infected mice from 2 h pi to day 2 pi (median ± IQR, number of mice: NC = 12–15, NP = 9–12, NBF = 9–15, from at least 3 different experiments, Mann-Whitney two-tailed test, p < 0.05). (C–E) Percentages (C) and total numbers (D,E) of PMNs (C,D) and MOs/MΦs (E) among myeloid cells in ear pinnae of control and planktonic or biofilm infected mice, from 2 h pi to day 2 pi (median ± IQR, number of mice: NC = 12–15, NP = 9–12, NBF = 9–15, from at least 3 different experiments, Mann-Whitney two-tailed test, p < 0.05).
FIGURE 5
FIGURE 5
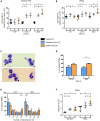
Myeloid cell recruitment in the auricular draining lymph nodes of S. aureus infected mice. (A–D) Percentages (A,C) and total numbers (B,D) of PMNs (A,B) and MOs/MΦs (C,D) among myeloid cells in dLNs of control and planktonic or biofilm infected mice, from 2 h pi to day 2 pi (median ± IQR, number of mice: NC = 12–15, NP = 8–12, NBF = 9–15, from at least 3 different experiments, Mann-Whitney two-tailed test, p < 0.05).
FIGURE 6
FIGURE 6
Biofilm bacteria associated myeloid cells in the skin of S. aureus infected mice. (A) Flow cytometric analysis showing the gating strategy to analyze GFP-SH1000 associated cells among myeloid cells (CD45+CD11b+GFP+), PMNs (Ly6G+Ly6C+GFP+), and MOs/MΦs (Ly6G Ly6ChiGFP+). Representative histogram is shown from planktonic infected WT C57BL/6J mice at 48 h pi. (B–D) Total number of bacteria associated myeloid cells (B), PMNs (C), and MOs/MΦs (D) in ear pinna tissue of control and planktonic or biofilm infected mice, from 2 h pi to day 2 pi (median ± IQR, number of mice: NC = 12–15, NP = 9–12, NBF = 9–15, from at least 3 different experiments, Mann-Whitney two-tailed test, p < 0.05).
FIGURE 7
FIGURE 7
Functional properties of neutrophils recruited in the ear pinna tissue of S. aureus infected mice. (A,B) APC-Cy7 conjugated CD11b antibody MFI of myeloid cells (CD45+CD11b+) (A) and PMNs (Ly6G+Ly6C+) (B) in ear pinna tissue of control and planktonic or biofilm infected mice, from 2 h pi to day 2 pi (median ± IQR, number of mice: NC = 8–11, NP = 6–9, NBF = 6–12, from at least 3 different experiments, Mann-Whitney two-tailed test, p < 0.05). (C) Transmitted light images of CD11b+ cells, following isolation from ear pinna tissue onto glass slides and MGG staining, show neutrophils harboring intracellular bacteria. Representative images are shown from planktonic infected WT C57BL/6J mice at 24 h pi. (D) Percentage of PMNs containing intracellular bacteria assessed at 24 and 48 h pi (mean ± SEM, number of cells: NP = 223–238, NBF = 232–338, from at least 3 different experiments, Mann-Whitney one-tailed test, p < 0.05). (E) Percentage of PMNs containing 0, 1–2, 3–4, or 5 or more intracellular bacteria assessed at 24 and 48 h pi (mean ± SEM, number of cells: NP = 223–238, NBF = 232–338, from at least 3 different experiments, Mann-Whitney one-tailed test, p < 0.05). (F) DHR MFI of PMNs, in the ear pinna tissue of control and planktonic or biofilm infected mice at day 2 pi, stimulated or not with PMA ex vivo in the presence of DHR, to assess NADPH oxidase activity (median ± IQR, number of mice: NC = 4, NP/BF = 8, from at least 3 different experiments, Mann-Whitney one-tailed test, p < 0.05).

References

    1. Abdul Hamid A. I., Nakusi L., Givskov M., Chang Y.-T., Marquès C., Gueirard P. (2020). A mouse ear skin model to study the dynamics of innate immune responses against Staphylococcus aureus biofilms. BMC Microbiol. 20:22. 10.1186/s12866-019-1635-z - DOI - PMC - PubMed
    1. Arciola C. R., Campoccia D., Montanaro L. (2018). Implant infections: adhesion, biofilm formation and immune evasion. Nat. Rev. Microbiol. 16 397–409. 10.1038/s41579-018-0019-y - DOI - PubMed
    1. Bhattacharya M., Berends E. T. M., Zheng X., Hill P. J., Chan R., Torres V. J., et al. (2020). Leukocidins and the nuclease nuc prevent neutrophil-mediated killing of Staphylococcus aureus biofilms. Infect. Immun. 88 e00372-20. 10.1128/IAI.00372-20 - DOI - PMC - PubMed
    1. Bjarnsholt T. (2013). The role of bacterial biofilms in chronic infections. APMIS Suppl. 121 1–51. 10.1111/apm.12099 - DOI - PubMed
    1. Borbón T. Y., Scorza B. M., Clay G. M., de Queiroz F. L. N., Sariol A. J., Bowen J. L., et al. (2019). Coinfection with Leishmania major and Staphylococcus aureus enhances the pathologic responses to both microbes through a pathway involving IL-17A. PLoS Negl. Trop. Dis. 13:e0007247. 10.1371/journal.pntd.0007247 - DOI - PMC - PubMed