. 2021 Aug 30:12:701065.
doi: 10.3389/fgene.2021.701065. eCollection 2021.

Identification of Tumor Antigens and Immune Landscape in Glioblastoma for mRNA Vaccine Development

Affiliations

Identification of Tumor Antigens and Immune Landscape in Glioblastoma for mRNA Vaccine Development

Liguo Ye et al. Front Genet. .

Abstract

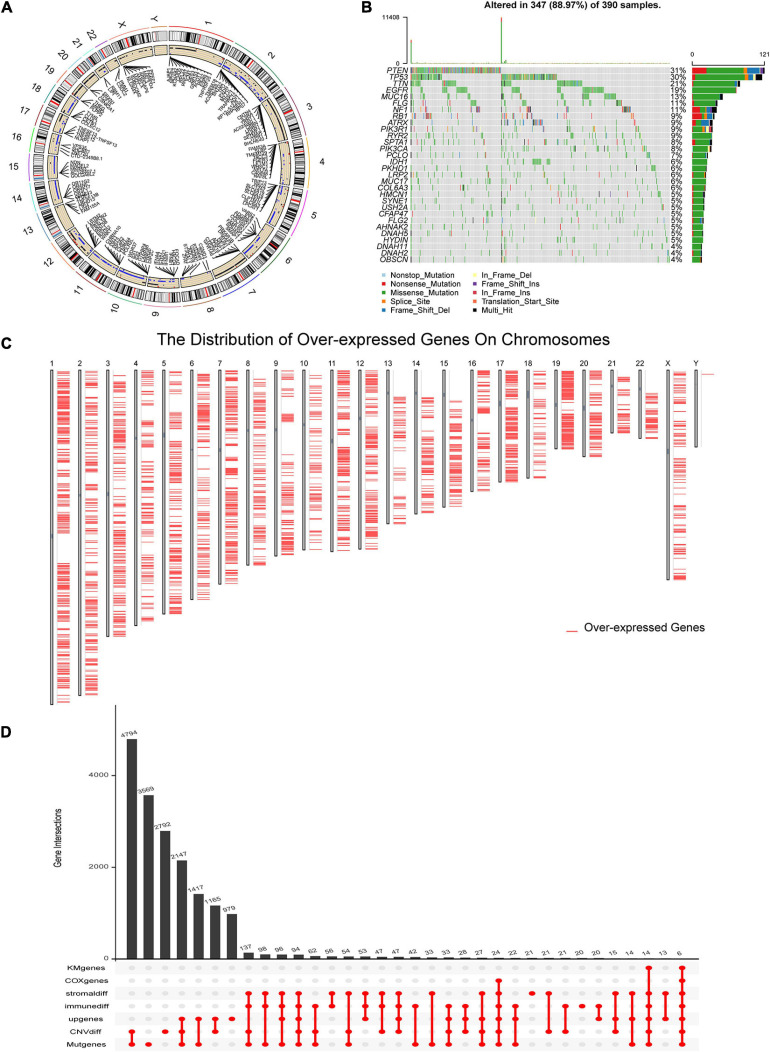
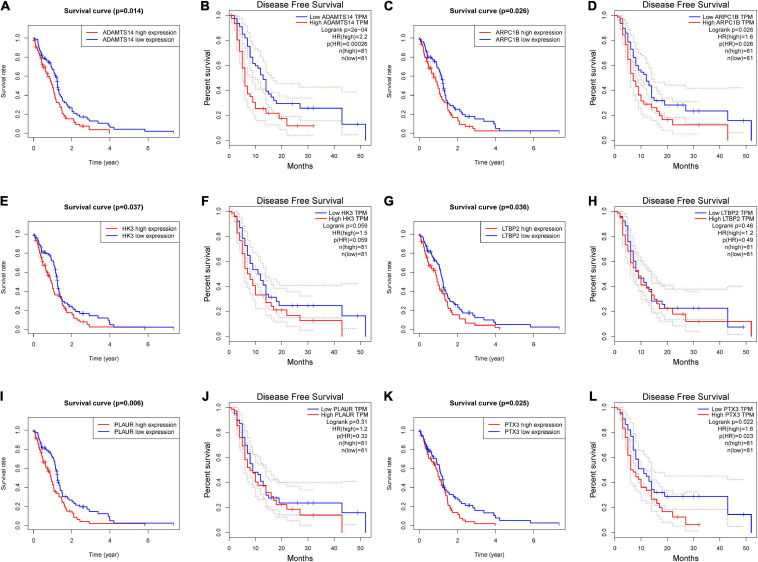
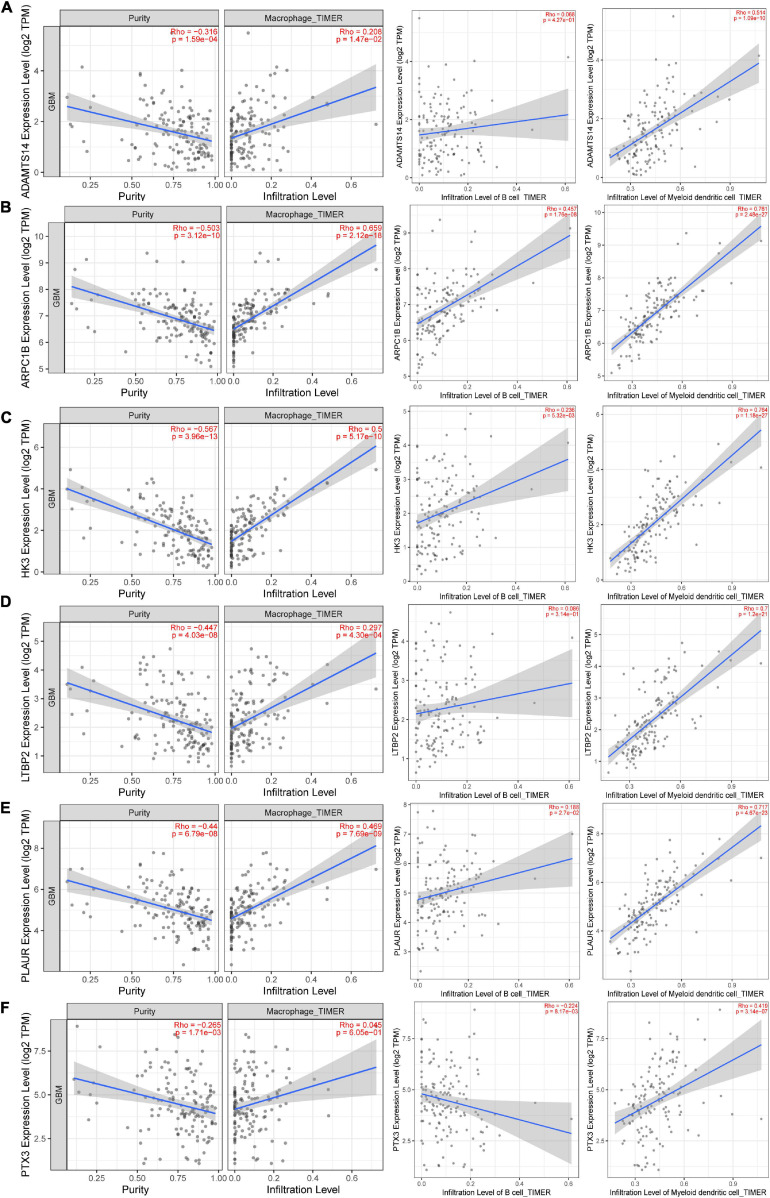
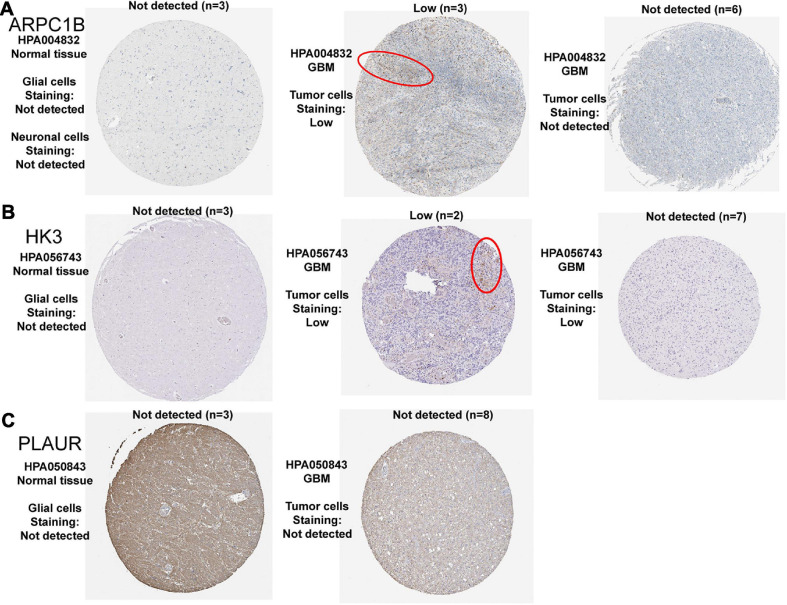
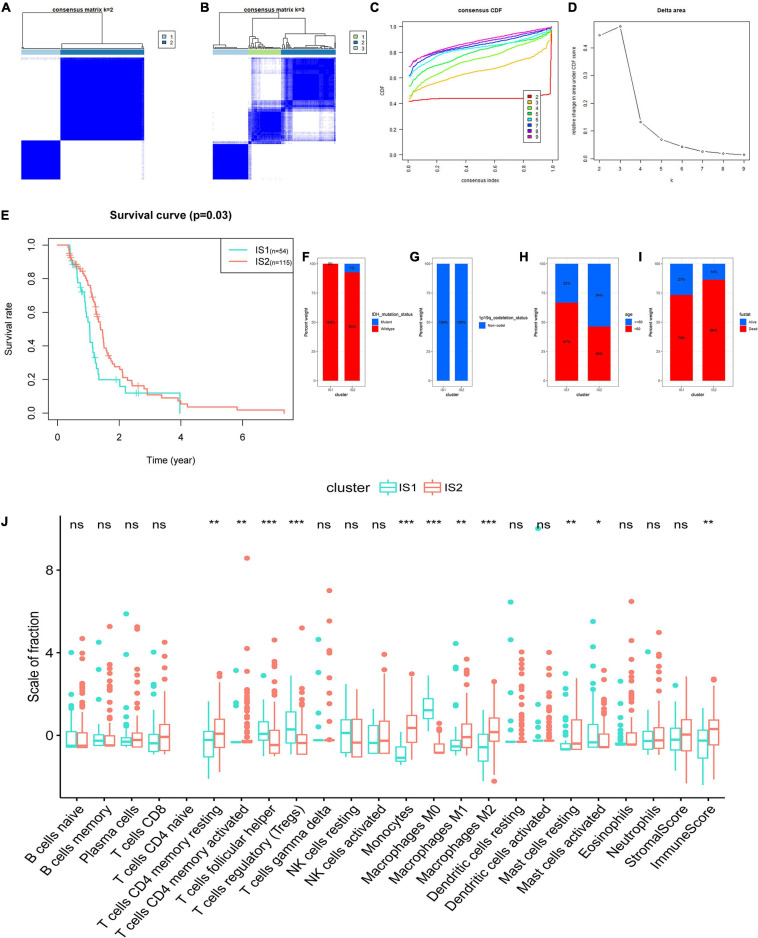
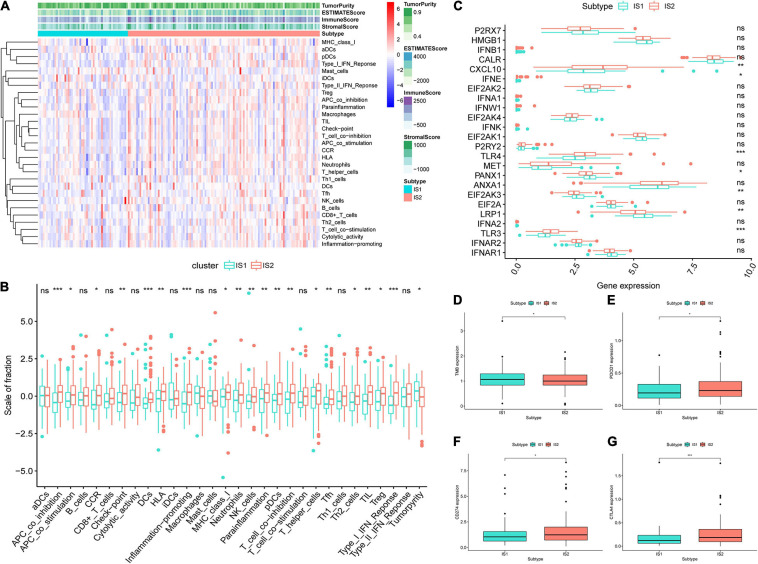
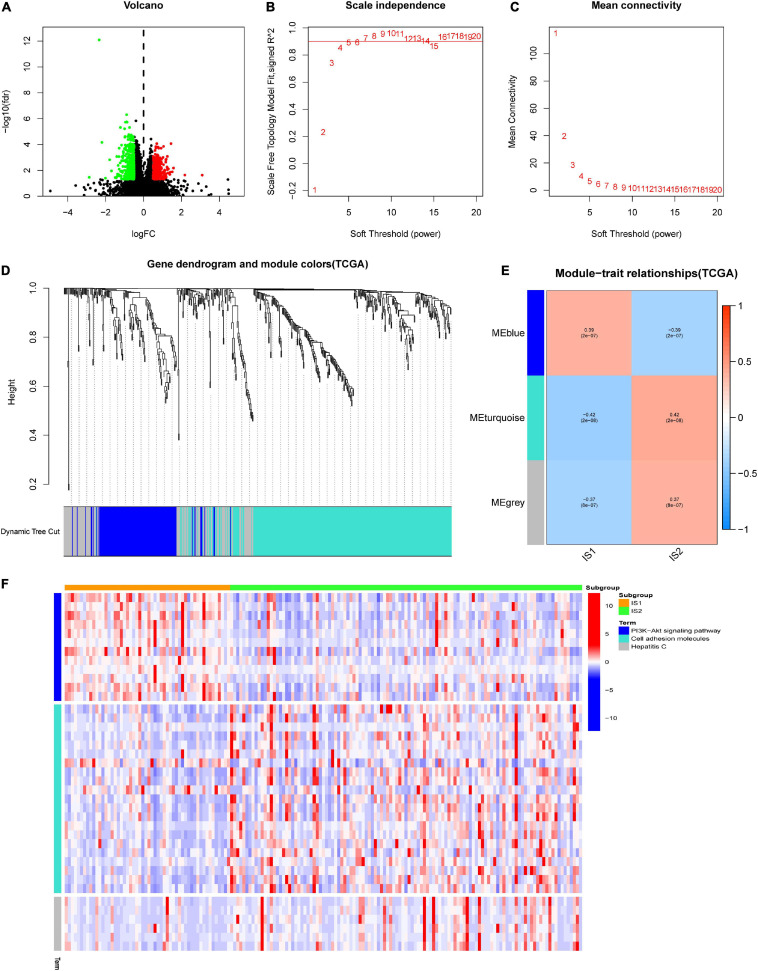
Background: Clinical benefits from standard therapies against glioblastoma (GBM) are limited in part due to the intrinsic radio- and chemo-resistance. As an essential part of tumor immunotherapy for adjunct, therapeutic tumor vaccines have been effective against multiple solid cancers, while their efficacy against GBM remains undefined. Therefore, this study aims to find the possible tumor antigens of GBM and identify the suitable population for cancer vaccination through immunophenotyping. Method: The genomic and responding clinical data of 169 GBM samples and five normal brain samples were obtained from The Cancer Genome Atlas (TCGA). The mRNA_seq data of 940 normal brain tissue were downloaded from Genotype-Tissue Expression (GTEx). Potential GBM mRNA antigens were screened out by differential expression, copy number variant (CNV), and mutation analysis. K-M survival and Cox analysis were carried out to investigate the prognostic association of potential tumor antigens. Tumor Immune Estimation Resource (TIMER) was used to explore the association between the antigens and tumor immune infiltrating cells (TIICs). Immunophenotyping of 169 samples was performed through consensus clustering based on the abundance of 22 kinds of immune cells. The characteristics of the tumor immune microenvironment (TIME) in each cluster were explored through single-sample gene set enrichment analysis based on 29 kinds of immune-related hallmarks and pathways. Weighted gene co-expression network analysis (WGCNA) was performed to cluster the genes related to immune subtypes. Finally, pathway enrichment analyses were performed to annotate the potential function of modules screened through WGCNA. Results: Two potential tumor antigens selected were significantly positively associated with the antigen-presenting immune cells (APCs) in GBM. Furthermore, the expression of antigens was verified at the protein level by Immunohistochemistry. Two robust immune subtypes, immune subtype 1 (IS1) and immune subtype 2 (IS2), representing immune status "immune inhibition" and "immune inflamed", respectively, had distinct clinical outcomes in GBM. Conclusion: ARPC1B and HK3 were potential mRNA antigens for developing GBM mRNA vaccination, and the patients in IS2 were considered the most suitable population for vaccination in GBM.

Keywords: bioinformatics; cancer vaccination; glioblastoma; immunophenotyping; tumor antigens.


Conflict of interest statement

The authors declare that the research was conducted in the absence of any commercial or financial relationships that could be construed as a potential conflict of interest.

Figures

FIGURE 1
FIGURE 1
Identification of potential glioblastoma (GBM) vaccine mRNA antigens. (A) The chromosomal distribution of the genes with copy number variant (CNV) in GBM. (B) Waterfall plot of the distribution of the top 30 mutant genes in GBM. (C) Overexpressed genes and the location of the corresponding chromosome according to Gene Expression Profiling Interactive Analysis (GEPIA) dataset. (D) An Upset plot displays the intersections of genes screened under different conditions. GBM, glioblastoma; geneMut, mutant genes; CNVdiff, genes with different copy number variation; upgenes, upregulated genes in GBM; immunediff, differentially expressed genes among low and high immune score groups; stromaldiff, differentially expressed genes among low and high stromal score groups; COXgenes, the genes with P-value less than 0.05 in univariate Cox analysis; and KMgenes, the genes with P-value less than 0.05 in K-M survival analysis.
FIGURE 2
FIGURE 2
The prognostic value of six potential GBM mRNA antigens. K-M curves showed the overall survival (OS) and disease-free survival (DFS) of patients with GBM in the different expression levels of (A,B) ADAMTS14, (C,D) ARPC1B, (E,F) HK3, (G,H) LTBP2, (I,J) PLAUR, and (K,L) PTX3. Genes with P-value < 0.05 were considered significantly correlated to the prognosis of GBM. DFS, disease-free survival.
FIGURE 3
FIGURE 3
The association between six potential mRNA antigens and antigen-presenting immune cells (APCs). According to the Tumor Immune Estimation Resource (TIMER) 2.0 database, the correlation between tumor purity, the infiltration level of APCs (Macrophages, B cells, and myeloid dendritic cells), and the expression level (Log2 TPM) of (A) ADAMTS14, (B) ARPC1B, (C) HK3, (D) LTBP2, (E) PLAUR, and (F) PTX3. APCs, antigen-presenting cells.
FIGURE 4
FIGURE 4
Representative IHC images of three prognosis-related antigens in normal brain tissues and GBM tissues. (A) ARPC1B, (B) HK3, and (C) PLAUR.
FIGURE 5
FIGURE 5
Identification of immune subtypes of GBM based on the consensus clustering of the abundance of 22 kinds of tumor immune infiltrating cells (TIICs). (A) Consensus clustering matrix of 169 The Cancer Genome Atlas (TCGA)-GBM samples for k = 2 and (B) k = 3. (C) Consensus clustering CDF for k = 2 to k = 9. (D) Relative change in area under CDF curve for k = 2 to k = 9. (E) Survival analysis between the OS and two subtypes. Distribution ratio of (F) IDH mutation status, (G) 1p19q co-deletion status, (H) age group (cut off: 60 years old), and (I) survival status among immune subtype 1 (IS1)-immune subtype 2 (IS2) in TCGA-GBM. (J) The difference analysis of the abundance of immune cells and the stromal and immune scores in IS1 and IS2. Fustat: survival status. ***p < 0.001, **p < 0.01, *p < 0.05, ns: not significant.
FIGURE 6
FIGURE 6
Features of tumor immune microenvironment (TIME) in different immune subtypes. (A) Based on the results of single-sample gene-set enrichment analysis (ssGSEA) of 29 immune-related hallmarks and pathways in GBM samples, heatmap showed the different levels of tumor purity, ESTIMATE score, immune score and stromal score, and the distribution of enrichment scores (ESs) of each sample in IS1 and IS2. The darker the color, the greater the absolute value of the score. (B) The difference analysis of ES of each sample changes among IS2 and IS2 was shown in the boxplots. (C) Different expression levels of immune checkpoint (ICP) genes in IS1 and IS2. (D) The difference analysis of tumor mutational burden (TMB) between IS1 and IS2. Difference analysis of (E) PDCD1, (F) CD274, and (G) CTLA4 among two subtypes. ***p < 0.001, **p < 0.01, *p < 0.05, ns: not significant.
FIGURE 7
FIGURE 7
Weighted gene co-expression network analysis (WGCNA) of differential expressed genes (DEGs) between different immune subtypes in TCGA-GBM. (A) The volcano plot showed the differentially expressed genes among IS1 and IS2. The log∣FC ∣ > 1 and adjusted P-value < 0.05 were considered significant. The red dot represents the upregulated gene in IS2. Instead, the green dot represents the upregulated gene in IS1. The black dots mean no significant difference among the two groups. (B,C) Scale-free fit index and mean connectivity for various soft-thresholding powers (β). (D) DEGs were clustered using hierarchical clustering with a dynamic tree cut and merged based on a dissimilarity measure (1-TOM). (E) Relationship analysis between immune subtypes and modules. Color on the left represents a module, and red represents positive correlation, blue represents negative correlation, the darker the color, the stronger the correlation, and the value in brackets under the correlation coefficient is the calculated p-value. (F) Heatmap showed the expression level of different Kyoto Encyclopedia of Genes and Genomes (KEGG) terms involved DEGs of blue, turquoise, and gray module (MEgray) in IS1 and IS2, heat map colors correspond to the level of mRNA expression as indicated in the color range.

References

    1. Abella J. V. G., Galloni C., Pernier J., Barry D. J., Kjær S., Carlier M.-F., et al. (2016). Isoform diversity in the Arp2/3 complex determines actin filament dynamics. Nat. Cell Biol. 18 76–86. 10.1038/ncb3286 - DOI - PubMed
    1. Ansel K. M., Ngo V. N., Hyman P. L., Luther S. A., Förster R., Sedgwick J. D., et al. (2000). A chemokine-driven positive feedback loop organizes lymphoid follicles. Nature 18 248–262. 10.1038/35018581 - DOI - PubMed
    1. Bosch F. X., Ribes J., Díaz M., Cléries R. (2004). Primary liver cancer: worldwide incidence and trends. Gastroenterology 127 S5–S16. 10.1053/j.gastro.2004.09.011 - DOI - PubMed
    1. Charoentong P., Finotello F., Angelova M., Mayer C., Efremova M., Rieder D., et al. (2017). Pan-cancer immunogenomic analyses reveal genotype-immunophenotype relationships and predictors of response to checkpoint blockade. Cell Rep. 18 248–262. 10.1016/j.celrep.2016.12.019 - DOI - PubMed
    1. Chen B., Khodadoust M. S., Liu C. L., Newman A. M., Alizadeh A. A. (2018). Profiling Tumor Infiltrating Immune Cells with CIBERSORT. Methods Mol. Biol. 1711 243–259. 10.1007/978-1-4939-7493-1_12 - DOI - PMC - PubMed