

Phylodynamics reveals the role of human travel and contact tracing in controlling the first wave of COVID-19 in four island nations
- PMID: 34527282
- PMCID: PMC8344840
- DOI: 10.1093/ve/veab052
Phylodynamics reveals the role of human travel and contact tracing in controlling the first wave of COVID-19 in four island nations
Abstract
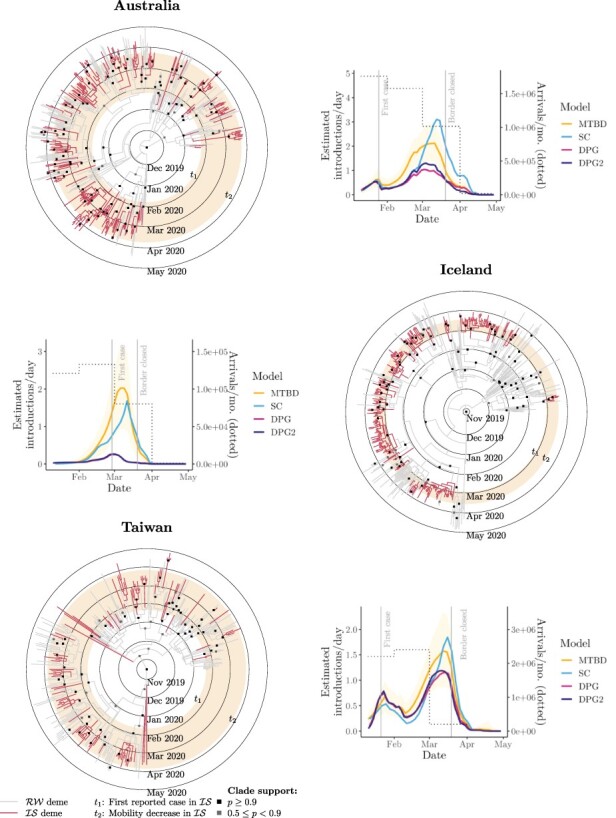
New Zealand, Australia, Iceland, and Taiwan all saw success in controlling their first waves of Coronavirus Disease 2019 (COVID-19). As islands, they make excellent case studies for exploring the effects of international travel and human movement on the spread of COVID-19. We employed a range of robust phylodynamic methods and genome subsampling strategies to infer the epidemiological history of Severe acute respiratory syndrome coronavirus 2 in these four countries. We compared these results to transmission clusters identified by the New Zealand Ministry of Health by contact tracing strategies. We estimated the effective reproduction number of COVID-19 as 1-1.4 during early stages of the pandemic and show that it declined below 1 as human movement was restricted. We also showed that this disease was introduced many times into each country and that introductions slowed down markedly following the reduction of international travel in mid-March 2020. Finally, we confirmed that New Zealand transmission clusters identified via standard health surveillance strategies largely agree with those defined by genomic data. We have demonstrated how the use of genomic data and computational biology methods can assist health officials in characterising the epidemiology of viral epidemics and for contact tracing.
Keywords: Australia; COVID-19; Iceland; New Zealand; Taiwan; contact tracing; coronavirus; human movement; phylogenomics.
© The Author(s) 2021. Published by Oxford University Press.
Conflict of interest statement
The authors have no conflicting interests to declare.
Figures
References
-
- Aljazeera (2020a) We Beat the Virus Again: COVID Restrictions in Auckland Lifted. <https://www.aljazeera.com/news/2020/10/5/new-zealandsardern-lifts-corona...> accessed 5 Oct 2020.
-
- —— (2020b) Australia Records Zero New COVID-19 Cases. <https://www.aljazeera.com/news/2020/11/1/national-donutaustralia-records...> accessed 1 Nov 2020.
-
- Apple (2020) Mobility Trends Reports. <https://www.apple.com/covid19/mobility> accessed 25 May 2020.
-
- Aspinwall N. (2020) Taiwan Closes Borders in Preparation for Possible Second Wave of the Coronavirus. The Diplomat. <https://thediplomat.com/2020/03/taiwan-closes-borders-in-preparation-for...> accessed 20 Mar 2020.
LinkOut - more resources
Full Text Sources
Research Materials
