. 2022 Aug 24;118(11):2519-2534.
doi: 10.1093/cvr/cvab296.

Single-cell RNA sequencing profiling of mouse endothelial cells in response to pulmonary arterial hypertension

Affiliations

Single-cell RNA sequencing profiling of mouse endothelial cells in response to pulmonary arterial hypertension

Julie Rodor et al. Cardiovasc Res. .

Abstract

Aims: Endothelial cell (EC) dysfunction drives the initiation and pathogenesis of pulmonary arterial hypertension (PAH). We aimed to characterize EC dynamics in PAH at single-cell resolution.

Methods and results: We carried out single-cell RNA sequencing (scRNA-seq) of lung ECs isolated from an EC lineage-tracing mouse model in Control and SU5416/hypoxia-induced PAH conditions. EC populations corresponding to distinct lung vessel types, including two discrete capillary populations, were identified in both Control and PAH mice. Differential gene expression analysis revealed global PAH-induced EC changes that were confirmed by bulk RNA-seq. This included upregulation of the major histocompatibility complex class II pathway, supporting a role for ECs in the inflammatory response in PAH. We also identified a PAH response specific to the second capillary EC population including upregulation of genes involved in cell death, cell motility, and angiogenesis. Interestingly, four genes with genetic variants associated with PAH were dysregulated in mouse ECs in PAH. To compare relevance across PAH models and species, we performed a detailed analysis of EC heterogeneity and response to PAH in rats and humans through whole-lung PAH scRNA-seq datasets, revealing that 51% of up-regulated mouse genes were also up-regulated in rat or human PAH. We identified promising new candidates to target endothelial dysfunction including CD74, the knockdown of which regulates EC proliferation and barrier integrity in vitro. Finally, with an in silico cell ordering approach, we identified zonation-dependent changes across the arteriovenous axis in mouse PAH and showed upregulation of the Serine/threonine-protein kinase Sgk1 at the junction between the macro- and microvasculature.

Conclusion: This study uncovers PAH-induced EC transcriptomic changes at a high resolution, revealing novel targets for potential therapeutic candidate development.

Keywords: Endothelial cells; PAH; Pulmonary hypertension; Single-cell RNA-seq.


Conflict of interest statement

Conflict of interest: S.Y.C. has served as a consultant for United Therapeutics, has held research grants from Actelion and Pfizer, and filed patent applications regarding drug development in pulmonary hypertension. S.Y.C. is a director, officer, and shareholder of Synhale Therapeutics. The other authors declare no competing interests. This manuscript was handled by Consulting Editor Henning Morawietz.

Figures

Graphical Abstract
Graphical Abstract
Figure 1
Figure 1
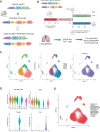
Single-cell RNA-seq of lung ECs in Control and PAH mice. (A) Mouse breeding schema to produce the Cdh5-CreERT2-TdTomato line. (B) Experimental timeline for Experiments 1 and 2. (C) Uniform Manifold Approximation and Projection (UMAP) plot of the merged data. Colours represent cell clusters, samples, and TdTomato expression, respectively. (D) Violin plot of TdTomato, Cdh5, Tyrobp and Gsn expression in the defined clusters. (E) UMAP plot of cell identity defined by the tool SingleR.
Figure 2
Figure 2
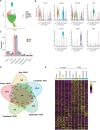
Identification of EC subpopulations in integrated Control samples. (A) UMAP plot of integrated Control samples. Colours represent annotated cell clusters and individual sample, respectively. (B) Proportion of EC subpopulation in individual Control samples. (C) Heatmap of the top 10 marker gene expression in a downsampling of 100 cells from each cluster. (D) UMAP plot of representative markers expression in the different clusters.
Figure 3
Figure 3
Differential gene expression analysis between PAH and Control in the vessel type EC populations. (A) UMAP plot of integrated Control and PAH samples. Colours represent annotated cell clusters. (B) Violin plot of vessel type-specific markers expression in the annotated EC subpopulations. (C) Proportion of the annotated EC subpopulations in Control and PAH samples. Error bars correspond to standard error of the mean. P-value obtained using an unpaired t-test on the log10 proportion (*P-value <0.05). (D) Venn diagram of differential gene expression changes (number of upregulated genes/number of down-regulated genes) in the five vessel type EC subpopulations. (E) Heatmap of all differentially expressed genes across vessel type EC subpopulations and conditions in a downsampling of 50 cells per category.
Figure 4
Figure 4
Activation of the antigen processing and presentation pathway in ECs in PAH. (A) Top 3 enriched KEGG pathways for each vessel type DEG. (B) Visualization of the Artery DEGs on the ‘Antigen Processing and Presentation’ pathway graph. (C) Dot plot showing the expression of DEG annotated in the KEGG ‘Antigen Processing and Presentation’ pathway and their co-stimulators across the EC subpopulations and conditions. (D) Heatmap [z-score of Log2(FPKM+1)] of significant genes involved in the Antigen Processing and Presentation pathway in the bulk RNA-seq of TdTomato+ cells.
Figure 5
Figure 5
Characterization of the PAH response in CapillaryB EC subpopulation. (A) Heatmap of up-regulated genes in CapillaryB in a downsampling of 50 cells per category. A hierarchical clustering approach was used to identify genes with a specific up-regulation in CapillaryB compared to the other EC populations. (B) Top 10 enriched Go Terms (Biological Process) of the CapillaryB-specific up-regulated genes. (C) Dot plot showing the expression of genes specifically up-regulated in CapillaryB and annotated in the ‘regulation of localization’ and ‘cell death’ Go Terms. (D) Violin plot of Bax expression across EC populations and conditions.
Figure 6
Figure 6
Comparison of the mouse PAH DEGs with human genetics and transcriptomics data. (A) Violin plot showing the expression of 4 DEGs with PAH-associated variants, across EC populations and conditions. (B) Number of mouse up/down-regulated genes regulated in the same direction in rat or human PAH ECs. (C) Dot plot showing the expression of selected candidates across EC populations and conditions in mouse and human scRNA-seq. (D) Expression of CD74 in Control (siCT) and CD74 (siCD74) knockdown HUVECs by RT-qPCR. RQ, relative quantification normalized to UBC relative to siCT (n = 4). (E) Quantification of EdU uptake in siCT and siCD74 HUVECs (n = 3). (F) Cell-to cell interaction, expressed as Rb (Ohm × cm2), in siCT and siCD74 HUVECs across a 6 h time course with bar graph showing the average across the time points (n = 3). Graph in panels DF correspond to mean ± standard error of the mean and P-values were obtained using an unpaired t-test. *P-value < 0.05 and ***P-value < 0.0001.
Figure 7
Figure 7
Differential gene expression changes across the arteriovenous axis. (A) UMAP plot of Artery, CapillaryA and Vein selected clusters. Colours correspond to EC subpopulations and trajectory unit, respectively. Trajectory arbitrary unit corresponding to the arteriovenous axis unit and trajectory line were obtained with Slingshot. (B) Expression of the vein marker Prss23, capillary marker Sema3c and artery marker Cxcl12 in Control and PAH cells ordered along the arteriovenous axis. (C) Cell density across the arteriovenous axis in Control and PAH groups. (D) Differential gene expression changes in 10 distinct sections of the arteriovenous axis based on a stringent analysis of individual samples. (E) Heatmap of the stringent DEG Log Fold change across 10 distinct sections of the arteriovenous axis. (F) Expression profile across the arteriovenous axis in Control and PAH conditions for Sgk1, Sparc, Sparcl1, and Cd34.

Comment in

References

    1. Lau EMT, Giannoulatou E, Celermajer DS, Humbert M.. Epidemiology and treatment of pulmonary arterial hypertension. Nat Rev Cardiol 2017;14:603–614. - PubMed
    1. Peacock AJ, Murphy NF, McMurray JJ, Caballero L, Stewart S.. An epidemiological study of pulmonary arterial hypertension. Eur Respir J 2007;30:104–109. - PubMed
    1. Morrell NW, Aldred MA, Chung WK, Elliott CG, Nichols WC, Soubrier F, Trembath RC, Loyd JE.. Genetics and genomics of pulmonary arterial hypertension. Eur Respir J 2019;53:1801899. - PMC - PubMed
    1. Humbert M, Guignabert C, Bonnet S, Dorfmuller P, Klinger JR, Nicolls MR, Olschewski AJ, Pullamsetti SS, Schermuly RT, Stenmark KR, Rabinovitch M.. Pathology and pathobiology of pulmonary hypertension: state of the art and research perspectives. Eur Respir J 2019;53:1801887. - PMC - PubMed
    1. Ciuclan L, Bonneau O, Hussey M, Duggan N, Holmes AM, Good R, Stringer R, Jones P, Morrell NW, Jarai G, Walker C, Westwick J, Thomas M.. A novel murine model of severe pulmonary arterial hypertension. Am J Respir Crit Care Med 2011;184:1171–1182. - PubMed

Publication types