. 2022 Jul 27;118(10):2293-2303.
doi: 10.1093/cvr/cvab294.

Optical ventricular cardioversion by local optogenetic targeting and LED implantation in a cardiomyopathic rat model

Affiliations

Optical ventricular cardioversion by local optogenetic targeting and LED implantation in a cardiomyopathic rat model

Emile C A Nyns et al. Cardiovasc Res. .

Abstract

Aims: Ventricular tachyarrhythmias (VTs) are common in the pathologically remodelled heart. These arrhythmias can be lethal, necessitating acute treatment like electrical cardioversion to restore normal rhythm. Recently, it has been proposed that cardioversion may also be realized via optically controlled generation of bioelectricity by the arrhythmic heart itself through optogenetics and therefore without the need of traumatizing high-voltage shocks. However, crucial mechanistic and translational aspects of this strategy have remained largely unaddressed. Therefore, we investigated optogenetic termination of VTs (i) in the pathologically remodelled heart using an (ii) implantable multi-LED device for (iii) in vivo closed-chest, local illumination.

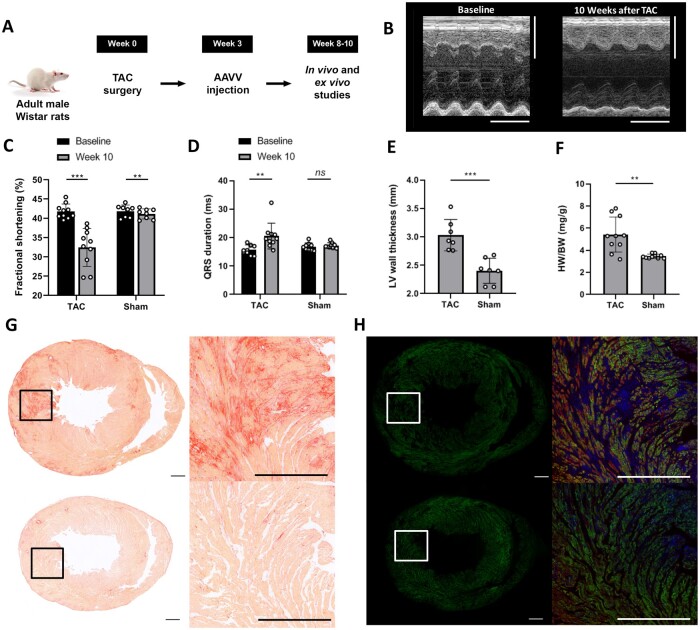
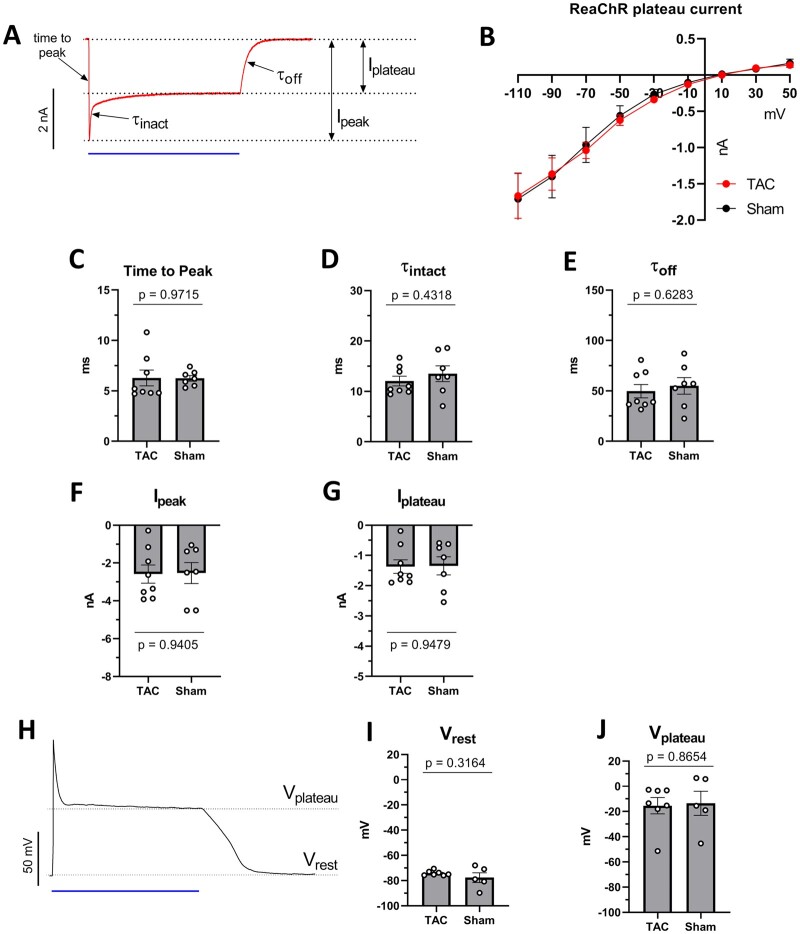
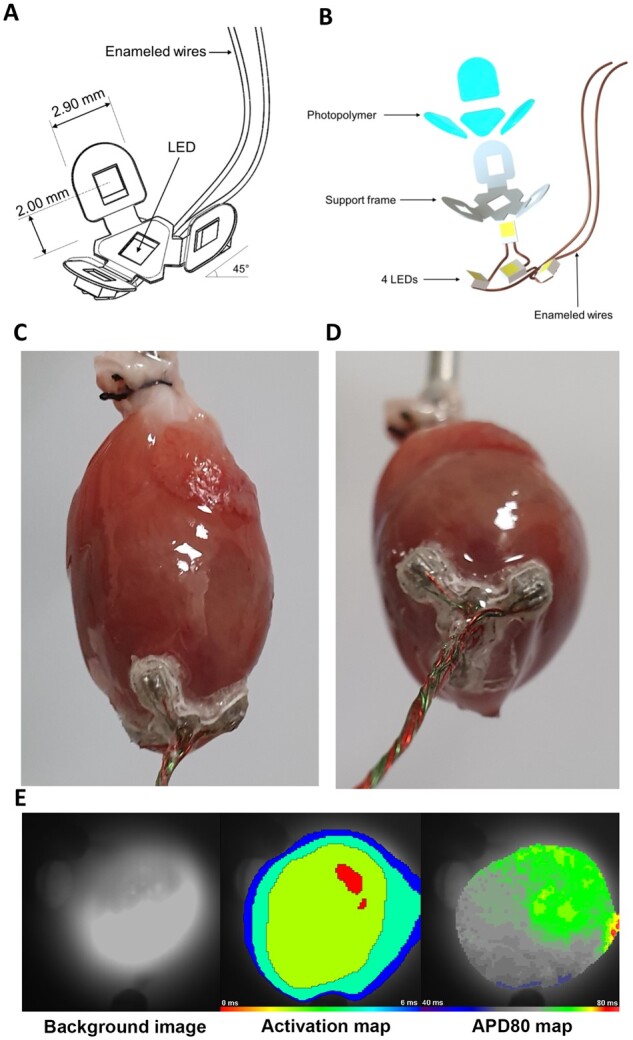
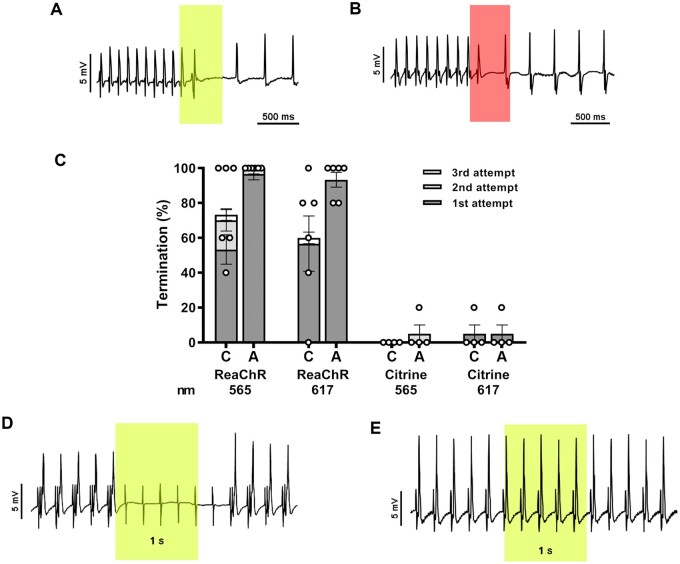
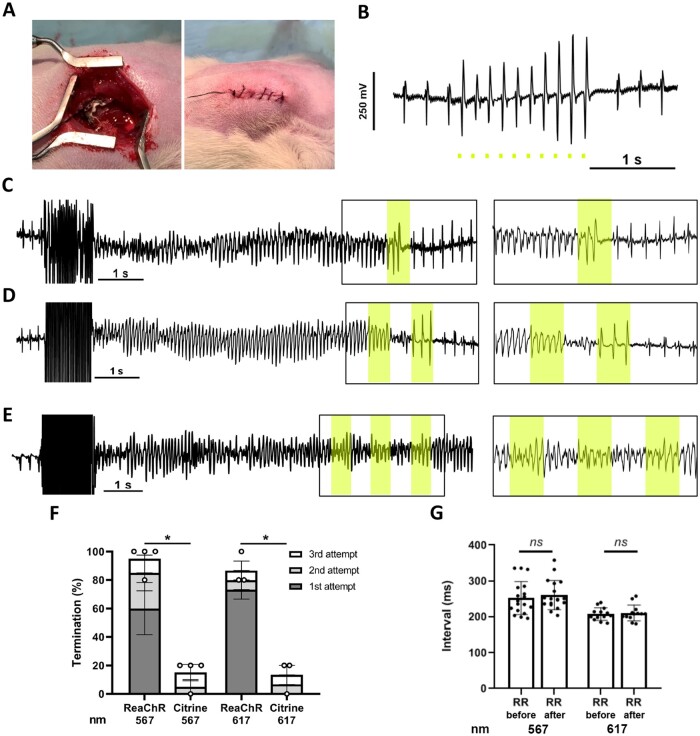
Methods and results: In order to mimic a clinically relevant sequence of events, transverse aortic constriction (TAC) was applied to adult male Wistar rats before optogenetic modification. This modification took place 3 weeks later by intravenous delivery of adeno-associated virus vectors encoding red-activatable channelrhodopsin or Citrine for control experiments. At 8-10 weeks after TAC, VTs were induced ex vivo and in vivo, followed by programmed local illumination of the ventricular apex by a custom-made implanted multi-LED device. This resulted in effective and repetitive VT termination in the remodelled adult rat heart after optogenetic modification, leading to sustained restoration of sinus rhythm in the intact animal. Mechanistically, studies on the single cell and tissue level revealed collectively that, despite the cardiac remodelling, there were no significant differences in bioelectricity generation and subsequent transmembrane voltage responses between diseased and control animals, thereby providing insight into the observed robustness of optogenetic VT termination.

Conclusion: Our results show that implant-based optical cardioversion of VTs is feasible in the pathologically remodelled heart in vivo after local optogenetic targeting because of preserved optical control over bioelectricity generation. These findings add novel mechanistic and translational insight into optical ventricular cardioversion.

Keywords: In vivo; Optogenetics; Remodelling; Ventricular tachycardias.


Figures

Figure 1
Figure 1
Characterization of the TAC model. (A) Study design. (B) Typical example of m-mode echocardiograms showing decreased systolic function at Week 10 after TAC compared to baseline. Vertical scale bars represent 5 mm, the horizontal scale bars represent 250 ms. (C) TAC resulted in decreased fractional shortening (***P≤0.001, **P=0.002 using the paired t-test) and (D) prolonged QRS duration (*P =0.015 and ns=non-significant using the paired t-test) 8–10 weeks after surgery compared to baseline. Each dot represents a single animal, n=10 rats per group. (E) LV wall thickness (each dot represents a single animal, n=7 rats per group) and (F) heart weight (mg)-to-body weight (g) ratio (HW/BW) 8–10 weeks after TAC or sham surgery (each dot represents a single animal, n=10 rats per group) ***P≤0.001 using the Student’s t-test. (G and H) Representative examples of sirius red (G) and immunohistological (H) stainings of mid-ventricular transverse sections from one TAC rat (upper pannels) and from one sham-operated rat (lower panels). Sections in (H) are immunostained for Citrine (green) and cardiac troponin-I (red). Cell nuclei are stained in blue. The inserts in the left panels of (G and H) mark the areas depicted in the right panels. Scale bars represent 1 mm.
Figure 2
Figure 2
Electrophysiological characterization of ReaChR photocurrents and membrane response in ventricular cardiomyocytes derived from TAC and sham-operated animals. In all voltage- and current-clamp experiments, ReaChR was activated by 470-nm light (1 s, 10 mW/mm2). (A) Representative whole-cell voltage clamp recording of ReaChR photocurrents from an isolated TAC cardiomyocyte. The membrane potential was clamped at −90 mV. Ipeak: maximal current amplitude, Iplateau: current amplitude at the end of the illumination period, time-to-peak: the length of the time interval between the beginning of illumination and the appearance of Ipeak, τinact: half-decay time of current decay from Ipeak to Iplateau, τoff: half-decay time of current decay from Iplateau to zero current. (B) ReaChR Iplateau amplitudes observed at a range of holding potentials between −110 and 50 mV. (C) Time-to-peak values of ReaChR current representing activation kinetics of ReaChR. (D) τinact values of ReaChR current representing ReaChR inactivation kinetics. (E) τoff time constant representing ReaChR closing kinetics. (F and G) ReaChR Ipeak (F) and Iplateau (G) amplitudes measured at −90 mV holding potentials. (H) Representative membrane potential response to 470 nm illumination (blue bar) recorded under current-clamp conditions in a cardiomyocyte isolated from a TAC animal. (I) Resting membrane potentials (Vrest) observed before illumination. (J) Plateau potentials (Vplateau) measured at the end of the 1 s light pulse. Each dot represents the results of an individual cell. For (CH), n = 8 cells from four hearts in the TAC group and n = 7 cells from two hearts in the sham group. For (I) and (J), n = 7 cells from four hearts in the TAC group and n = 5 cells from two hearts in the sham group. Numerical data are represented as mean ± SEM, all P-values were calculated by the Student’s t-test.
Figure 3
Figure 3
Whole-cell patch clamp and sharp electrode measurements of ReaChR photocurrents and membrane potential responses, and computational light penetration simulations at different excitation wavelengths. (A and B) Relative ReaChR Ipeak (A) and Iplateau (B) amplitudes measured at −90 mV holding potentials upon illumination with 567 or 617 nm light compared to 470 nm light as the index (500 ms, 1 mW/mm2). Each dot represents the paired results of an individual cell (n=6 cells from four hearts). For the light pulses of 470 nm, the single dots represent averaged values. (C) ReaChR plateau potentials (Vplateau) measured at the end of a 500 ms light pulse (1 mW/mm2) for 470, 567, and 617 nm light. Each dot represents the results of an individual cell (n=6 cells from four hearts). (D) Representative sharp electrode measurements of a ReaChR-expressing ventricular tissue sample from a TAC rat showing sustained depolarization illumination for 500 ms with blue (λ=470 nm), lime (λ=567 nm), or red (λ=617 nm) light of various intensities. All recordings are from the same ventricular spot. (E) Computational simulations of propagation of 470, 567, and 617 nm light through rat myocardium.
Figure 4
Figure 4
Overview of the apex cup device. (A) Schematic drawing and (B) exploded schematic view of the LED assembly. The centrally localized LED chip at the base of the assembly can be activated independently of the other three LEDs. (C and D) Images of the LED device mounted to the apex of a Langendorff-perfused TAC heart. Firm fixation of the LED device was ensured with tissue adhesive. (E) Typical activation (middle panel) and action potential duration at 80% repolarization (APD80, right panel) maps of the apex during sinus rhythm of a ReaChR-expressing TAC heart after it was subjected to repeated LED device activation during in vivo and ex vivo experiments with all LEDs activated for both 567 nm light (15 mW/mm2) and 617 nm light (10 mW/mm2). Recordings were made following LED device removal and with the camera pointed at the tip of the apex (left panel). The activation map demonstrated rapid and regular activation of the epicardial apical surface. The decrease in isochronal line spacing at the edges is due to the curvature of the apex. The APD80 map demonstrates a homogenous APD of 60–70 ms.
Figure 5
Figure 5
Optogenetic termination of VTs by apical ex vivo illumination of TAC hearts with the LED device. (A and B) Intracardiac ECG demonstrating successful termination of VTs with a single 567 nm (A) or 617 nm (B) light pulse (500 ms; 5 mW/mm2; coloured boxes). (C) Quantification of optogenetic termination efficacy averaged per ReaChR-expressing heart (n=6 animals, five individual measurements per animal) or Citrine-expressing heart (n=4 animals, five individual measurements per animal) by the LED device following activation of only the centrally located LED (C) or all four LEDs (A) for up to three consecutive light pulses (500 ms with a 500 ms cycle length, 5 mW/mm2). Each dot represents the average of five individual measurements in one rat. Error bars represent SEM. (D) Representative intracardiac ECG recording of a ReaChR-expressing TAC heart demonstrating 5 Hz apical pacing before, during, and after apical illumination by the 567 nm LED device with all four LED chips activated for 1000 ms (irradiance: 5 mW/mm2). The sensing electrode was attached to the LV free wall. Complete loss of ventricular capture during the entire duration of illumination was observed for all ReaChR-expressing TAC animals (n=4) as only pacing artefacts are observed. (E) Ventricular capture was not affected by illumination of Citrine-expressing control hearts (n=4).
Figure 6
Figure 6
Optogenetic termination of VTs by apical in vivo illumination of TAC hearts with the LED device. (A) Picture of LED device implanted at the ventricular apex before and after surgical closure of the thoracic wall, muscle layers, and skin. (B) Typical body surface ECG trace showing optical ventricular pacing by the apically implanted LED device with 567 nm light pulses (10 ms; 1 mW/mm2) under closed-chest conditions. Scale bar represents 1 s. (C and D) Representative body surface ECG traces showing successful optogenetic termination of VTs by one (C) or two (D) consecutive 500 ms light pulses (interval: 500 ms) delivered by the 567 nm LED device with all four LEDs activated (irradiance: 15 mW/mm2; coloured boxes). (E) Typical body surface ECG trace showing failure to terminate a VT in a Citrine-expressing control rat by three consecutive light pulses [identical illumination protocol as in (C) and (D)]. Inserts highlight ECG recordings during illumination. (F) Quantification of optogenetic VT termination efficacy in vivo averaged per ReaChR- or Citrine-expressing TAC rat (n=4 animals for 567 nm light, n=3 animals for 617 nm light) following activation of all four LEDs by up to three consecutive light pulses (500 ms with a 500 ms cycle length). Irradiance was 15 mW/mm2 for 567 nm light and 10 mW/mm2 for 617 nm light. A total of five individual termination attempts were performed per animal. Each dot represents the averaged termination rate of a single animal. Error bars represent SEM. *P <0.05 using the Mann–Whitney U test. (G) Graph showing the average RR intervals of the last 2 s before VT induction and the first 2 s after optogenetic VT termination with 567 and 617 nm light pulses. Each dot represents one individual measurement, n =18 measurements from four rats for 567 nm and n=13 measurements from three rats for 617 nm. Data are means. ns, non-significant using the paired t-test.

References

    1. Al-Khatib SM, Stevenson WG, Ackerman MJ, Bryant WJ, Callans DJ, Curtis AB, Deal BJ, Dickfeld T, Field ME, Fonarow GC, Gillis AM, Granger CB, Hammill SC, Hlatky MA, Joglar JA, Kay GN, Matlock DD, Myerburg RJ, Page RL.. 2017 AHA/ACC/HRS guideline for management of patients with ventricular arrhythmias and the prevention of sudden cardiac death: executive summary: A Report of the American College of Cardiology/American Heart Association Task Force on Clinical Practice Guidelines and the Heart Rhythm Society. Heart Rhythm 2018;15:e190–e252. - PubMed
    1. John RM, Tedrow UB, Koplan BA, Albert CM, Epstein LM, Sweeney MO, Miller AL, Michaud GF, Stevenson WG.. Ventricular arrhythmias and sudden cardiac death. Lancet 2012;380:1520–1529. - PubMed
    1. Roberts-Thomson KC, Lau DH, Sanders P.. The diagnosis and management of ventricular arrhythmias. Nat Rev Cardiol 2011;8:311–321. - PubMed
    1. Bradfield JS, Ajijola OA, Vaseghi M, Shivkumar K.. Mechanisms and management of refractory ventricular arrhythmias in the age of autonomic modulation. Heart Rhythm 2018;15:1252–1260. - PubMed
    1. Josephson M, Wellens HJ.. Implantable defibrillators and sudden cardiac death. Circulation 2004;109:2685–2691. - PubMed

Publication types

Substances