

Probability bound analysis: A novel approach for quantifying parameter uncertainty in decision-analytic modeling and cost-effectiveness analysis
- PMID: 34528265
- PMCID: PMC9290849
- DOI: 10.1002/sim.9195
Probability bound analysis: A novel approach for quantifying parameter uncertainty in decision-analytic modeling and cost-effectiveness analysis
Abstract
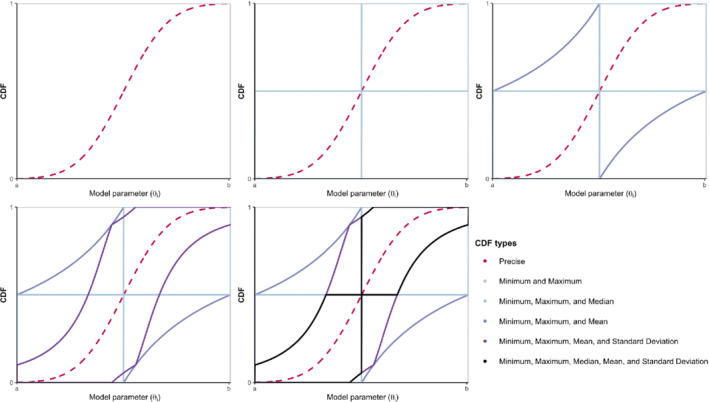
Decisions about health interventions are often made using limited evidence. Mathematical models used to inform such decisions often include uncertainty analysis to account for the effect of uncertainty in the current evidence base on decision-relevant quantities. However, current uncertainty quantification methodologies, including probabilistic sensitivity analysis (PSA), require modelers to specify a precise probability distribution to represent the uncertainty of a model parameter. This study introduces a novel approach for representing and propagating parameter uncertainty, probability bounds analysis (PBA), where the uncertainty about the unknown probability distribution of a model parameter is expressed in terms of an interval bounded by lower and upper bounds on the unknown cumulative distribution function (p-box) and without assuming a particular form of the distribution function. We give the formulas of the p-boxes for common situations (given combinations of data on minimum, maximum, median, mean, or standard deviation), describe an approach to propagate p-boxes into a black-box mathematical model, and introduce an approach for decision-making based on the results of PBA. We demonstrate the characteristics and utility of PBA vs PSA using two case studies. In sum, this study provides modelers with practical tools to conduct parameter uncertainty quantification given the constraints of available data and with the fewest assumptions.
Keywords: cost-effectiveness analysis; decision-analytic modeling; parameter uncertainty; probability bound analysis; probability box; uncertainty quantification.
© 2021 The Authors. Statistics in Medicine published by John Wiley & Sons Ltd.
Conflict of interest statement
We have no conflict of interest to declare.
Figures


References
-
- Hunink MM, Weinstein MC, Wittenberg E, et al. Decision Making in Health and Medicine: Integrating Evidence and Values. Cambridge, MA: Cambridge University Press; 2014.
-
- Rothery C, Claxton K, Palmer S, Epstein D, Tarricone R, Sculpher M. Characterising uncertainty in the assessment of medical devices and determining future research needs. Health Econ. 2017;26:109‐123. - PubMed
-
- WHO . WHO Guide for Standardization of Economic Evaluations of Immunization Programmes. Geneva, Switzerland: World Health Organization; 2019.
-
- Briggs AH, Weinstein MC, Fenwick EA, Karnon J, Sculpher MJ, Paltiel AD. Model parameter estimation and uncertainty analysis: a report of the ISPOR‐SMDM modeling good research practices task force working group–6. Med Decis Mak. 2012;32(5):722‐732. - PubMed
Publication types
MeSH terms
LinkOut - more resources
Full Text Sources
Research Materials
Miscellaneous