. 2021 Sep 16:10:e68920.
doi: 10.7554/eLife.68920.

Whole-organism 3D quantitative characterization of zebrafish melanin by silver deposition micro-CT

Affiliations

Whole-organism 3D quantitative characterization of zebrafish melanin by silver deposition micro-CT

Spencer R Katz et al. Elife. .

Abstract

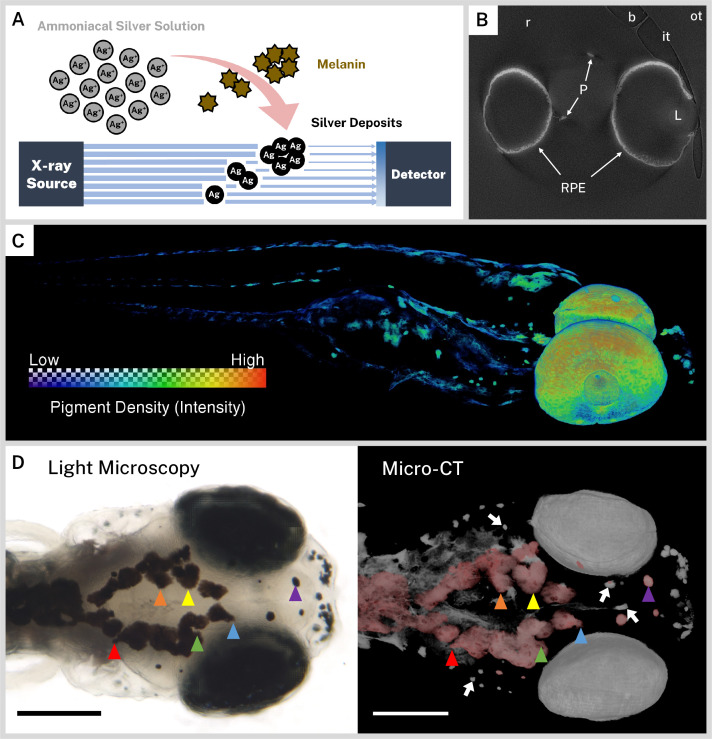
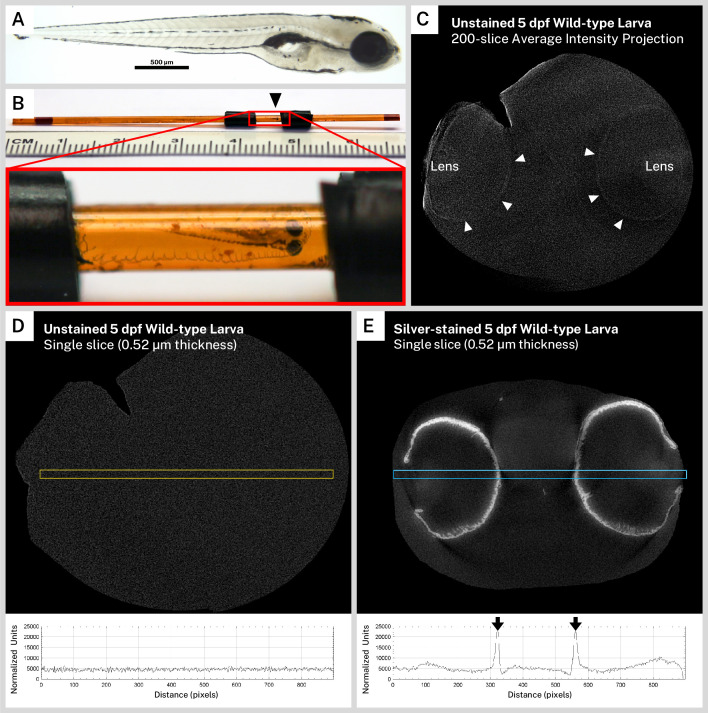
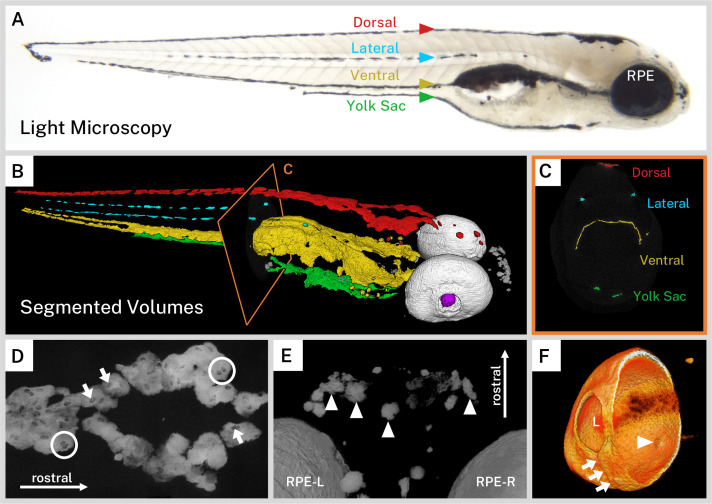
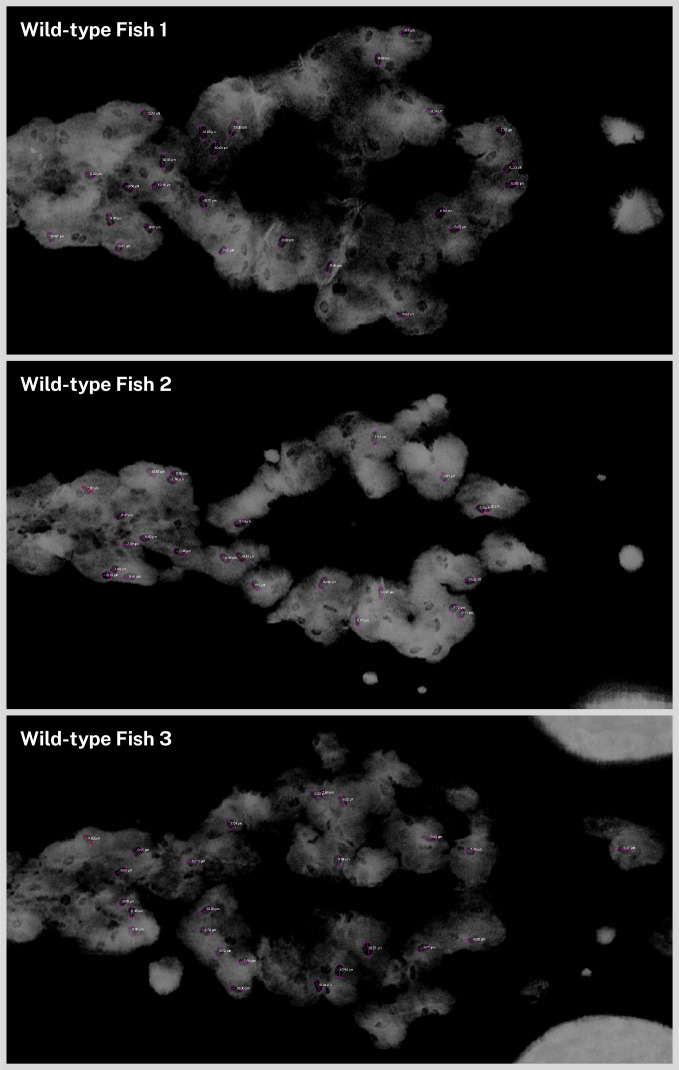
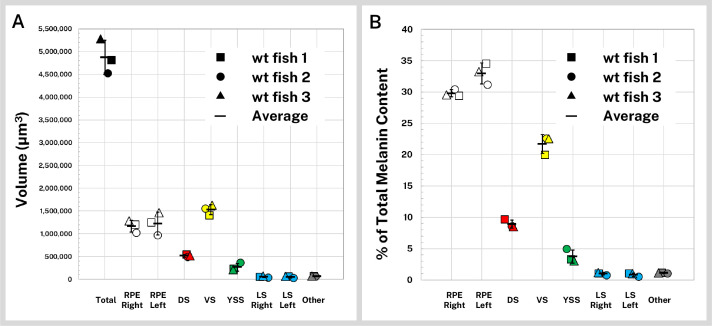
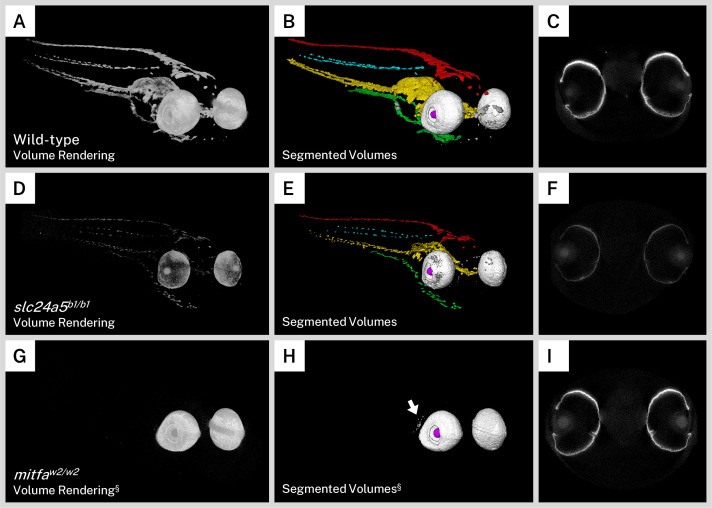
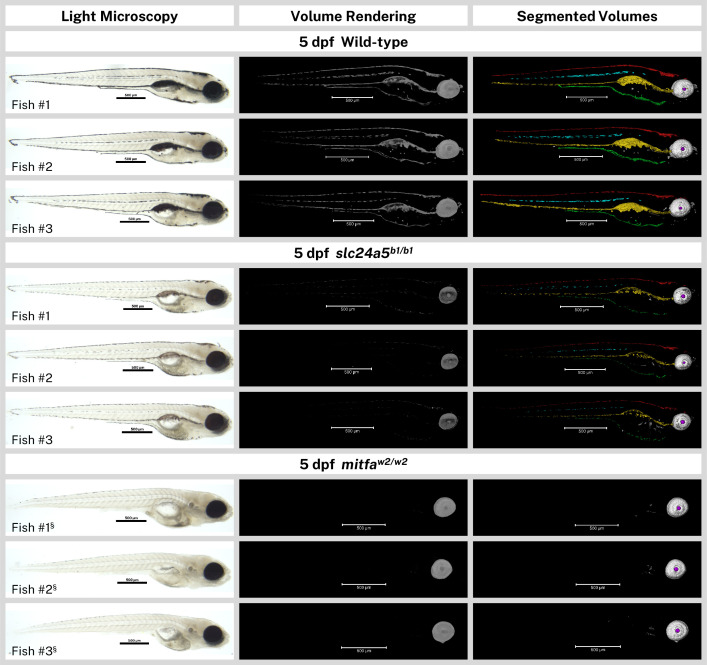
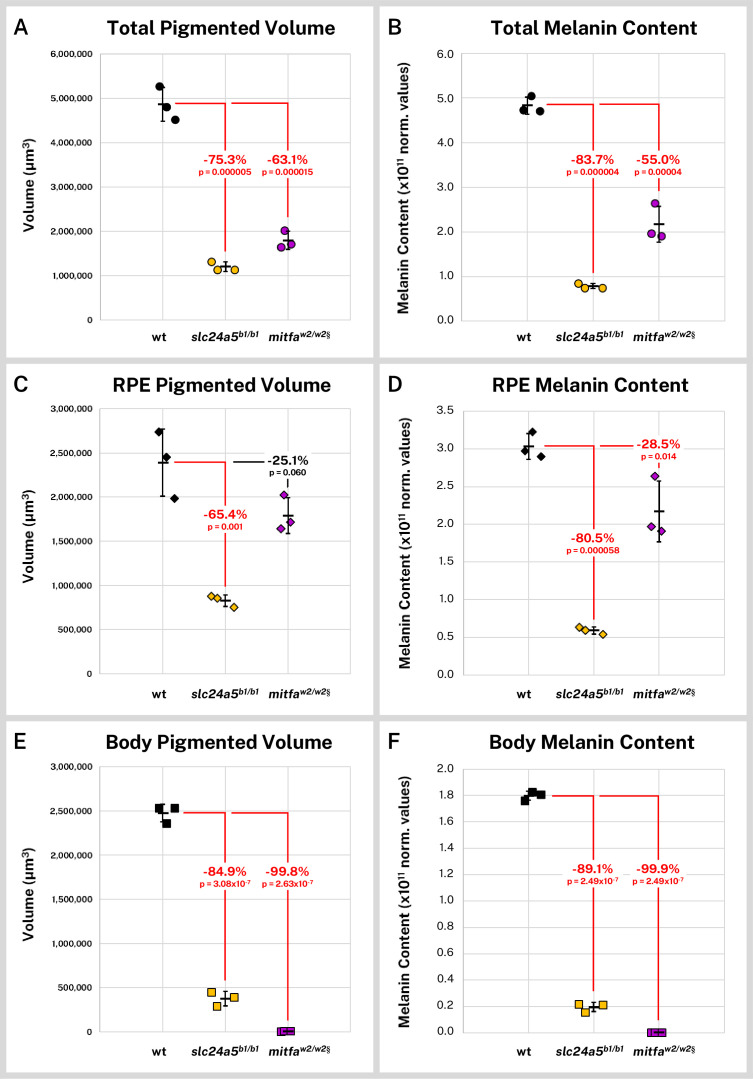
We previously described X-ray histotomography, a high-resolution, non-destructive form of X-ray microtomography (micro-CT) imaging customized for three-dimensional (3D), digital histology, allowing quantitative, volumetric tissue and organismal phenotyping (Ding et al., 2019). Here, we have combined micro-CT with a novel application of ionic silver staining to characterize melanin distribution in whole zebrafish larvae. The resulting images enabled whole-body, computational analyses of regional melanin content and morphology. Normalized micro-CT reconstructions of silver-stained fish consistently reproduced pigment patterns seen by light microscopy, and further allowed direct quantitative comparisons of melanin content across wild-type and mutant samples, including subtle phenotypes not previously noticed. Silver staining of melanin for micro-CT provides proof-of-principle for whole-body, 3D computational phenomic analysis of a specific cell type at cellular resolution, with potential applications in other model organisms and melanocytic neoplasms. Advances such as this in whole-organism, high-resolution phenotyping provide superior context for studying the phenotypic effects of genetic, disease, and environmental variables.

Keywords: 3D imaging; cell biology; developmental biology; melanin; micro-CT; pigmentation; silver staining; whole-organism phenomics; zebrafish.


Conflict of interest statement

SK, DV, YD, AL, DP, VC, KA, KC None, MY none, YW Yuxin Wang is affiliated with Mobile Imaging Innovations, Inc. The author has no other competing interests to declare.

Figures

Figure 1.
Figure 1.. Ionic silver stains reproduce three-dimensional (3D) pigmentation patterns in X-ray microtomography (micro-CT) images.
(A) Schematic overview of staining procedure. Ammoniacal silver solution reacts with endogenous melanin to deposit solid silver, which attenuates X-rays in micro-CT imaging. (B) A representative cropped and rotated slice of a micro-CT reconstruction of a 5 days post-fertilization (dpf) wild-type zebrafish stained with silver. RPE = retinal pigment epithelium, P = body pigment, L = lens, r = resin, it = inner wall of sample tube, ot = outer wall of sample tube, b = air bubble. (C) 3D rendering of a 5 dpf wild-type zebrafish stained with silver with a heatmap to illustrate pigment density throughout the fish. (D) Corresponding light microscopy (left) and micro-CT (right) images exhibit the same pigmentation patterns. In the micro-CT image, a top-down 3D rendering of stained melanin is shown in grayscale with the dorsal-most melanin digitally colored red to aid comparison with the light micrograph. Some distinguishing shared features are highlighted with colored arrowheads. White arrows indicate deeper melanin obscured by soft tissue in the light micrograph that can be visualized by targeted 3D re-rendering. Scale bars = 200 µm. Unstained samples do not exhibit melanin-related attenuation (Figure 1—figure supplement 1).
Figure 1—figure supplement 1.
Figure 1—figure supplement 1.. Unstained zebrafish larvae do not exhibit pigment pattern intensity in X-ray microtomography (micro-CT) reconstructions.
A pigmented 5 days post-fertilization (dpf) wild-type larva (A) was prepared for micro-CT imaging without silver staining. (B) The sample (black arrowhead), embedded in resin within a polyimide tube, was surrounded by electrical tape to ensure proper positioning in the X-ray beam. (C) A 200-slice average intensity projection of the normalized micro-CT reconstruction from this unstained sample shows faint attenuation in the lenses (L) and at the edges of the eyes (white arrowheads), indicating that the sample was scanned. A 900-pixel × 25-pixel selection (yellow box) transecting the eyes was used to calculate an intensity profile for a single reconstructed slice of the unstained fish (D) showing virtually no intensity peaks above background. A similar selection (blue box) through a single reconstructed slice of a silver-stained 5 dpf wild-type larva (E) demonstrates intense melanin staining in the intensity profile (black arrows).
Figure 2.
Figure 2.. Silver-based X-ray microtomography (micro-CT) enables segmentation and visualization of melanin microanatomy in three dimensions (3D).
(A) A light micrograph of the side of a 5 days post-fertilization (dpf) wild-type larva indicating the major regions of melanin pigment: dorsal, lateral, ventral, and yolk sac stripes and the retinal pigment epithelium (RPE). (B) A 3D rendering with orthoslice (C) of micro-CT volumes segmented into anatomical regions shows the organization of larval pigment into layers. Red = dorsal stripe, yellow = ventral stripe, green = yolk sac stripe, cyan = lateral stripes, white = RPE, gray = other body melanin, purple = lens. (C) Single slice of micro-CT data with color overlay corresponding to the indicated region in B. (D) 200-slice maximum intensity projection of dorsal stripe melanin exhibits transparencies in the staining indicating the position of large organelles (arrows) including potentially binucleated cells (circles). A sample of these transparencies was measured to estimate average size (Figure 2—figure supplement 1, Figure 2—source data 1). (E) View from the top-down of a volume rendering showing rostral melanin in the nose forming globular, dendritic cells (arrowheads). RPE-L = left RPE, RPE-R = right RPE. (F) Isolated volume rendering of the right eye with a clipping plane showing the villous inner surface and smooth outer surface of the RPE. The rendering has been falsely colored by intensity to highlight certain anatomical features, including local pigment thickness variability throughout the RPE, the egress of the optic nerve (arrowhead), and the fused choroidal fissure (arrows). L = lens.
Figure 2—figure supplement 1.
Figure 2—figure supplement 1.. Measurements of ovoid transparencies in melanin staining.
Volume renderings of the top of the head for three 5 days post-fertilization (dpf) wild-type zebrafish were examined for ovoid transparencies in the staining. For each fish, 25 random opacities were selected and manually measured on the long axis using the three-dimensional (3D) line measurement tool in Avizo (pink lines). Average length (n = 75) was 9.29 µm (SD = ±1.23 µm). Full list of measurements is provided in Figure 2—source data 1.
Figure 3.
Figure 3.. Quantification of silver-stained, X-ray microtomography (micro-CT)-scanned, and segmented larvae reveals wild-type melanin volume and content trends.
Wild-type (wt) 5 days post-fertilization (dpf) larvae (n = 3) were stained with silver and micro-CT imaged under the same conditions then segmented into major pigment regions as described in Figure 2: retinal pigment epithelium (RPE, right and left), dorsal stripe (DS), ventral stripe (VS), yolk sac stripe (YSS), lateral stripes (LS, right and left), and other melanin (other). (A) Volumes of the total pigmented regions and each segmented region are shown for the three fish. (B) Reconstructed stain intensity values are assumed to be proportional to melanin density; integrated intensity values for the segmented regions represents the melanin content of these regions. As proportions of total melanin content (summed across all segmented regions) the wt fish show high concordance between individual samples. Error bars = standard deviation from average.
Figure 4.
Figure 4.. Silver staining and X-ray microtomography (micro-CT) of mutant zebrafish enables comparison of melanin content and organization with wild-type larvae.
Volume renderings (A, D, G), segmented volumes (B, E, H), and representative single slices of micro-CT reconstructions through the retinal pigment epithelium (RPE; C, F, I) of representative 5 days post-fertilization (dpf) wild-type (A–C), slc24a5b1/b1 (golden; D–E), and mitfaw2/w2 (nacre or casper; G–I) larvae. In the segmented volumes, red = dorsal stripe, yellow = ventral stripe, green = yolk sac stripe, cyan = lateral stripes, white = RPE, gray = other body melanin, purple = lens. As compared to wild-type larvae, slc24a5b1/b1 mutant larvae exhibit a reduction in staining throughout the body and eyes (D) but retain the overall organization of pigment layers (E). The RPE in slc24a5b1/b1 larvae (F) is thinner than the wild-type RPE (C) with less intense staining. The mitfaw2/w2 mutant lacks all body pigment; staining is observed only in the RPE and some argentaffin material posterior to the eyes (G–H, arrow). The RPE of the mitfaw2/w2 mutant (I) is of similar thickness and staining intensity as the wild-type RPE (C). For each comparison, visualization settings were kept constant for the wild-type and mutant fish. § = head segment only shown. All stained samples analyzed in this study are shown in Figure 4—figure supplement 1.
Figure 4—figure supplement 1.
Figure 4—figure supplement 1.. Overview of all analyzed samples.
Light micrographs (before silver staining), X-ray microtomography (micro-CT) volume renderings, and segmented volumes of the wild-type, slc24a5b1/b1, and mitfaw2/w2 5 days post-fertilization (dpf) larvae (n=3 each) analyzed for this study. In the segmented volumes, red = dorsal stripe, yellow = ventral stripe, green = yolk sac stripe, cyan = lateral stripes, white = RPE, gray = other body melanin, purple = lens. Scale bars = 500 µm. § = head segment only analyzed by micro-CT and shown.
Figure 5.
Figure 5.. Silver-based X-ray microtomography (micro-CT) enables quantitative comparisons of wild-type and mutant pigmented samples.
Wild-type (wt, n = 3), slc24a5b1/b1 (n = 3), and mitfaw2/w2 (n = 3) 5 days post-fertilization (dpf) larvae were stained with silver and micro-CT imaged under the same conditions. Normalized reconstructed intensity values (norm. values) are assumed proportional to melanin density; integrated intensity values for the segmented regions represent the melanin content of these regions. Volume and melanin content from total pigmented regions (A–B), combined right and left retinal pigment epithelia (RPE) (C–D), and pigmented regions outside the eye (E–F) are shown for all samples with percent change of mean from wt indicated. p-Values were determined by Tukey post hoc test following one-way ANOVA and considered significant at p < 0.05 (shown in red). § = head segments only analyzed. Error bars = standard deviation from average.

References

    1. Antinucci P, Hindges R. A crystal -clearcrystal-clear zebrafish for in vivo imaging. Scientific Reports. 2016;6:29490. doi: 10.1038/srep29490. - DOI - PMC - PubMed
    1. Bancroft JD. Theory and Practice of Histological Techniques. Elsevier Health Sciences; 2008.
    1. Bharti K, Nguyen MTT, Skuntz S, Bertuzzi S, Arnheiter H. The other pigment cell: specification and development of the pigmented epithelium of the vertebrate eye. Pigment Cell Research. 2006;19:380–394. doi: 10.1111/j.1600-0749.2006.00318.x. - DOI - PMC - PubMed
    1. Ceol CJ, Houvras Y, Jane-Valbuena J, Bilodeau S, Orlando DA, Battisti V, Fritsch L, Lin WM, Hollmann TJ, Ferré F, Bourque C, Burke CJ, Turner L, Uong A, Johnson LA, Beroukhim R, Mermel CH, Loda M, Ait-Si-Ali S, Garraway LA, Young RA, Zon LI. The histone methyltransferase setdb1 is recurrently amplified in melanoma and accelerates its onset. Nature. 2011;471:513–517. doi: 10.1038/nature09806. - DOI - PMC - PubMed
    1. Cheng KC, Xin X, Clark DP, La Riviere P. Whole-animal imaging, gene function, and the Zebrafish Phenome Project. Current Opinion in Genetics & Development. 2011;21:620–629. doi: 10.1016/j.gde.2011.08.006. - DOI - PMC - PubMed

Publication types