

Association between right ventricular dysfunction and mortality in COVID-19 patients: A systematic review and meta-analysis
- PMID: 34528706
- PMCID: PMC8495092
- DOI: 10.1002/clc.23719
Association between right ventricular dysfunction and mortality in COVID-19 patients: A systematic review and meta-analysis
Abstract
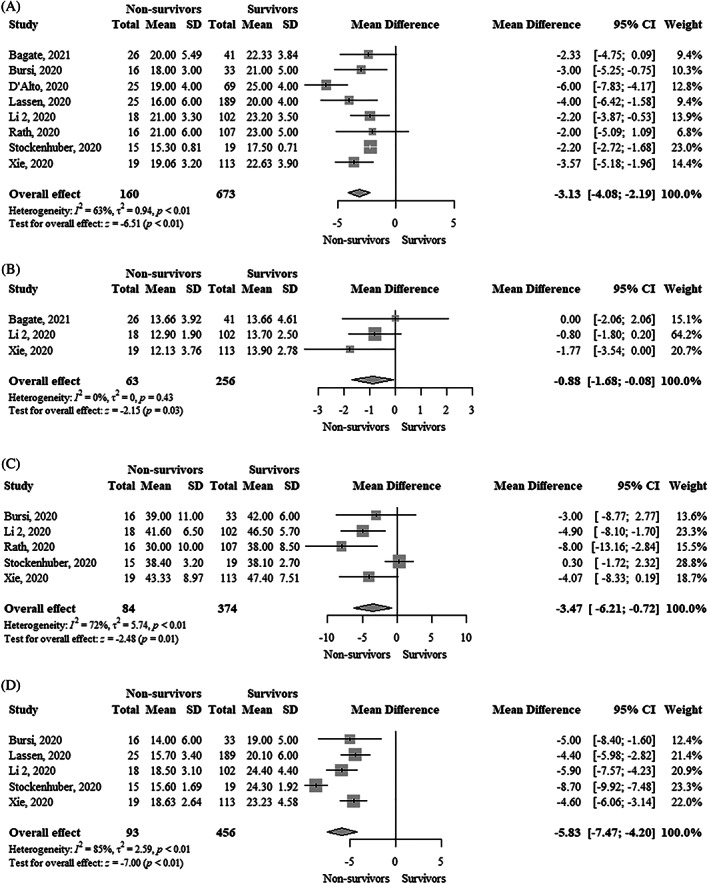
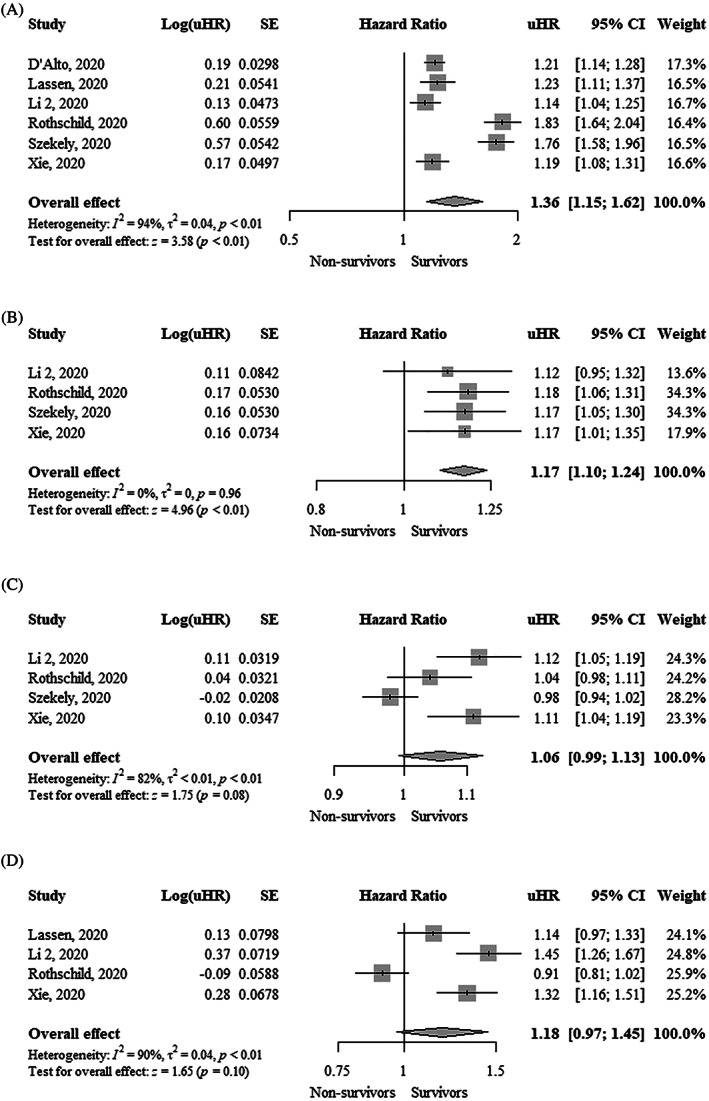
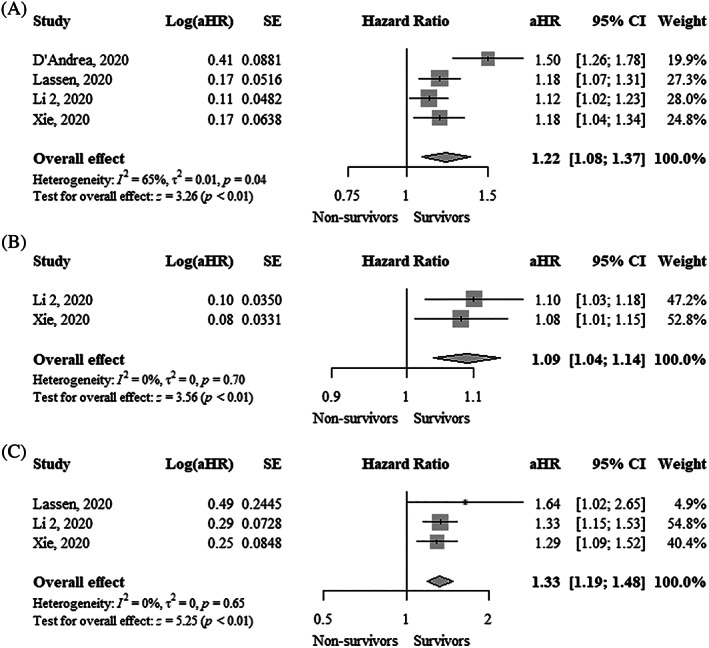
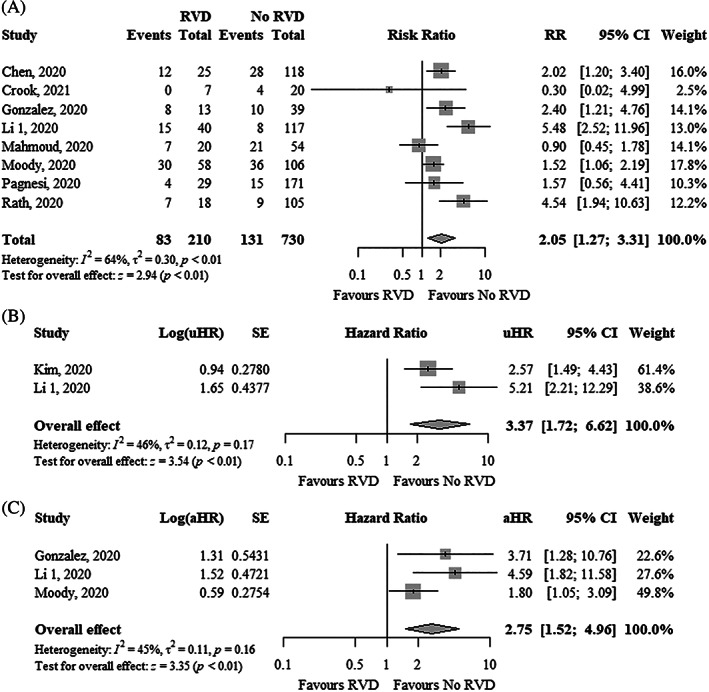
There is limited evidence about the prognostic utility of right ventricular dysfunction (RVD) in patients with coronavirus disease 2019 (COVID-19). We assessed the association between RVD and mortality in COVID-19 patients. We searched electronic databases from inception to February 15, 2021. RVD was defined based on the following echocardiographic variables: tricuspid annular plane systolic excursion (TAPSE), tricuspid S' peak systolic velocity, fractional area change (FAC), and right ventricular free wall longitudinal strain (RVFWLS). All meta-analyses were performed using a random-effects model. Nineteen cohort studies involving 2307 patients were included. The mean age ranged from 59 to 72 years and 65% of patients were male. TAPSE (mean difference [MD], -3.13 mm; 95% confidence interval [CI], -4.08--2.19), tricuspid S' peak systolic velocity (MD, -0.88 cm/s; 95% CI, -1.68 to -0.08), FAC (MD, -3.47%; 95% CI, -6.21 to -0.72), and RVFWLS (MD, -5.83%; 95% CI, -7.47--4.20) were significantly lower in nonsurvivors compared to survivors. Each 1 mm decrease in TAPSE (adjusted hazard ratio [aHR], 1.22; 95% CI, 1.08-1.37), 1% decrease in FAC (aHR, 1.09; 95% CI, 1.04-1.14), and 1% increase in RVFWLS (aHR, 1.33; 95% CI, 1.19-1.48) were independently associated with higher mortality. RVD was significantly associated with higher mortality using unadjusted risk ratio (2.05; 95% CI, 1.27-3.31), unadjusted hazard ratio (3.37; 95% CI, 1.72-6.62), and adjusted hazard ratio (aHR, 2.75; 95% CI, 1.52-4.96). Our study shows that echocardiographic parameters of RVD were associated with an increased risk of mortality in COVID-19 patients.
Keywords: coronavirus disease 2019; mortality; right ventricular dysfunction; systematic review.
© 2021 The Authors. Clinical Cardiology published by Wiley Periodicals LLC.
Conflict of interest statement
None of the authors reported any conflicts of interest.
Figures
References
-
- WHO Coronavirus Disease (COVID‐19) Dashboard. https://covid19.who.int/ 2021.
-
- Wells G., Shea B., O'Connell D., Peterson J., Welch V., Losos M. and Tugwell P.. The Newcastle‐Ottawa scale (NOS) for assessing the quality of nonrandomised studies in meta‐analysis, 2021, http://www.ohri.ca/programs/clinical_epidemiology/oxfordasp.
Publication types
MeSH terms
LinkOut - more resources
Full Text Sources
Medical
