

Modeling glioblastoma heterogeneity as a dynamic network of cell states
- PMID: 34528760
- PMCID: PMC8444284
- DOI: 10.15252/msb.202010105
Modeling glioblastoma heterogeneity as a dynamic network of cell states
Abstract
Tumor cell heterogeneity is a crucial characteristic of malignant brain tumors and underpins phenomena such as therapy resistance and tumor recurrence. Advances in single-cell analysis have enabled the delineation of distinct cellular states of brain tumor cells, but the time-dependent changes in such states remain poorly understood. Here, we construct quantitative models of the time-dependent transcriptional variation of patient-derived glioblastoma (GBM) cells. We build the models by sampling and profiling barcoded GBM cells and their progeny over the course of 3 weeks and by fitting a mathematical model to estimate changes in GBM cell states and their growth rates. Our model suggests a hierarchical yet plastic organization of GBM, where the rates and patterns of cell state switching are partly patient-specific. Therapeutic interventions produce complex dynamic effects, including inhibition of specific states and altered differentiation. Our method provides a general strategy to uncover time-dependent changes in cancer cells and offers a way to evaluate and predict how therapy affects cell state composition.
Keywords: cell state; cellular barcoding; patient-derived brain tumor cells; single-cell lineage tracing; time-dependent computational models.
© 2021 The Authors. Published under the terms of the CC BY 4.0 license.
Conflict of interest statement
The authors declare no conflict of interest. RE is presently an AstraZeneca employee.
Figures
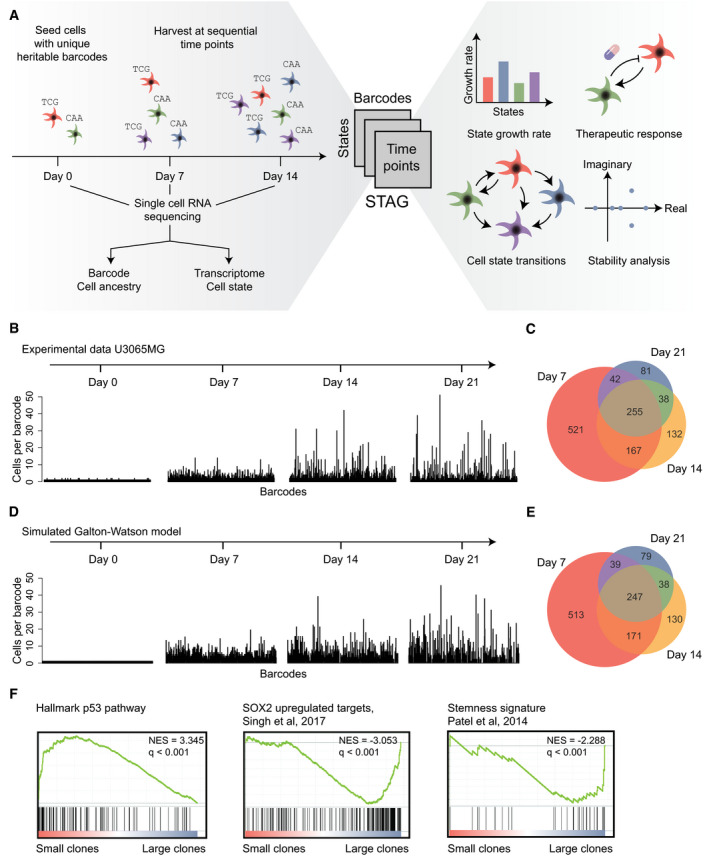
- A
Overview. In the STAG procedure, barcoded tumor cells are sampled at multiple time points and profiled by single‐cell RNA sequencing, followed by mathematical modeling to identify (i) the states and their growth rates, (ii) the patterns and rates of the state transitions, (iii) how drugs affect cell states, and (iv) analysis of cell population stability and long‐term projections of cell state compositions.
- B
Clone sizes of barcoded U3065MG cells at 0–21 days. X‐axis, barcodes; Y‐axis, number of cells containing each barcode.
- C
Venn diagram of number of barcodes detected at 7, 14, and 21 days.
- D, E
Simulation of the experiment in (B,C) using a Galton–Watson process with a fixed growth and death rate.
- F
Enriched gene sets in small and large clones, respectively, using Gene Set Enrichment Analysis (GSEA). Normalized enrichment scores (NES) and q‐values are indicated in the figure.

UMAP embedding of single U3065MG cells colored according to transcriptional cell state assignment.
Average number of states represented in each clone with increasing clone size. X‐axis, clone size; Y‐axis, average number of states.
UMAP embedding of cell state distribution at each experimental time point. State colors as in (A).
Heatmap of the U3065MG state transition and growth matrix A derived from the STAG model.
Estimated network of state transitions in the U3065MG cell line. The thickness of the arrows correlates with the rate of transition (number of transitions per day).
STAG estimates of growth rates (cell divisions per day) for U3065MG states 1–6. Error bars indicate the 90% confidence interval, based on 1,000 bootstrap replicates.
Enrichment of the U3065MG state 1 cell population (CD24high/CD44high/HLA‐DRlow) using FACS cell sorting. Cells were monitored by flow cytometry over 3 weeks, and a gradual phenotypic drift, e.g., toward state 4 (CD24high/CD44high/HLA‐DRhigh), could be observed. See also Fig EV1.
scRNA sequencing of a U3065MG‐derived clonal culture (clone 475) detected all six states of the U3065MG mother cell line. U3065MG‐C475 cells were scored against U3065MG state 1–6 signatures using ssGSEA.

Heatmap of selected cell surface marker mRNA expression (Z scores) in each of the U3065MG states.
Flow cytometry analysis of cell surface marker expression, 2 weeks after FACS‐enrichment of U3065MG state 1 cells (CD24high/CD44high/HLA‐DRlow), as in Fig 2G. Two biological replicate experiments are shown.

GSEA of the gene signatures for each of the six U3065MG states. Blue and red indicate negative and positive enrichments of the pathway. Size of the dot indicates significance (proportional to the GSEA false discovery rate [FDR] q‐value). Gene sets without PMID reference were obtained from the MSigDB Hallmarks database of gene sets. Abbreviations: oligodendrocyte progenitor cell (OPC), neural progenitor cell (NPC), mesenchymal (MES), astrocyte (AC), neuronal (NEU), mitochondrial (MTC), proliferative/progenitor (PPR).
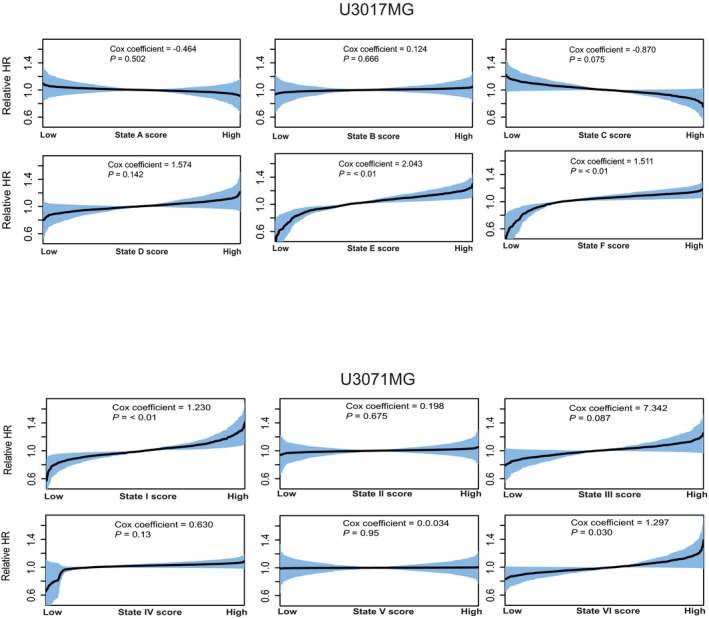
Survival analysis of TCGA GBM patients estimated by Cox's proportional hazards model, with enrichment score of states 1–6 as independent covariate. Shaded areas indicate 95% confidence intervals, calculated as ± 1.96 * standard error (SE)). HR, hazard ratio.

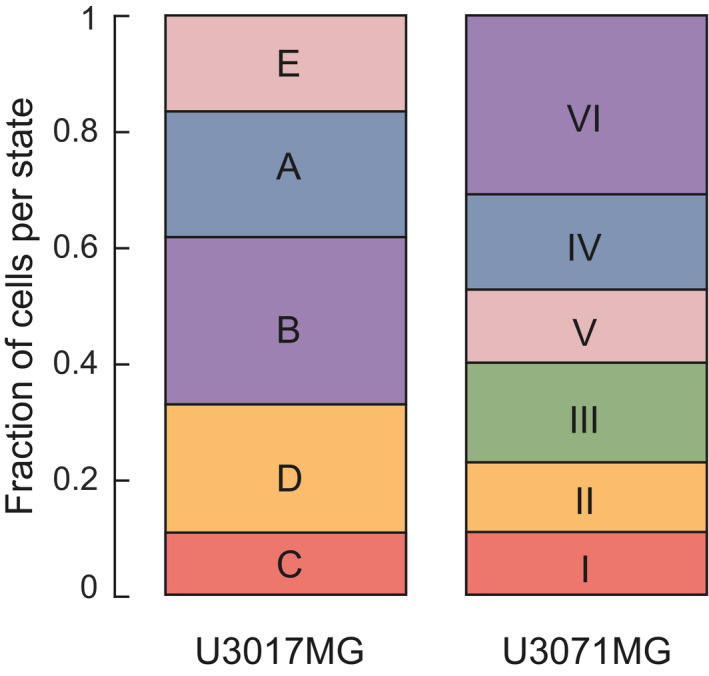
- A, B
UMAP embedding of single cells from the mesenchymal U3071MG (A) and classical U3017MG (B) GBM cell lines, colored according to transcriptional state assignments I–VI and A–F, respectively.
- C, D
Estimated network of state transitions in U3071MG (C) and U3017MG (D). The thickness of the arrows correlates with the rate of transition (number of transitions per day, as in Fig 2E).
- E‐F
State growth rates (number of cell divisions per day) in U3071MG (E) and U3017MG (F).
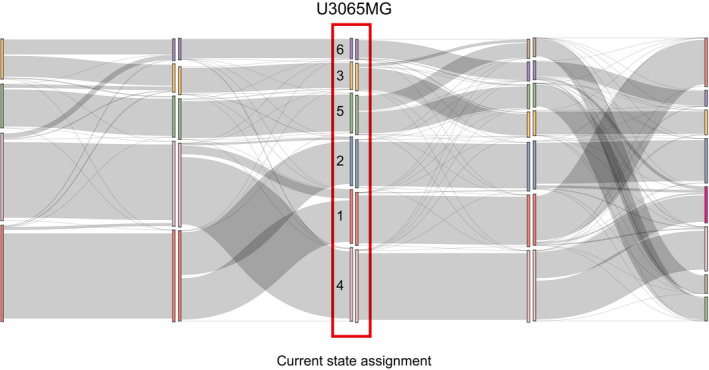
- G, H
Sankey plot of the relation between the states defined in U3065MG cells (1–6), and the states defined in U3071MG cells (I–VI) (G) and in U3017MG cells (A–F) (H). U3071MG and U3017MG cells were scored against U3065MG state 1–6 signatures using ssGSEA.

GSEA of the gene signatures for each of the six states in U3017MG and U3071MG. Blue and red indicate negative and positive enrichments of the pathway. Size of the dot indicates significance (proportional to the GSEA FDR q‐value). Gene sets without PMID reference were obtained from the MSigDB Hallmarks database of gene sets. Abbreviations: oligodendrocyte progenitor cell (OPC), neural progenitor (NPC), mesenchymal (MES), astrocyte (AC), neuronal (NEU), mitochondrial (MTC), proliferative/progenitor (PPR).
State signatures for U3065MG (1–6), U3017MG (A–F), and U3071MG (I–VI) related to embryonic cluster definitions from Eze et al. The heatmap shows enrichment results; red and blue indicate positive and negative enrichments, respectively. The dot plot in the right panel shows mean Carnegie stage for cells in each embryonic cluster. Barplots below the heatmap show Spearman correlation (n = 61) between the enrichment profile for each state and the Carnegie time for each embryonic cluster. Spearman P‐values are shown below barplots.

Experimental design for U3065MG treatment experiments.
STAG estimates of the state‐specific growth rates for untreated U3065MG cells, and cells treated with BMP4 and TMZ. Error bars indicate the 90% confidence interval, based on 1,000 bootstrap replicates.
Estimated network of state transitions in the untreated U3065MG cells. The thickness of the arrows correlates with the rate of transition (number of transitions per day).
Estimated network of state transitions for BMP4‐ and TMZ‐treated U3065MG cells. Red indicates increased rate of transitions compared with untreated cells. Blue indicates decreased rate of transitions compared with untreated cells. Gray indicates transitions of the untreated network.
Conceptual image of how the STAG‐derived A‐matrix can be expressed as eigenvalues and eigenvectors, interpreted as measures of population stability and state equilibria, respectively.
Eigenvalues of the state transition network of TMZ‐treated U3065MG cells and the predicted minimal intervention to obtain bounded growth in each case.
Predicted state equilibria for U3065MG cells in untreated condition and treated with BMP4 or TMZ.

References
-
- Calabrese C, Poppleton H, Kocak M, Hogg TL, Fuller C, Hamner B, Oh EY, Gaber MW, Finklestein D, Allen Met al (2007) A perivascular niche for brain tumor stem cells. Cancer Cell 11: 69–82 - PubMed
Publication types
MeSH terms
LinkOut - more resources
Full Text Sources
Other Literature Sources
Medical
Research Materials
