. 2021 Sep 1;4(9):e2124650.
doi: 10.1001/jamanetworkopen.2021.24650.

Seasonality of Respiratory Viruses at Northern Latitudes

Affiliations

Seasonality of Respiratory Viruses at Northern Latitudes

Michael T Hawkes et al. JAMA Netw Open. .

Abstract

Importance: Every year, respiratory viruses exact a heavy burden on Canadian hospitals during winter months. Generalizable seasonal patterns of respiratory virus transmission may estimate the evolution of SARS-CoV-2 or other emerging pathogens.

Objective: To describe the annual and biennial variation in respiratory virus seasonality in a northern climate.

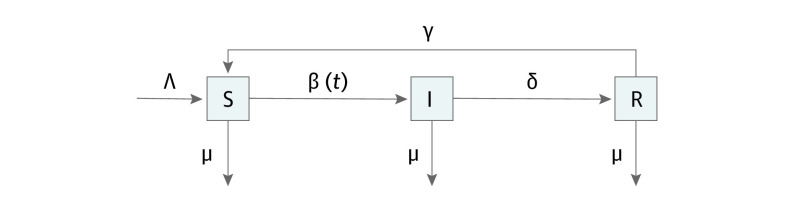
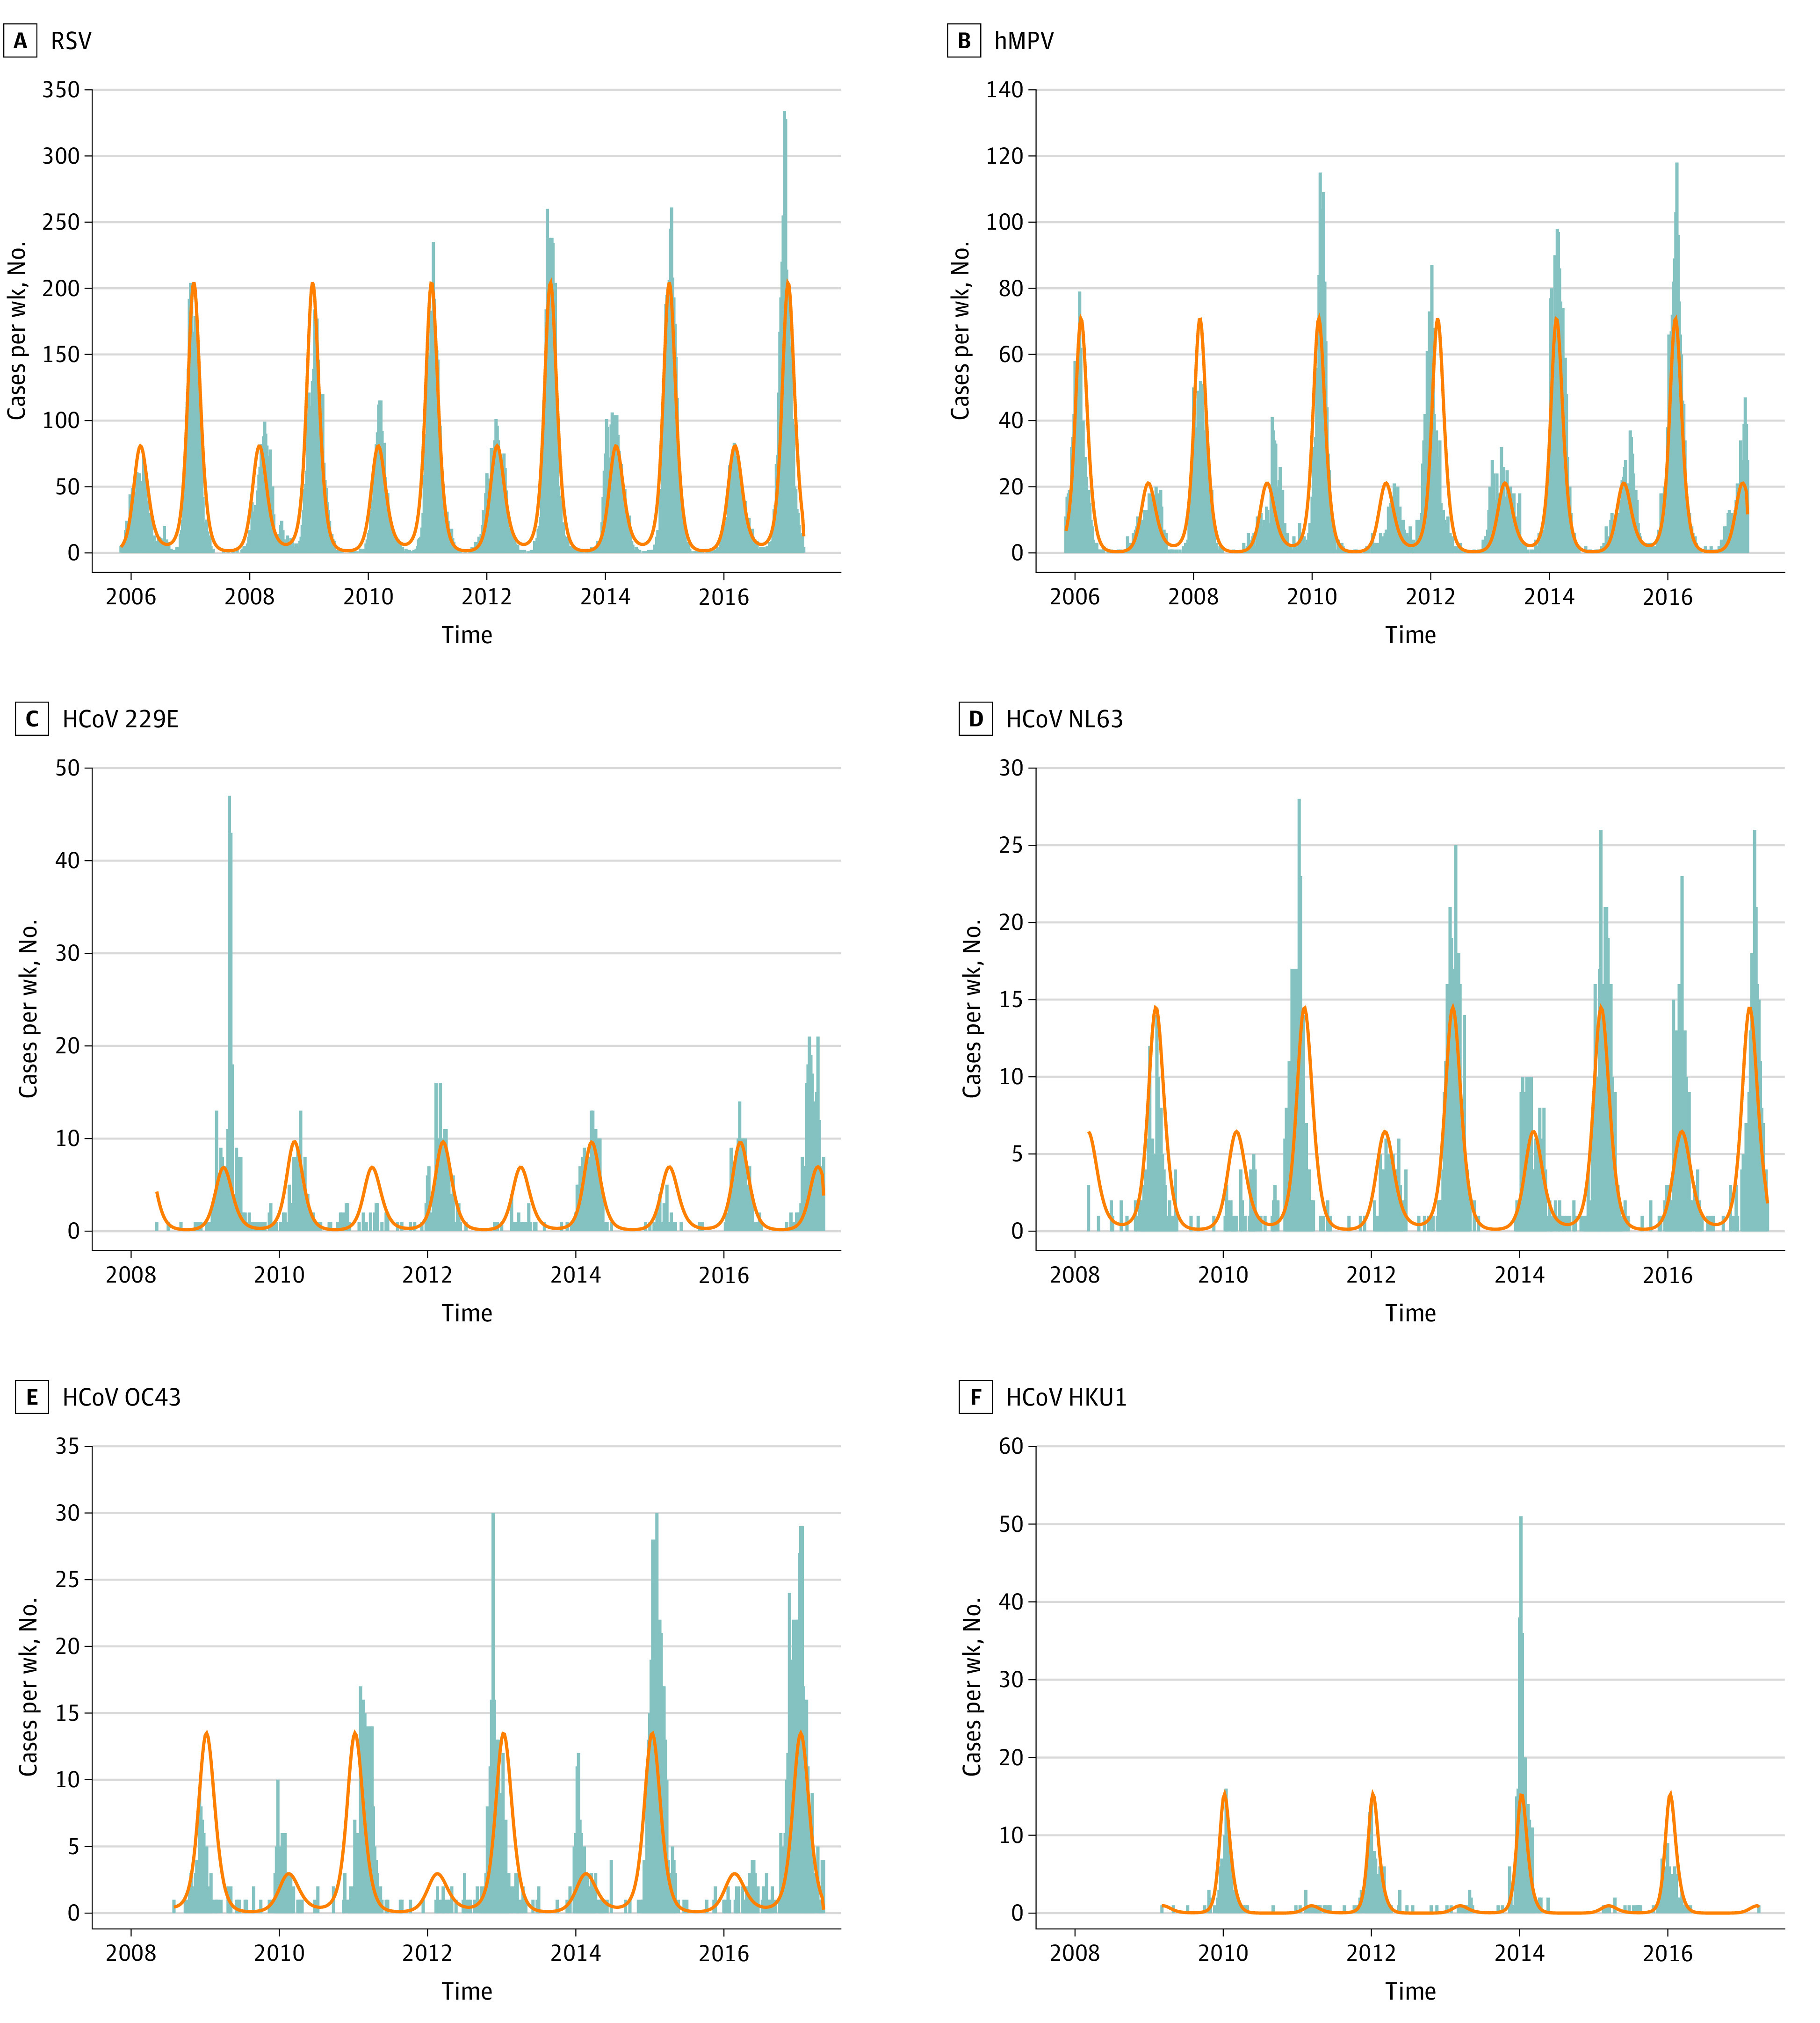
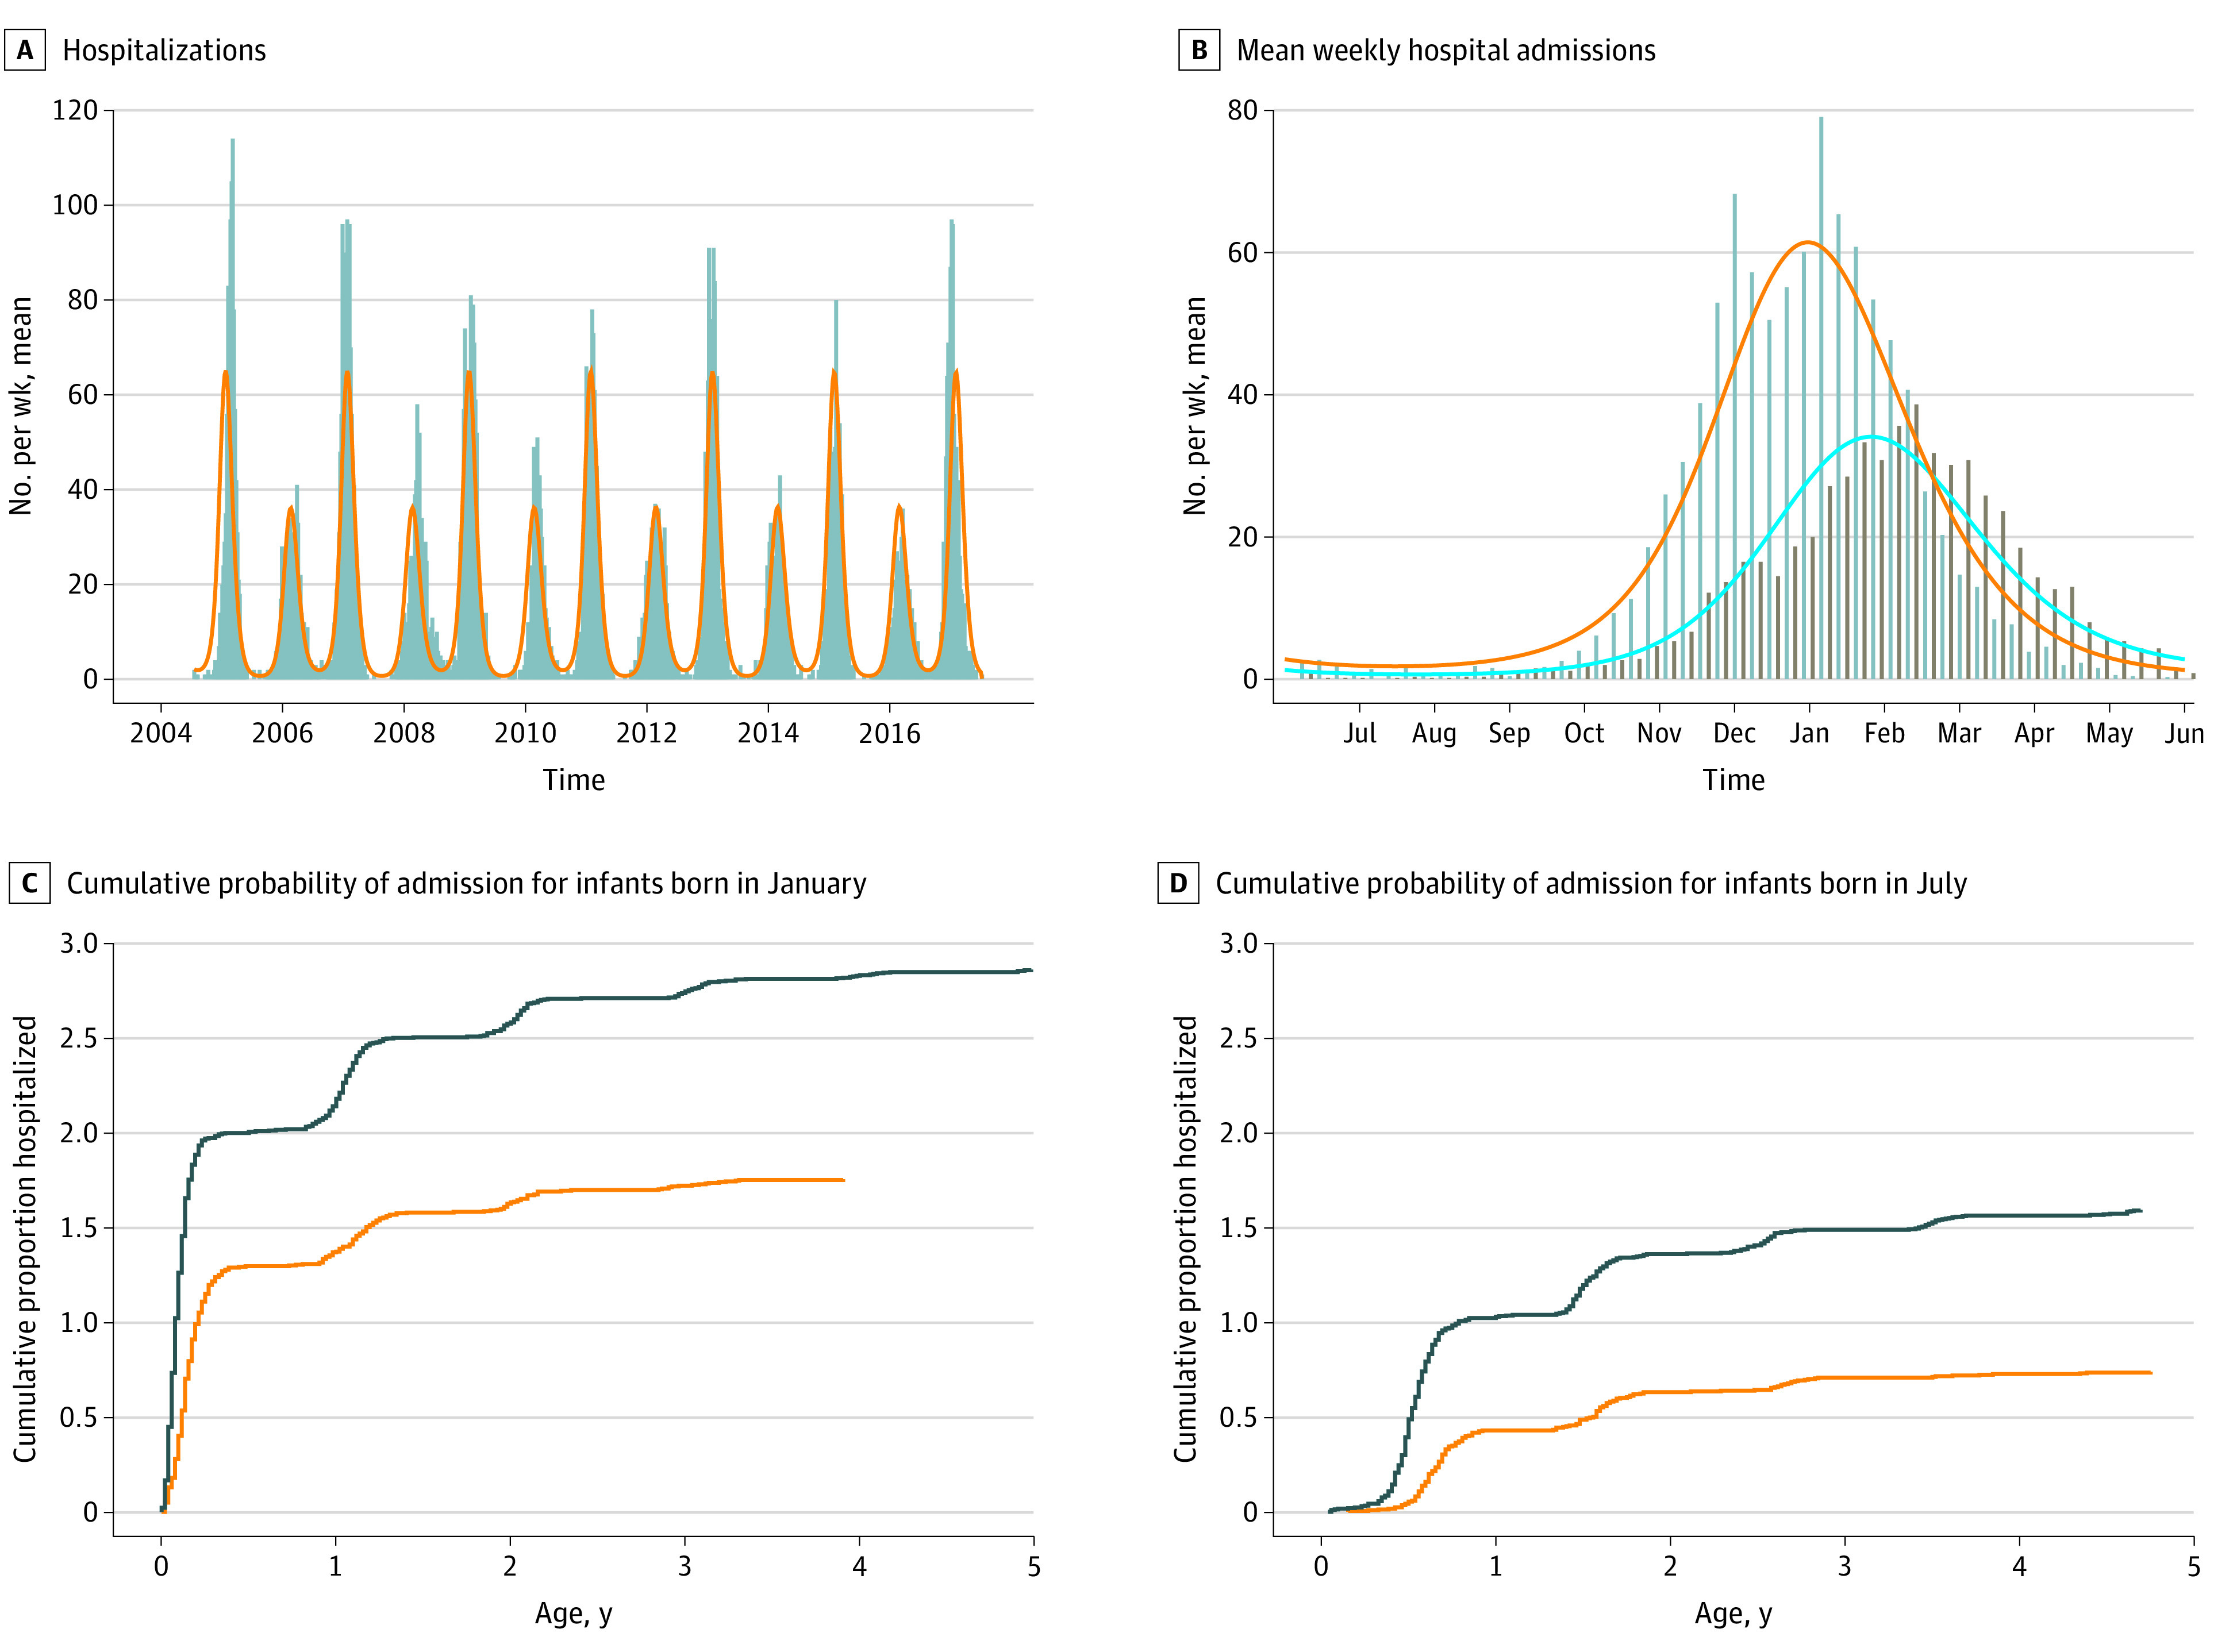
Design, setting, and participants: This cohort study is an epidemiological assessment using population-based surveillance of patients with medically attended respiratory tract infection from 2005 through 2017 in Alberta, Canada. Incident cases of respiratory virus infection and infant respiratory syncytial virus (RSV) hospitalizations in Alberta were extracted from the Data Integration for Alberta Laboratories platform and Alberta Health Services Discharge Abstract Database, respectively. A deterministic susceptible-infected-recovered-susceptible mathematical model with seasonal forcing function was fitted to the data for each virus. The possible future seasonal course of SARS-CoV-2 in northern latitudes was modeled on the basis of these observations. The analysis was conducted between December 15, 2020, and February 10, 2021.

Exposures: Seasonal respiratory pathogens.

Main outcomes and measures: Incidence (temporal pattern) of respiratory virus infections and RSV hospitalizations.

Results: A total of 37 719 incident infections with RSV, human metapneumovirus, or human coronaviruses 229E, NL63, OC43, or HKU1 among 35 375 patients (18 069 [51.1%] male; median [interquartile range], 1.29 [0.42-12.2] years) were documented. A susceptible-infected-recovered-susceptible model mirrored the epidemiological data, including a striking biennial variation with alternating severe and mild winter peaks. Qualitative description of the model and numerical simulations showed that strong seasonal contact rate and temporary immunity lasting 6 to 12 months were sufficient to explain biennial seasonality in these various respiratory viruses. The seasonality of 10 212 hospitalizations among children younger than 5 years with RSV was also explored. The median (interquartile range) rate of hospitalizations per 1000 live births was 18.6 (17.6-19.9) and 11.0 (10.4-11.7) in alternating even (severe) and odd (less-severe) seasons, respectively (P = .001). The hazard of admission was higher for children born in severe (even) seasons compared with those born in less-severe (odd) seasons (hazard ratio, 1.68; 95% CI, 1.61-1.75; P < .001).

Conclusions and relevance: In this modeling study of respiratory viruses in Alberta, Canada, the seasonality followed a pattern estimated by simple mathematical models, which may be informative for anticipating future waves of pandemic SARS-CoV-2.


Conflict of interest statement

Conflict of Interest Disclosures: Dr Hawkes reported receiving grants from the Canadian Institutes of Health Research and Grand Challenges Canada outside the submitted work. No other disclosures were reported.

Figures

Figure 1.
Figure 1.. Susceptible (S) Infected (I) Recovered (R) Susceptible Epidemiological Model Flow Diagram
The variables used in the model include births (Λ), natural deaths (μ), contact rate as an annual periodic function (β(t)), duration of infection (approximately 1/δ), and duration of immunity (approximately 1/γ).
Figure 2.
Figure 2.. Seasonal Epidemics of Selected Respiratory Viruses in Alberta, Canada, 2005-2017
The weekly number of cases (gray bars) detected in the province showed a biennial pattern with alternating high incidence and low incidence seasons. The incidence was accurately modeled with a susceptible-infected-recovered-susceptible model incorporating strong seasonality and temporary protective immunity (orange line). Carry-over of herd immunity from a high-incidence season may explain low incidence in the subsequent season. A, Respiratory syncytial virus (RSV) was the most frequently detected virus (mean [SD], 41.3 [13.0] cases/week) with highest incidence in even seasons (eg, 2010-2011). B, Human metapneumovirus (hMPV) incidence (mean [SE], 12.4 [8.2] cases/week) was highest in odd seasons. C, Human coronavirus (HCoV) 229E was less frequently detected (mean [SE], 2.37 [1.57] cases/week) and exhibited stochastic variation. Incidence was highest in odd seasons, although 1 week of exceptionally high incidence occurred in 2009 and a high incidence season occurred in 2016 to 2017. D, HCoV NL63 incidence (mean [SE], 2.69 [1.75] cases/week) was highest in even seasons. Exceptionally high incidence was observed in 2015 to 2016. E, HCoV OC43 incidence (mean [SE], 1.67 [2.10] cases/week) was highest in even seasons. One week of high activity was noted in 2012. B, HCoV HKU1 incidence (mean [SE], 1.16 [2.04] cases/week) was highest in odd seasons and cases were nearly absent in alternating even seasons. Several weeks of exceptional activity were noted in 2014.
Figure 3.
Figure 3.. Hospitalizations for Respiratory Syncytial Virus (RSV) in Alberta, Canada, 2004-2017
A, Weekly hospitalizations (gray bars) and fitted mathematical model (orange line) show biennial pattern. B, Mean weekly admissions in even respiratory virus seasons (gray bars, orange line) show higher and earlier peak, compared with odd seasons (brown bars, blue line), coinciding with laboratory-based data (Figure 2A). C, Cumulative probability of admission for infants born in January of even (black line) and odd (orange line) seasons. Early infancy during the RSV season was associated with high admission rates in the first months of life, with plateau during the first summer of life and another wave of cases in subsequent winters. Infants born in January of even seasons had a higher hazard of admission over the first 5 years of life. D, Cumulative probability of admission for infants born in July of even (black line) and odd (orange line) seasons. Born in a summer month, the rate of hospitalization was lower in early infancy, with waves of admissions during the first and subsequent winters. Overall, fewer July-born infants were hospitalized with RSV before their fifth birthday than January-born infants, and the risk of hospitalization was lower among infants born in odd seasons.

References

    1. Fendrick AM, Monto AS, Nightengale B, Sarnes M. The economic burden of non-influenza-related viral respiratory tract infection in the United States. Arch Intern Med. 2003;163(4):487-494. doi:10.1001/archinte.163.4.487 - DOI - PubMed
    1. Weber A, Weber M, Milligan P. Modeling epidemics caused by respiratory syncytial virus (RSV). Math Biosci. 2001;172(2):95-113. doi:10.1016/S0025-5564(01)00066-9 - DOI - PubMed
    1. Matoba Y, Abiko C, Ikeda T, et al. . Detection of the human coronavirus 229E, HKU1, NL63, and OC43 between 2010 and 2013 in Yamagata, Japan. Jpn J Infect Dis. 2015;68(2):138-141. doi:10.7883/yoken.JJID.2014.266 - DOI - PubMed
    1. Aberle JH, Aberle SW, Redlberger-Fritz M, Sandhofer MJ, Popow-Kraupp T. Human metapneumovirus subgroup changes and seasonality during epidemics. Pediatr Infect Dis J. 2010;29(11):1016-1018. doi:10.1097/INF.0b013e3181e3331a - DOI - PubMed
    1. Ponciano JM, Capistrán MA. First principles modeling of nonlinear incidence rates in seasonal epidemics. PLoS Comput Biol. 2011;7(2):e1001079. doi:10.1371/journal.pcbi.1001079 - DOI - PMC - PubMed

Publication types