. 2021 Sep 17;373(6561):eabj0486.
doi: 10.1126/science.abj0486. Epub 2021 Sep 17.

Epithelial memory of inflammation limits tissue damage while promoting pancreatic tumorigenesis

Affiliations

Epithelial memory of inflammation limits tissue damage while promoting pancreatic tumorigenesis

Edoardo Del Poggetto et al. Science. .

Abstract

Inflammation is a major risk factor for pancreatic ductal adenocarcinoma (PDAC). When occurring in the context of pancreatitis, KRAS mutations accelerate tumor development in mouse models. We report that long after its complete resolution, a transient inflammatory event primes pancreatic epithelial cells to subsequent transformation by oncogenic KRAS. Upon recovery from acute inflammation, pancreatic epithelial cells display an enduring adaptive response associated with sustained transcriptional and epigenetic reprogramming. Such adaptation enables the reactivation of acinar-to-ductal metaplasia (ADM) upon subsequent inflammatory events, thereby limiting tissue damage through a rapid decrease of zymogen production. We propose that because activating mutations of KRAS maintain an irreversible ADM, they may be beneficial and under strong positive selection in the context of recurrent pancreatitis.


Conflict of interest statement

Competing interests

A.V., A.C., E.D.P and I.H. are inventors on a patent pertaining to the use of ADM inducers to treat pancreatitis and prevent pancreatic cancer.

Figures
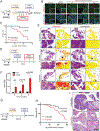
Figure 1.
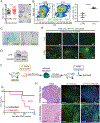
Figure 1.. Transient inflammation promotes tumor progression long after resolution.
A) Schematics representing the experimental design. Briefly iKRAS mice are treated for two days (-D1, D0) with caerulein (CAE) to induce acute pancreatitis and followed for 4 weeks. When pancreata fully recovered from pancreatitis (D28), CAE-treated and control mice were put on doxycycline to induce the expression of mutated KRAS and observed for tumor development. B) Immunofluorescence for NF-κB (p-Ser536, red), E-cadherin (green), and DAPI (blue) in pancreatic samples at different time points before and after CAE treatment. Scale bar=200 μm for main images, scale bar= 50 μm for insets. n=3 mice per group. C) Kaplan-Meier survival plot of mice previously exposed to inflammation (caerulein, n=21) or control mice (untreated, n=10) after KRAS induction. D) Schematic representing the experimental design for (E) and (F). In brief, KRAS was induced in iKRAS mice at 1 month after acute pancreatitis, and pancreata were sampled for histological analysis at 2, 3, and 4 months after KRAS induction. Mice that did not receive acute inflammation were used as control. E) Histopathological evaluation and quantification of KRAS-driven changes over time. For each time point, 4 images are shown per experimental group: upper images, H&E staining at low magnification (left) and corresponding quantification mask (right); lower images, high magnification details of the H&E (left) and corresponding quantification mask (right). Tumor lesions in high magnification H&E panels are highlighted by orange lines. Color code for quantifying mask: Red=tumor lesion, Yellow=normal pancreatic tissue, Black=spleen or lymphoid tissues. Scale bar=2000 μm in upper images, scale bar=100 μm in lower images. F) Quantification of tumor burden (ratio of lesions to normal pancreas) over time as in (E). Data are shown as mean ± SD, n=3 mice per time point per group. Statistical significance was assessed with unpaired Student’s t-test. ns= non-significant. G) Schematic representing the experimental design for (H) and (I). In brief, KRAS is induced in iKRAS mice at 3 months after acute pancreatitis. Mice without acute inflammation are included as controls. Animals were followed for tumor development. H) Kaplan-Meier survival analysis of mice exposed to inflammation (caerulein, n=22) or control mice (untreated, n=12) 3 months before KRAS induction as described in (G). I) H&E staining shows pancreas histology of matched samples as in (H). Scale bar= 200 μm.
Figure 2.
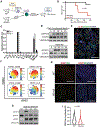
Figure 2.. Cell-autonomous effects of resolved inflammation.
A) Quantification of spheroid size derived from pancreata of wild-type mice recovered from inflammation (CAE) or controls (CTRL). Size was evaluated as pixel log10 scale (9 fields for each condition from three independent experiments; CAE n=69, CTRL n=58; p<0.01). Representative images of spheroids are shown. Scale bar= 50 μm. B) Flow cytometry analysis and quantification of BrdU incorporation by epithelial spheroids derived from wild-type mice pre-exposed or not to caerulein. DAPI is used for DNA content. Data are shown as mean ± SD of three independent experiments. Statistical significance is assessed with unpaired Student’s t-test (p=0.022). C) β-Gal staining of 2D epithelial cultures derived from pancreata of wild-type mice recovered from inflammation (CAE) or control animals (CTRL). Scale bar =100 μm. D) Immunoblots for p16 and vinculin on epithelial cells derived from wild-type pancreata recovered from inflammation (CAE) or controls (CTRL). E) Immunofluorescence for H3k9me3 (Red) on epithelial cultures derived from pancreata of P48-Cre_mT/mG mice recovered from inflammation (CAE) or controls (CTRL). GFP (Green) indicates pancreatic origin of the cells. Cell nuclei are stained with DAPI (Blue). Scale bar =20 μm. F) Schematic representing the experimental design. Briefly, spheroids derived from iKRAS pancreas recovered from animals with pancreatitis (4-weeks recovery) or controls were orthotopically injected into recipient animals never exposed to inflammation. Then KRAS expression was induced and mice followed for tumor development. G) Kaplan-Meier survival plot of mice transplanted with iKRAS spheroids derived from pancreata recovered from pancreatitis (caerulein, n=7) and control mice (untreated, n=5) after KRAS induction. H) H&E staining and immunofluorescence for GFP (Green) and CD45 (Red) of orthotopic tumors and corresponding liver metastases developed from animals injected with spheroids derived from the pancreata of animals previously exposed to inflammation. Cell nuclei are stained with DAPI (Blue). Scale bar=200 μm or scale bar= 50 μm for main or inset images, respectively.
Figure 3.
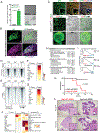
Figure 3.. Pervasive transcriptional deregulation and chromatin changes in epithelial cells recovered from inflammation.
A-D) Single-cell RNA sequencing of ex-vivo pancreatic cells before (CTRL) and after acute inflammation at different time points (day 1_D1, day 7_D7, and day 28_D28). A) Epithelial clusters (acinar and ductal compartments) as identified based on cell type-specific markers reveal transcriptomic deregulation after inflammation mainly in acinar cells. Specifically, acinar cells at D28 remained in a different transcriptional state with respect to control cells (left panel). Unsupervised clustering (right panel) recognized acinar cells at day 28 (D28) after inflammation (orange circle) belonging to separate clusters with respect to untreated control (CTRL) (blue circle), while ductal CTRL and D28 cells clustered together (cyan circle). B) Gene expression dynamics of acinar and ductal markers in acinar compartment across different time points. C) Diseases and biological processes scoring in pathway analysis (IPA) associated with genes expressed in acinar cells at D1, D7, and D28 vs CTRL. D) TF binding sequences enriched in motif analysis of promoter regions of deregulated genes at D28 vs CTRL in acinar cells. E-I) ATAC-seq of ex-vivo epithelial pancreatic cells before (CTRL) and after acute inflammation (D1, D7, and D28). E,F) Density plots and heat maps depicting dynamics of enriched open regions, proximal (E) or distal (F) to gene TSS, at D28 vs CTRL across different time points. G) Pathway analysis (GREAT) of enriched chromatin open region-associated genes at D28 vs CTRL. H,I) Motif enrichment analysis of open chromatin regions at D28 vs CTRL identifying overrepresented sequences recognized by transcription factor families in proximal (H) or distal (I) regions. J) Expression of transcription factors identified via motif enrichment analysis in single-cell RNA sequencing across different time points before and after acute inflammation (D, H and I).
Figure 4.
Figure 4.. Progenitor cells undergo persistent reprogramming after inflammation, and EGR1 is a critical player in promoting tumorigenesis.
A) Relative spherogenic potential of cells sorted from single cell suspension of pancreata isolated from Dclk1-DTR-ZsGreen mice based on their fluorescence: ZsGreen positive (DCLK1+), ZsGreen negative (DCLK1-) (n=3). Data are shown as mean ± SD. Statistical significance was assessed by unpaired Student’s t-test. Scale bar= 50 μm. B) Green spheroids derived from untreated P48-Cre_mT/mG mice were orthotopically transplanted into pancreata of WT animals 48 hours after CAE treatment. Cryosections of pancreata from mice euthanized at 4 weeks after implantation revealed GFP-positive lobules (Green) colocalized with acinar functional marker amylase (Purple). Cell nuclei were stained with DAPI (Blue). Scale bar =20 μm. C) Upper panels: Mist1-CreERT2_mT/mG mice were treated with tamoxifen to induce nuclear transfer of Cre recombinase followed by acute inflammation induction. Pancreata were then collected and part of the tissues was stained against GFP (Green) and amylase (Red) to show efficiency of Cre recombination in acinar compartment. DAPI was used to counterstain nuclei (Blue). White arrow indicates a non-recombined ductal and stromal structure. Scale bar=200 μm or scale bar= 50 μm for main or inset images, respectively. Middle and bottom panels: the other part of collected tissues was used to establish epithelial spheroid cultures. The GFP-positivity of spheroids indicates the acinar origin. D-G) ATAC-seq of isolated DCLK1-positive cells before (CTRL) and after acute inflammation (D1 and D28). D,E) Density plot and heat map depicts dynamics of enriched open TSS proximal (D) or distal (E) regions at D28 vs CTRL across different time points in DCLK1-positive cells. F,G) Motif analysis of enriched chromatin open regions at D28 vs CTRL identifies over-represented sequences recognized by transcription factor families in proximal (F) or distal (G) regions. H,I) Bulk RNA-seq on wild-type mouse pancreatic spheroids derived from pancreas pre-exposed or not to inflammation. H) Pathway analysis (IPA) of genes associated with diseases or biological functions enriched after inflammation vs. control. Highest-ranked terms are shown. I) GSEA enrichment plots showing the hallmark signature Kras signaling and Development and Progression signature including genes coregulated during development and carcinogenesis in pancreatic cells (28). The p53 Pathway signature, which is enriched in down-regulated genes, is also shown. Genes are ranked from left to right based on signed p-value, with genes on the left showing significantly higher expression after inflammation treatment. NES, normalized enrichment score; FDR, false discovery rate. J) Motif enrichment analysis of TF binding site over-representation at promoters and distal regions. The over-represented families of TFs at the promoters of up-regulated (Up-P) and down-regulated (Down-P) genes in spheroid bulk RNA-seq relative to all Refseq genes are shown on the left. The right panel shows the over-represented TF families at the differentially acetylated TSS-distal regions in spheroid ChIP-seq (using the FANTOM5 collection of enhancers as background). The heat map shows the negative logarithm of the enrichment P-value determined by a two-tailed Welch’s t-test. K) Kaplan-Meier survival plot of Egr1-WT_iKRAS mice (n=6) and Egr1-null_iKRAS mice (n=9) after oncogenic KRAS induction at day 28 after acute inflammation. I) H&E staining of Egr1-WT_iKRAS mice and matched Egr1-null_iKRAS mice. Scale bar=500 μm or scale bar= 50 μm for main or inset images, respectively.
Fig. 5.
Fig. 5.. IL-6 is a mediator of epithelial memory.
(A) Schematic representing the experimental design. Briefly, spheroids derived from iKRAS mice were cocultured in the presence or absence of CD45-positive cells isolated from animals with acute pancreatitis. After 1 week, conditioned spheroids were moved to conventional medium for another 4 weeks and then transplanted orthotopically into recipient mice and KRAS induced. (B) Kaplan-Meier survival plot of mice transplanted with conditioned (CD45, n = 5) or nonconditioned spheroids (CTRL, n = 7) after KRAS induction. (C) Cytokine array of medium conditioned for 1 or 7 days with CD45. Absorbance for different antibodies is reported. Data are shown as mean ± SD. (D) Immunoblotting for pSTAT3 (phospho-Tyr705), STAT3, and vinculin in spheroids exposed to CD45 conditioned medium (top) or hyper-IL-6 200 ng/ml (bottom) for the indicated amounts of time. (E) Immunofluorescence staining for IL-6 (red), pSTAT3 (green), and DAPI (blue) in pancreatic samples at day 1 after CAE treatment showing multiple pSTAT3 nuclear–positive cells, including many acinar structures (yellow dashed lines), interspersed among IL-6–positive cells. Scale bar is 120 μm. (F) CyTOF immunophenotyping of CD45-positive cells infiltrating the pancreas during acute pancreatitis. tSNE plots for CD68, CD11b, F4/80, and IL-6 are presented. (G) Immunoblotting for pSTAT3 (phospho-Tyr705), STAT3, EGR1, and vinculin in spheroids exposed to hyper-IL-6 200 ng/ml for 24 hours and then sampled at the indicated time points after hyper-IL-6 wash-out. NT, nontreated. (H) Pancreas from WT or Il6-null mice at day 1 after acute inflammation were harvested and immunostained for EGR1 (red). Cell nuclei were counterstained with DAPI (blue). Green channel (BG), although unstained, has been acquired and used to highlight tissue architecture and vessels. Scale bars are 200 μm. (I) Quantification of nuclear signal as pixel log10 intensity for EGR1 as in (H). Data are shown as violin plots (n = 3 mice per group). Statistical significance was assessed by unpaired Student’s t test. AU, arbitrary units.
Figure 6.
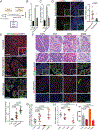
Figure 6.. ADM as a physiological and reversible adaptation to limit tissue damage.
A) Schematic representing the experimental design. To investigate the role of epithelial memory, wild type or iKRAS mice were rechallenged with a second acute pancreatitis after complete recovery from a previous one. Pharmacologic modulation of ADM or KRAS induction was achieved by treating mice with EGF, MEK inhibitor, or doxycycline (KRAS induction) 2 days before and during the administration of caerulein. B,C) Concentrations of amylase (B) and LDH (C) detected in the peripheral blood at 24 h after the induction of acute pancreatitis (D0) in WT mice; untreated mice (CTRL, n=3), mice without memory after a single inflammation (Single, n=3), mice with memory after rechallenge (Rechallenge, n=3). Data are shown as mean ± SD. Statistical significance was assessed with one-way ANOVA. D) Immunofluorescence for cleaved caspase 3 (CC3-Red) and DAPI (Blue) of pancreata at 24 h after the induction of acute pancreatitis (D0) in WT mice with (Rechallenged) or without memory (Single inflammation). Green channel (BG), although unstained, was acquired and used to highlight tissue architecture and vessel. Scale bar= 200 μm or scale bar=100 μm for main or inset images, respectively. Quantification of cleaved caspase-3 in single inflammation and rechallenged group is shown (right panel). Each dot represents CC3-positive area per field. n=4 mice per group. Statistical significance was assessed by unpaired Student’s t-test. E) Immunofluorescence for CK19 (Green), amylase (Red), and DAPI (Blue) at 24 h (Day 1) after a 2-day inflammation in wild-type mice (Untreated) or mice with (Rechallenge) or without memory (Single inflammation). Scale bar=200 μm or scale bar=50 μm for main and inset images, respectively. Quantification of CK19/Amy ratio in the same experimental groups is shown in the lower panel. Each dot represents CK19/Amy ratio per field. n=3 mice per group. Data are shown as mean ± SD. Statistical significance was assessed with one-way ANOVA. F) Upper panels: H&E staining of pancreata of iKRAS mice at day 1 after rechallenge in presence/absence of pharmacological treatment with EGF, MEK inhibitor, or induction of KRAS. Scale bar=100 μm. Middle panel: Immunofluorescence for CK19 (Green), amylase (Red), and DAPI (Blue) at 24 h (Day 1) after rechallenge in presence/absence of pharmacological treatment with EGF, MEK inhibitor, or induction of KRAS. Scale bar=200 μm or scale bar= 50 μm for main or inset images, respectively. Lower panels: Damage evaluation in iKRAS-rechallenged mice, immunofluorescence for cleaved caspase 3 (CC3-Red) and DAPI (Blue) at 24 h (Day 1) after rechallenge in presence/absence of pharmacological treatment with EGF, MEK inhibitor, or induction of KRAS. Green channel (BG), although unstained, has been acquired and used to highlight tissue architecture and vessels. Scale bar=200 μm or scale bar= 50 μm for main or inset images, respectively. G) Extent of ADM in (F) middle panels is quantified as CK19/Amy ratio. Each dot represents CK19/Amy ratio per field. n=3 mice per group. Data are shown as mean ± SD. Statistical significance was assessed with one-way ANOVA. H) Pancreatic damage quantification evaluated as cleaved caspase-3-positive area (Log 10 scale), same setting as in (F) lower panels. Each dot represents CC3-positive area per field. n=3 mice per group. Data are shown as mean ± SD. Statistical significance was assessed with one-way ANOVA. I) Concentrations of LDH detected in the peripheral blood at 24 h (Day 1) after rechallenge in presence/absence of pharmacological treatment with EGF, MEK inhibitor, or induction of KRAS (n=3 for each group). Data are shown as mean ± SD. Statistical significance was assessed with one-way ANOVA.

Comment in

  • Under pressure.
    Seton-Rogers S. Seton-Rogers S. Nat Rev Cancer. 2021 Dec;21(12):743. doi: 10.1038/s41568-021-00416-3. Nat Rev Cancer. 2021. PMID: 34611351 No abstract available.

References

    1. Virchow R, Cellular pathology as based upon physiological and pathological histology. (J. B. Lippincott, Philadelphia, 1863). 10.5962/bhl.title.32770 - DOI - PubMed
    1. Mantovani A, Allavena P, Sica A, Balkwill F, Cancer-related inflammation. Nature 454, 436–444 (2008). - PubMed
    1. Grivennikov SI, Greten FR, Karin M, Immunity, inflammation, and cancer. Cell 140, 883–899 (2010). - PMC - PubMed
    1. Alonso-Curbelo D et al. , A gene-environment-induced epigenetic program initiates tumorigenesis. Nature 590, 642–648 (2021). - PMC - PubMed
    1. Ying H et al. , Genetics and biology of pancreatic ductal adenocarcinoma. Genes & development 30, 355–385 (2016). - PMC - PubMed

Publication types

MeSH terms