. 2021 Sep 17;70(5):1-32.
doi: 10.15585/mmwr.ss7005a1.

Asthma Surveillance - United States, 2006-2018

Affiliations

Asthma Surveillance - United States, 2006-2018

Cynthia A Pate et al. MMWR Surveill Summ. .

Abstract

Problem: Asthma is a chronic disease of the airways that requires ongoing medical management. Socioeconomic and demographic factors as well as health care use might influence health patterns in urban and rural areas. Persons living in rural areas tend to have less access to health care and health resources and worse health outcomes. Characterizing asthma indicators (i.e., prevalence of current asthma, asthma attacks, emergency department and urgent care center [ED/UCC] visits, and asthma-associated deaths) and determining how asthma exacerbations and health care use vary across the United States by geographic area, including differences between urban and rural areas, and by sociodemographic factors can help identify subpopulations at risk for asthma-related complications.

Reporting period: 2006-2018.

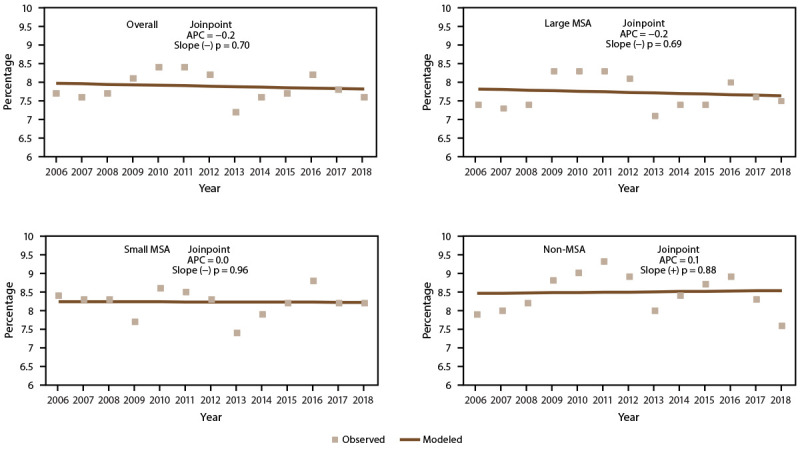
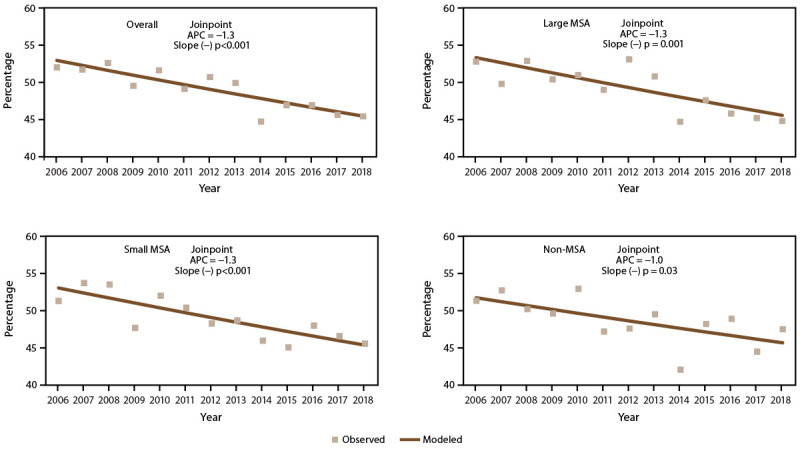
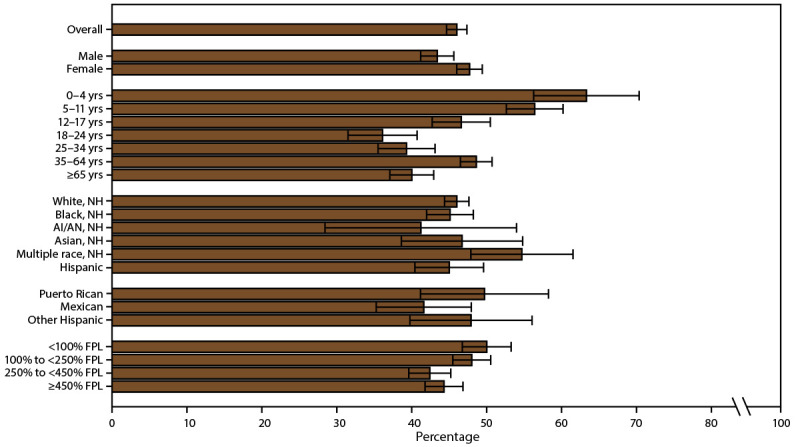
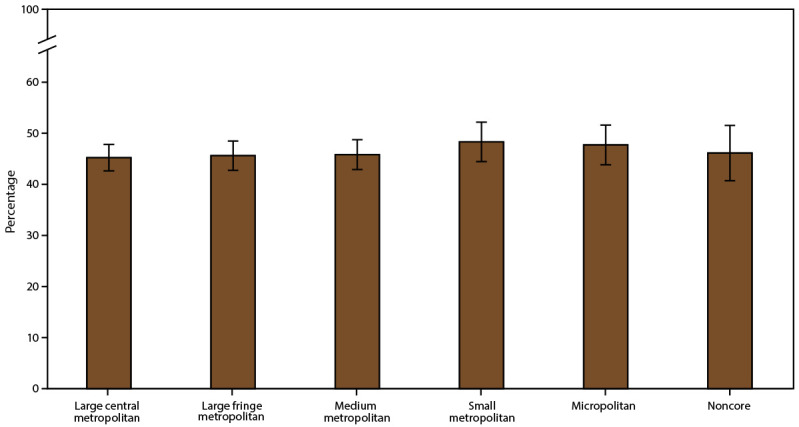
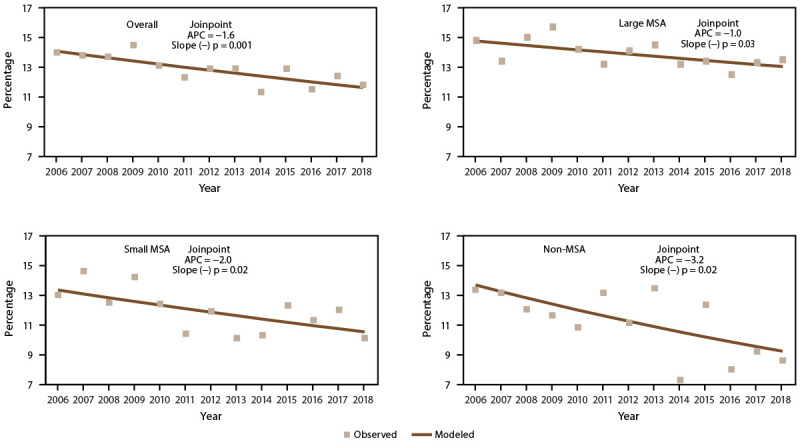
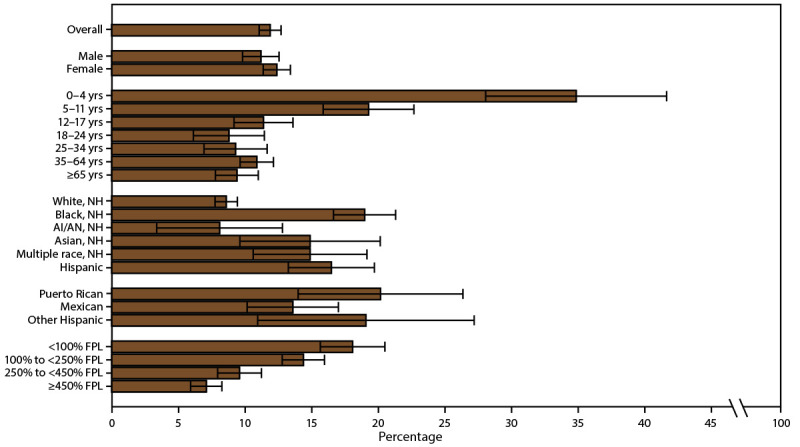
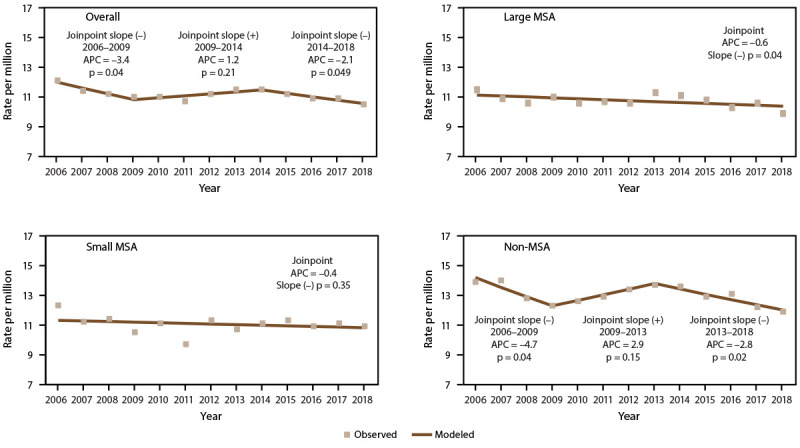
Description of system: The National Health Interview Survey (NHIS) is an annual cross-sectional household health survey among the civilian noninstitutionalized population in the United States. NHIS data were used to produce estimates for current asthma and among them, asthma attacks and ED/UCC visits. National Vital Statistics System (NVSS) data were used to estimate asthma deaths. Estimates of current asthma, asthma attacks, ED/UCC visits, and asthma mortality rates are described by demographic characteristics, poverty level (except for deaths), and geographic area for 2016-2018. Trends in asthma indicators by metropolitan statistical area (MSA) category for 2006-2018 were determined. Current asthma and asthma attack prevalence are provided by MSA category and state for 2016-2018. Detailed urban-rural classifications (six levels) were determined by merging 2013 National Center for Health Statistics (NCHS) urban-rural classification data with 2016-2018 NHIS data by county and state variables. All subregional estimates were accessed through the NCHS Research Data Center.

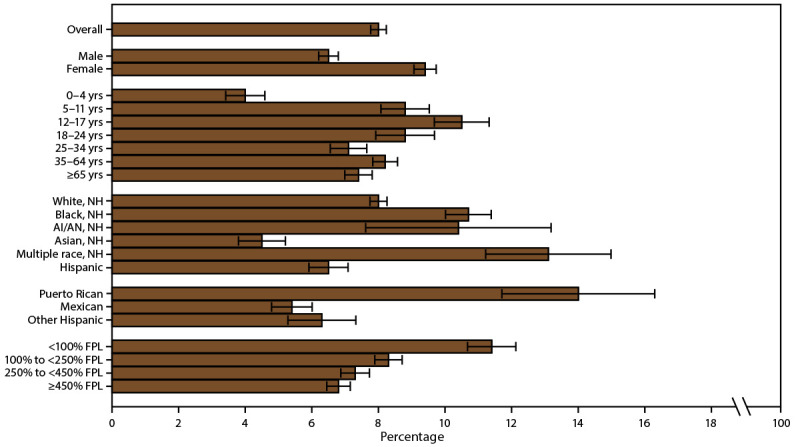
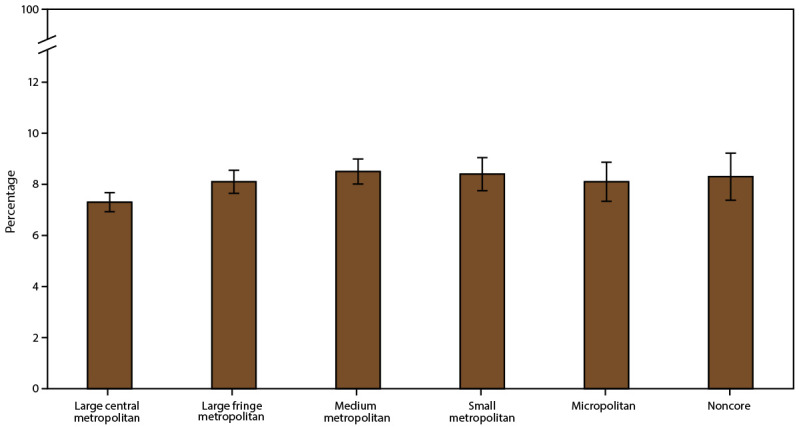
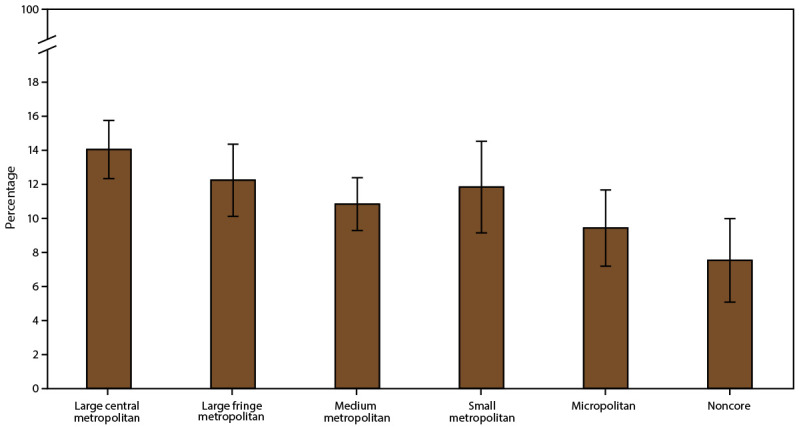
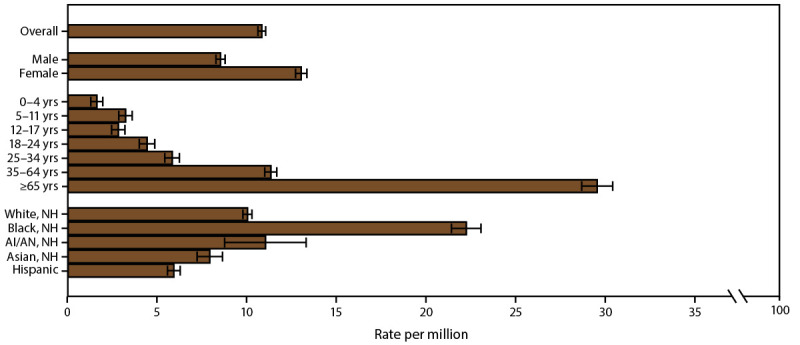
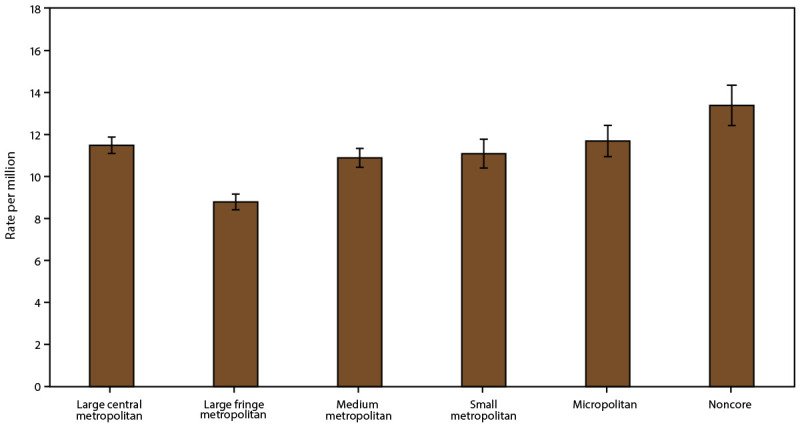
Results: Current asthma was higher among boys aged <18 years, women aged ≥18 years, non-Hispanic Black (Black) persons, non-Hispanic multiple-race (multiple-race) persons, and Puerto Rican persons. Asthma attacks were more prevalent among children, females, and multiple-race persons. ED/UCC visits were more prevalent among children, women aged ≥18 years, and all racial and ethnic groups (i.e., Black, non-Hispanic Asian, multiple race, and Hispanic, including Puerto Rican, Mexican, and other Hispanic) except American Indian and Alaska Native persons compared with non-Hispanic White (White) persons. Asthma deaths were higher among adults, females, and Black persons. All pertinent asthma outcomes were also more prevalent among persons with low family incomes. Current asthma prevalence was higher in the Northeast than in the South and the West, particularly in small MSA areas. The prevalence was also higher in small and medium metropolitan areas than in large central metropolitan areas. The prevalence of asthma attacks differed by MSA category in four states. The prevalence of ED/UCC visits was higher in the South than the Northeast and the Midwest and was also higher in large central metropolitan areas than in micropolitan and noncore areas. The asthma mortality rate was highest in non-MSAs, specifically noncore areas. The asthma mortality rate was also higher in the Northeast, Midwest, and West than in the South. Within large MSAs, asthma deaths were higher in the Northeast and Midwest than the South and West.

Interpretation: Despite some improvements in asthma outcomes over time, the findings from this report indicate that disparities in asthma indicators persist by demographic characteristics, poverty level, and geographic location.

Public health action: Disparities in asthma outcomes and health care use in rural and urban populations identified from NHIS and NVSS can aid public health programs in directing resources and interventions to improve asthma outcomes. These data also can be used to develop strategic goals and achieve CDC's Controlling Childhood Asthma and Reducing Emergencies (CCARE) initiative to reduce childhood asthma hospitalizations and ED visits and prevent 500,000 asthma-related hospitalizations and ED visits by 2024.


Conflict of interest statement

All authors have completed and submitted the International Committee of Medical Journal Editors form for disclosure of potential conflicts of interest. No potential conflicts of interest were disclosed.

Figures

FIGURE 1
FIGURE 1
Current asthma* prevalence, by sex, age group, race/ethnicity,§ and federal poverty level — United States, 2016–2018 Source: CDC, National Center for Health Statistics, National Health Interview Survey. https://www.cdc.gov/nchs/nhis/index.htm Abbreviations: AI/AN = American Indian or Alaska Native; FPL = federal poverty level; NH = non-Hispanic. * Includes persons who answered “yes” to the questions, “Have you ever been told by a doctor or other health professional that you had asthma?” and “Do you still have asthma?” Prevalence is the proportion of the population who reported having current asthma, with 95% confidence intervals indicated by error bars. § Puerto Rican, Mexican, and other Hispanic are subsets of Hispanic. Determined by family income and size using U.S. Census Bureau poverty thresholds. Poverty level is defined as the ratio of family income to federal poverty threshold in terms of FPL.
FIGURE 2
FIGURE 2
Current asthma* prevalence, by metropolitan statistical area category§ — United States, 2006–2018 Source: CDC, National Center for Health Statistics, National Health Interview Survey. https://www.cdc.gov/nchs/nhis/index.htm Abbreviations: APC = annual percent change; MSA = metropolitan statistical area. * Includes persons who answered “yes” to the questions, “Have you ever been told by a doctor or other health professional that you had asthma?” and “Do you still have asthma?” Prevalence is the proportion of the population who reported having current asthma. Significance set at p<0.05. § Large MSAs have a population of ≥1 million; small MSAs have a population of <1 million. Non-MSAs consist of persons not living in an MSA.
FIGURE 3
FIGURE 3
Current asthma* prevalence, by urban-rural classification§ — United States, 2016–2018 Source: CDC, National Center for Health Statistics, National Health Interview Survey. https://www.cdc.gov/nchs/nhis/index.htm Abbreviation: MSA = metropolitan statistical area. * Includes persons who answered “yes” to the questions, “Have you ever been told by a doctor or other health professional that you had asthma?” and “Do you still have asthma?” Prevalence is the proportion of the population who reported having current asthma, with 95% confidence intervals indicated by error bars. § Large central metropolitan areas are counties in MSAs of ≥1 million population containing the principal city; large fringe metropolitan areas are counties in MSAs of ≥1 million population not containing the principal city; medium metropolitan areas are counties in MSAs of 250,000–999,999 population; small metropolitan areas are counties in MSAs of <250,000 population; micropolitan areas have an urban cluster population of 10,000–49,999; and noncore areas include nonmetropolitan areas that did not qualify as micropolitan, including those without an urban cluster population of at least 10,000.
FIGURE 4
FIGURE 4
Asthma attack prevalence* among persons with current asthma, by year and metropolitan statistical area category§ — United States, 2006–2018 Source: CDC, National Center for Health Statistics, National Health Interview Survey. https://www.cdc.gov/nchs/nhis/index.htm Abbreviations: APC = annual percent change; MSA = metropolitan statistical area. * Prevalence is the proportion of the population with current asthma who reported having one or more episodes of asthma or an asthma attack in the past 12 months. Significance set at p<0.05. Includes persons who answered “yes” to the questions, “Have you ever been told by a doctor or other health professional that you had asthma?” and “Do you still have asthma?” § Large MSAs have a population of ≥1 million; small MSAs have a population of <1 million. Non-MSAs consist of persons not living in an MSA.
FIGURE 5
FIGURE 5
Asthma attack prevalence* among persons with current asthma, by sex, age group, race/ethnicity,§ and federal poverty level — United States, 2016–2018 Source: CDC, National Center for Health Statistics, National Health Interview Survey. https://www.cdc.gov/nchs/nhis/index.htm Abbreviations: AI/AN = American Indian or Alaska Native; FPL = federal poverty level; NH = non-Hispanic. * Prevalence is the proportion of the population with current asthma who reported having one or more episodes of asthma or an asthma attack in the past 12 months, with 95% confidence intervals indicated by error bars. Includes persons who answered “yes” to the questions, “Have you ever been told by a doctor or other health professional that you had asthma?” and “Do you still have asthma?” § Puerto Rican, Mexican, and other Hispanic are subsets of Hispanic. Determined by family income and size using U.S. Census Bureau poverty thresholds. Poverty level is defined as the ratio of family income to federal poverty threshold in terms of FPL.
FIGURE 6
FIGURE 6
Asthma attack prevalence* among persons with current asthma, by urban-rural classification§ — United States, 2016–2018 Source: CDC, National Center for Health Statistics, National Health Interview Survey. https://www.cdc.gov/nchs/nhis/index.htm Abbreviation: MSA = metropolitan statistical area. * Prevalence is the proportion of the population with current asthma who reported having one or more episodes of asthma or an asthma attack in the past 12 months, with 95% confidence intervals indicated by error bars. Includes persons who answered “yes” to the questions, “Have you ever been told by a doctor or other health professional that you had asthma?” and “Do you still have asthma?” § Large central metropolitan areas are counties in MSAs of ≥1 million population containing the principal city; large fringe metropolitan areas are counties in MSAs of ≥1 million population not containing the principal city; medium metropolitan areas are counties in MSAs of 250,000–999,999 population; small metropolitan areas are counties in MSAs of <250,000 population; micropolitan areas have an urban cluster population of 10,000–49,999; and noncore areas include nonmetropolitan areas that did not qualify as micropolitan, including those without an urban cluster population of at least 10,000.
FIGURE 7
FIGURE 7
Prevalence of emergency department and urgent care center visits* because of asthma among persons with current asthma, by year and metropolitan statistical area category§ — United States, 2006–2018 Source: CDC, National Center for Health Statistics, National Health Interview Survey. https://www.cdc.gov/nchs/nhis/index.htm Abbreviations: APC = annual percent change; MSA = metropolitan statistical area. * Prevalence is the proportion of the population with current asthma who reported having had one or more emergency department or urgent care center visits because of asthma in the past 12 months. Significance set at p<0.05. Includes persons who answered “yes” to the questions, “Have you ever been told by a doctor or other health professional that you had asthma?” and “Do you still have asthma?” § Large MSAs have a population of ≥1 million; small MSAs have a population of <1 million. Non-MSAs consist of persons not living in an MSA.
FIGURE 8
FIGURE 8
Prevalence of emergency department and urgent care center visits* because of asthma among persons with current asthma, by sex, age group, race/ethnicity,§ and federal poverty level — United States, 2016–2018 Source: CDC, National Center for Health Statistics, National Health Interview Survey. https://www.cdc.gov/nchs/nhis/index.htm Abbreviations: AI/AN = American Indian or Alaska Native; FPL = federal poverty level; NH = non-Hispanic. * Prevalence is the proportion of the population with current asthma who reported having had one or more emergency department or urgent care center visits because of asthma in the past 12 months, with 95% confidence intervals indicated by error bars. Includes persons who answered “yes” to the questions, “Have you ever been told by a doctor or other health professional that you had asthma?” and “Do you still have asthma?” § Puerto Rican, Mexican, and other Hispanic are subsets of Hispanic. Determined by family income and size using U.S. Census Bureau poverty thresholds. Poverty level is defined as the ratio of family income to federal poverty threshold in terms of FPL.
FIGURE 9
FIGURE 9
Prevalence of emergency department visits and urgent care center visits* because of asthma among persons with current asthma, by urban-rural classification§ — United States, 2016–2018 Source: CDC, National Center for Health Statistics, National Health Interview Survey. https://www.cdc.gov/nchs/nhis/index.htm * Prevalence is the proportion of the population with current asthma who reported having had one or more emergency department or urgent care center visits because of asthma in the past 12 months, with 95% confidence intervals indicated by error bars. Includes persons who answered “yes” to the questions, “Have you ever been told by a doctor or other health professional that you had asthma?” and “Do you still have asthma?” § Large central metropolitan areas are counties in MSAs of ≥1 million population containing the principal city; large fringe metropolitan areas are counties in MSAs of ≥1 million population not containing the principal city; medium metropolitan areas are counties in MSAs of 250,000–999,999 population; small metropolitan areas are counties in MSAs of <250,000 population; micropolitan areas have an urban cluster population of 10,000–49,999; and noncore areas include nonmetropolitan areas that did not qualify as micropolitan, including those without an urban cluster population of at least 10,000.
FIGURE 10
FIGURE 10
Asthma mortality rate,* by year and metropolitan statistical area category — United States, 2006–2018 Source: CDC, National Center for Health Statistics, National Health Interview Survey. https://www.cdc.gov/nchs/nhis/index.htm Abbreviations: APC = annual percent change; MSA = metropolitan statistical area. * Underlying cause of death is asthma; includes International Classification of Diseases, Tenth Revision codes J45–J46. Statistical significance set at p<0.05. Large MSAs have a population of ≥1 million; small MSAs have a population of <1 million. Non-MSAs consist of persons not living in an MSA.
FIGURE 11
FIGURE 11
Asthma mortality rate,* by sex, age group, and race/ethnicity — United States, 2016–2018 Source: CDC, National Center for Health Statistics, National Health Interview Survey. https://www.cdc.gov/nchs/nhis/index.htm Abbreviations: AI/AN = American Indian or Alaska Native; NH = non-Hispanic. * Underlying cause of death is asthma; includes International Classification of Diseases, Tenth Revision codes J45–J46; 95% confidence intervals are indicated by error bars.
FIGURE 12
FIGURE 12
Asthma mortality rate,* by urban-rural classification — United States, 2016–2018 Source: CDC, National Center for Health Statistics, National Health Interview Survey. https://www.cdc.gov/nchs/nhis/index.htm Abbreviation: MSA = metropolitan statistical area. * Underlying cause of death is asthma; includes International Classification of Diseases, Tenth Revision codes J45–J46; 95% confidence intervals are indicated by error bars. Large central metropolitan areas are counties in MSAs of ≥1 million population containing the principal city; large fringe metropolitan areas are counties in MSAs of ≥1 million population not containing the principal city; medium metropolitan areas are counties in MSAs of 250,000–999,999 population; small metropolitan areas are counties in MSAs of <250,000 population; micropolitan areas have an urban cluster population of 10,000–49,999; and noncore areas include nonmetropolitan areas that did not qualify as micropolitan, including those without an urban cluster population of at least 10,000.

References

    1. CDC. Asthma: most recent national asthma data. Atlanta, GA: US Department of Health and Human Services, CDC; 2020. https://www.cdc.gov/asthma/most_recent_national_asthma_data.htm
    1. Nurmagambetov T, Kuwahara R, Garbe P. The economic burden of asthma in the United States, 2008–2013. Ann Am Thorac Soc 2018;15:348–56. 10.1513/AnnalsATS.201703-259OC - DOI - PubMed
    1. Hsu J, Qin X, Beavers SF, Mirabelli MC. Asthma-related school absenteeism, morbidity, and modifiable factors. Am J Prev Med 2016;51:23–32. 10.1016/j.amepre.2015.12.012 - DOI - PMC - PubMed
    1. CDC. AsthmaStats: asthma-related missed school days among children aged 5–17 years. Atlanta, GA: US Department of Health and Human Services, CDC; 2020. https://www.cdc.gov/asthma/asthma_stats/missing_days.htm
    1. Zahran HS, Bailey CM, Damon SA, Garbe PL, Breysse PN. Vital signs: asthma in children—United States, 2001–2016. MMWR Morb Mortal Wkly Rep 2018;67:149–55. 10.15585/mmwr.mm6705e1 - DOI - PMC - PubMed

MeSH terms