. 2021 Sep 16;19(9):e3001400.
doi: 10.1371/journal.pbio.3001400. eCollection 2021 Sep.

Cerebellar complex spikes multiplex complementary behavioral information

Affiliations

Cerebellar complex spikes multiplex complementary behavioral information

Akshay Markanday et al. PLoS Biol. .

Abstract

Purkinje cell (PC) discharge, the only output of cerebellar cortex, involves 2 types of action potentials, high-frequency simple spikes (SSs) and low-frequency complex spikes (CSs). While there is consensus that SSs convey information needed to optimize movement kinematics, the function of CSs, determined by the PC's climbing fiber input, remains controversial. While initially thought to be specialized in reporting information on motor error for the subsequent amendment of behavior, CSs seem to contribute to other aspects of motor behavior as well. When faced with the bewildering diversity of findings and views unraveled by highly specific tasks, one may wonder if there is just one true function with all the other attributions wrong? Or is the diversity of findings a reflection of distinct pools of PCs, each processing specific streams of information conveyed by climbing fibers? With these questions in mind, we recorded CSs from the monkey oculomotor vermis deploying a repetitive saccade task that entailed sizable motor errors as well as small amplitude saccades, correcting them. We demonstrate that, in addition to carrying error-related information, CSs carry information on the metrics of both primary and small corrective saccades in a time-specific manner, with changes in CS firing probability coupled with changes in CS duration. Furthermore, we also found CS activity that seemed to predict the upcoming events. Hence PCs receive a multiplexed climbing fiber input that merges complementary streams of information on the behavior, separable by the recipient PC because they are staggered in time.


Conflict of interest statement

The authors have declared that no competing interests exist.

Figures
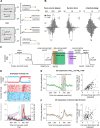
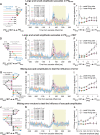
Fig 1
Fig 1. The influence of repetitive saccade paradigm on saccade behavior and encoding of primary saccade direction by CSs.
(A) Experimental paradigm showing 2 separate sessions in which the rewarded CF saccades were made either toward the right (top panel) or left (bottom panel). And, in turn, the resulting CP saccades were made in the opposite direction. As shown in the illustrations, within a session, both CF (solid arrows) and CP (dashed arrows) saccades could either over- or undershoot the target location resulting in leftward (yellow arrows) and rightward errors (green arrows), respectively. Therefore, while saccades made in the same direction caused errors in opposite directions, saccades in opposite directions, for example, overshooting CF saccade to the right and undershooting CP saccade to the left could lead to errors in the same direction (i.e., leftward errors). (B) Histograms comparing peak velocity (left), duration (middle), and amplitude (right) of early (dark gray) and late (light gray) 30 trials of CF and CP saccades, pooled across 160 sessions. Solid vertical lines represent the median values. Vertical scale bars represent the number of sessions. (C) An illustration showing the temporal order of different events relative to saccade behavior (solid black trace) within a trial and the temporal relationship of various analytical periods, i.e., “early postsaccadic period” (brown shaded region; 0–100 ms from primary saccade offset), “late postsaccadic period” (green shaded region; 50–250 ms from primary saccade offset), and “postcorrective saccadic period” (purple shaded region; 0–100 ms from corrective saccade offset), relative to saccade behavior. Dashed lines indicate the position of the target dot at any given point in time. Note the overlap between the early and late postsaccadic period. (D) Response of an exemplary PC to left CF (blue) and right CP (red) saccades (upper panel). Raster plot (middle panel) of SSs (dots) and CSs (circles) and their corresponding mean (±SEM) firing rates (bottom panel) are shown in faded and bright colors, respectively. Note, how the probability of CS occurrence increases during the “early postsaccadic period” (gray shaded region, 0–100 ms from saccade end) for the rightward but not leftward saccades, suggesting that the PC’s preferred direction for primary saccades (PDps) pointed in the rightward direction. Also note, both CF and CP saccades were followed by errors in both directions (see variability in individual saccade trajectories). All data are aligned to saccade onset (dashed gray line). (E, F) CS population response (mean ± SEM; N = 151 PCs) in PC’s preferred (PDps) and antipreferred (PDps+180°) direction (regardless of left, right, CF, and CP) of primary saccades (E, left panel) reveals a strong difference during the “early postsaccadic period” (gray shaded region), as compared to CS responses for primary saccades made in the left and right direction (F, left panel), regardless of CF and CP saccades. Inverted black triangles in E and F (left panels) represent the average saccade offset. All data are aligned to saccade onset (dashed gray line). Panels to the right in E and F show scatter plots highlighting individual differences between the PDps and PDps+180° and left and right directions. Each dot represents the mean of CS firing rate calculated during the “early postsaccadic period” for each PC. Gray dashed lines are the unity lines. Underlying data available from the Dryad Digital Repository: [https://doi.org/10.5061/dryad.d51c5b03m]. CF, centrifugal; CP, centripetal; CS, complex spike; PC, Purkinje cell; SS, simple spike.
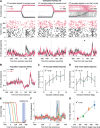
Fig 2
Fig 2. CSs encode primary saccade amplitude and duration but not peak velocity during the “early postsaccadic period”.
(A) CS population response (mean ± SEM) aligned to the onset of all primary saccades (PDps and PDps+180° combined) sorted by different amplitudes (left panel). The relationship between saccade amplitudes and peak firing rate of CSs is demonstrated with the help of a linear regression (right panel). (B) Population response (mean ± SEM) to saccades sorted by durations (left). The relationship between the timing of peak response (bootstrapped mean ± confidence intervals) and saccade duration is shown on the right. (C) Population response (mean ± SEM) to saccades with different velocities (left) and the corresponding regression plot (right). Green dotted lines represent the linear regression fits. The average saccade offset of each amplitude, duration, and peak velocity bin is denoted by inverted triangles in left panels. Note that the average onset of the upcoming corrective saccades occurred 349.2 ms after saccade onset. Underlying data available from the Dryad Digital Repository: [https://doi.org/10.5061/dryad.d51c5b03m]. CS, complex spike.
Fig 3
Fig 3. CSs encode corrective saccade direction, amplitude, and duration during the “postcorrective saccadic period”.
(A) CS response of an exemplary PC to corrective saccades in leftward (left panels) and rightward direction (right panels). As illustrated by the schematic diagram on the top, supported by averaged (± SEM) saccade trajectories underneath, an experimental session with left CF (red) and right CP (green) saccades resulted in leftward corrective saccades that were made to correct the leftward error arising from CP saccades that “overshot” the fixation dot, and CF saccades that “undershot” the target location (left panel). The start and end positions of these corrective saccades were naturally different. Similarly, rightward corrective saccades resulted from overshooting CF and undershooting CP saccades (right panel). As seen in raster plots (middle panels) and the mean (± SEM) firing response of all trials (bottom panel), the peak firing rate of CSs was much larger for rightward (right panel) as compared to leftward (left panel) corrective saccades during the “postcorrective saccadic period” of 0–100 ms from corrective saccade end (gray shaded region). For each PC, CS’s preferred direction for corrective saccades (PDcorr) was based on this period. Note that neither the different starting positions of corrective saccades nor the direction of preceding primary saccades influenced the CS firing. The average time of the preceding CF saccade offsets (= 272 ms) and the upcoming CP saccade onsets (= 362 ms), relative to corrective saccade onset, is marked by inverted black and gray triangles, respectively. (B) CS population response (mean ± SEM; N = 151 PCs) sorted by PC’s preferred (PDcorr) and antipreferred (PDcorr+180°) direction of corrective saccades based on “postcorrective saccadic period” (gray shaded region). Note that the CS activity during the “precorrective saccadic period” of approximately −200 to 0 ms from corrective saccade onset was used for determining the CS’s preferred direction of errors (PDerror). The average time of the preceding CF saccades offsets (= 305 ms) and the upcoming CP saccade onsets (= 331 ms), relative to corrective saccade onset, is marked by inverted black and gray triangles, respectively. (C) CS population response (mean ± SEM, PDcorr and PDcorr+180° combined) sorted by different amplitudes (left panel). The relationship between saccade amplitudes and peak firing rate of CSs is shown on the right. (D) CS response (mean ± SEM) to corrective saccades of different durations (left) and the corresponding relationship between the timing of peak response (bootstrapped mean ± confidence intervals) and saccade duration (right). Green dotted lines represent the linear regression fits. All data are aligned to corrective saccade onset. Underlying data available from the Dryad Digital Repository: [https://doi.org/10.5061/dryad.d51c5b03m]. CF, centrifugal; CP, centripetal; CS, complex spike; PC, Purkinje cell.
Fig 4
Fig 4. CSs encode the retinal error direction and magnitude during the “late postsaccadic period” in a manner different from primary and corrective saccades.
(A) CS population response (mean ± SEM) aligned to the offset of primary saccades made in the preferred and antipreferred direction of errors (PDerror, red; PDerror+180°, purple) and primary saccades (PDps, brown; PDps+180°, green). Note the differences between CS responses in PDps and PDps+180° are confined to the “early postsaccadic period” (gray shaded region). Note that the average onset of the upcoming corrective saccades was 305 ms relative to primary saccade offset. (B) Difference between the CS responses in PDerror and PDerror+180° (blue) and PDps and PDps+180° (orange). The influence of sorting CSs by PDerror can be seen as the separation of the curves during the “late postsaccadic period” of 50–250 ms from saccade offset (gray shaded region). (C) Left panel illustrates errors of different sizes (colored arrows) in PDerror and PDerror+180° resulting from saccades of different amplitudes (black arrows) made in both directions. Saccades resulting in comparable error vectors were combined (for example, see gray arrows) to test the influence of size and direction of errors on CS firing. Right panel highlights the relationship between different error sizes and mean CS firing (± SEM) during the “precorrective saccadic period. Note how the same error magnitude (see blue and gray) evokes a strong and a weak CS discharge depending on whether this error occurred in the preferred or antipreferred direction, respectively, thus showing a clear influence of error direction on CS firing. The inset demonstrates the same relationship when mean CS firing was calculated during the “late postsaccadic period” of 50–200 ms after saccade end. (D) Primary saccades of different amplitudes (colored arrows) in PDps and PDps+180° (left panel) and their corresponding influence on the peak firing rate (mean ± SEM) during the “early postsaccadic period” (right). (E) Corrective saccades of different amplitudes (colored arrows) in PDcorr and PDcorr+180° (left) and their corresponding influence on the peak firing rate (mean ± SEM) during the “early postcorrective saccadic period” (right). Dashed gray lines represent the linear regression fits. Underlying data available from the Dryad Digital Repository: [https://doi.org/10.5061/dryad.d51c5b03m]. CS, complex spike.
Fig 5
Fig 5. CS activity during the “early postsaccadic period” carries information on primary saccades and errors, whereas during the “late postsaccadic period, it is mostly error driven.
(A) Schematic diagram showing different amplitudes of primary saccades (colored arrows) made toward PDerror resulting from the sorting of errors (black arrows) occurring in PDerror and PDerror+180° into bins of different magnitudes. Note how large and small amplitude saccades in PDerror were followed by errors in the opposite directions. Errors occurred in PDerror+180° for large amplitude saccades, and for smaller amplitudes, they occurred in PDerror. (B) CS population responses (mean ± SEM) to different amplitudes of primary saccades shown in A. Note how the peak firing of the population response (triangles) is observed much earlier toward the end of saccades. (C) Influence of different error sizes in PDerror and PDerror+180° on peak CS firing (colored triangles, mean ± SEM) and mean CS firing (colored circles, mean ± SEM) calculated during the “late postsaccadic period” (yellow shaded region in B, E, H, and K). While the peak firing rate is meant to capture the saccade-related response, the mean firing rate tries to register error-related activity. (D) Schematic diagram showing different amplitudes of primary saccades (colored arrows) made toward PDerror+180° and their respective errors (black arrows). (E, F) Same as B and C, respectively. (G) Schematic diagram showing primary saccades of different amplitudes (black arrows) pointing in PDerror and PDerror+180° that resulted in different error sizes in both directions (colored arrows). Saccades with different amplitudes and pointing in opposite directions, albeit with the same error vectors (for example, see blue arrows), were combined to test the influence of errors on CS firing. (H) CS population response (mean ± SEM) to comparable amplitudes of primary saccades achieved by mixing saccades of different amplitudes as shown in G. (I) Same as in C. Note, however, the increase in CS peak firing rate despite comparable amplitudes of primary saccades indicating the influence of errors also in the “early postsaccadic period. (J) Schematic diagram illustrating different amplitudes of primary saccades (colored arrows) in PDerror and PDerror+180° and their corresponding errors (black arrows). To exclusively test the influence of saccade amplitudes, similarly sized saccades with errors in opposite directions (see gray arrows for instance) were combined, hence canceling the influence of errors. (K) CS population response (mean ± SEM) to primary saccades sorted by amplitudes, with mixed error directions. (L) Same as in C. Note how mixing the error directions led to the disappearance of differences between the CS population responses in the later error-related period. Also note that only the CS peak firing rates increased with saccade amplitudes but not the mean firing rate, suggesting the influence of saccade amplitudes in the “early postsaccadic period. All data in B, E, H, and K are aligned to primary saccade offset (vertical dashed line). Dashed gray lines in C, F, I, and L represent fits based on linear regressions. Underlying data available from the Dryad Digital Repository: [https://doi.org/10.5061/dryad.d51c5b03m]. CS, complex spike.
Fig 6
Fig 6. Changes in CS duration encode changes in primary and corrective saccades as well as errors.
(A) Histogram showing a bimodal distribution of CS durations in an exemplary PC. For illustration purposes, we separated the distribution into long and short duration CSs by eye (vertical dashed line). Solid vertical lines represent the median value of short (blue) and long (dark yellow) duration CSs. (B) Averaged (± SEM) waveforms of long and short duration CSs. (C) Population response (mean ± SEM) showing percentage change in CS duration aligned to primary saccade onset, for large (dark yellow) and small (blue) amplitude saccades. The population response was obtained from running averages of percentage change in CS duration, computed for every 50 ms bins, relative to the mean CS duration of each PC. (D) Percentage change in CS duration during the 100–200 ms period from primary saccade onset (gray shaded region in C) relative to saccade amplitudes in PDps and PDps+180°. (E) Percentage change in CS duration for primary saccades made in PDerror and PDerror+180°. Data aligned to primary saccade end. (F) Percentage change in CS duration relative to error magnitudes in PDerror and PDerror+180° during the 50–250 ms period from saccade offset. (G, H) Same as C and D, except for corrective saccade. (I) Percentage change in CS duration for corrective saccades in PDerror and PDerror+180°. (J) Percentage change in CS duration relative to error magnitudes in PDerror and PDerror+180° during the −250–0 ms period from corrective saccade onset. Data in G and I aligned to corrective saccade onset. Error bars and dashed gray lines in D, F, H, and J represent the SEM and fits based on linear regression, respectively. Significant differences between CS responses in C, E, G, and I are indicated by asterisks. Underlying data available from the Dryad Digital Repository: [https://doi.org/10.5061/dryad.d51c5b03m]. CS, complex spike; PC, Purkinje cell.
Fig 7
Fig 7. A trial onset–related CS discharge seems to predict the upcoming events.
(A) CS response of an exemplary PC neuron tested in both, left and right, CF (left column) and CP (middle column) directions. Data are aligned to saccade onset. CP saccades and the CS responses aligned to the onset of the next trial are shown in the rightmost column. Despite the variability of saccades, note how precisely CS are accumulated around 200 ms from trial onset. Upper row: Individual saccades are shown as thin lines. Thick lines represent average saccade trajectories. Middle row: raster plot of CSs. Lower row: mean (± SEM) CS response for each condition. The average onset of all CP saccades (= 111 ms) relative to trial onset is marked by the inverted black triangle. Note that the average onset of the upcoming CF saccades occurred after 669 ms from trial onset. (B) Trial onset evoked CS response (mean ± SEM) of all PCs (N = 27) tested for saccades in both directions. Red and black traces correspond to the left and right position of the trial onset related fixation dot relative to the eye position at the end of the previous CF saccade, respectively. The inverted black triangle denotes the average CP saccade onset relative to the trial onset. (C) Change in peak firing rate of CS population response (N = 151, mean ± SEM), aligned to CP saccade onset, relative to changes in CP saccade amplitudes (mean ± SEM). (D) Change in peak firing rate of CS population response (N = 151, mean ± SEM), aligned to next trial’s onset, relative to changes in CP saccade amplitude (mean ± SEM). Note how the same CSs lose information on saccade amplitudes when aligned to trial onset. (E–G) CP saccades (average trajectories) sorted by their time of arrival at the fixation dot, relative to the time of target jump and corresponding changes in peak firing rate of the CS population response (mean ± SEM). Mean ± SD of target jump times is represented by the blue vertical dotted line and shaded region in blue, respectively. Error bars represent ± SEM around the mean. Dotted green line represents the linear regression fit. Underlying data available from the Dryad Digital Repository: [https://doi.org/10.5061/dryad.d51c5b03m]. CF, centrifugal; CP, centripetal; CS, complex spike; PC, Purkinje cell.
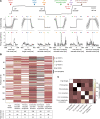
Fig 8
Fig 8. Encoding of different task parameters by individual PCs.
(A) The upper panel illustrates different events (indicated by inverted triangles of different colors) in their temporal order within a trial, relative to the saccade behavior (solid black trace). Middle and bottom panels show the averaged horizontal eye position traces and the averaged CS response of an exemplary PC aligned to each of the events (colored vertical dashed lines) shown in the upper panel. The relative timing of the preceding and upcoming events is also shown as inverted colored triangles. (B) The number of rows in the figure corresponds to the ID of the PC tested, and each column corresponds to the type of parameter/event encoded. Different colors represent the range of p-values obtained from comparisons of different values of each parameter (see Materials and methods for more details). Cells that fired less than 10 CSs during the period of interest were not compared (shown as dark gray colored boxes). A summary of the total number of PCs encoding each type of information is provided in the table below. (C) A cross-correlation matrix summarizing the relationship between the encoding of different parameters encoded by PCs. The strength of the relationship between each comparison is determined by the value of correlation coefficients, which is represented by the color of each pixel. Note that we found only a moderate correlation (cross-correlation coefficient = 0.46) between corrective saccade direction and error magnitude and direction. In all other cases, we did not observe any meaningful relationships between parameters encoded by the individual PCs (cross-correlation coefficient < 0.2). Underlying data available from the Dryad Digital Repository: [https://doi.org/10.5061/dryad.d51c5b03m]. CF, centrifugal; CS, complex spike; nc, not compared; ns, nonsignificant; PC, Purkinje cell; PS, primary saccade; s, significant.

Similar articles

Cited by

References

    1. Albus JS. A theory of cerebellar function. Math Biosci. 1971;10(1–2):25–61.
    1. Ito M. Neural design of the cerebellar motor control system. Brain Res. 1972;40(1):81–4. doi: 10.1016/0006-8993(72)90110-2 - DOI - PubMed
    1. Marr D. A theory of cerebellar cortex. J Physiol 1969;202(2):437–70. doi: 10.1113/jphysiol.1969.sp008820 . - DOI - PMC - PubMed
    1. Barmack NH, Shojaku H. Vestibular and visual climbing fiber signals evoked in the uvula-nodulus of the rabbit cerebellum by natural stimulation. J Neurophysiol. 1995;74(6):2573–89. doi: 10.1152/jn.1995.74.6.2573 - DOI - PubMed
    1. Gilbert P, Thach W. Purkinje cell activity during motor learning. Brain Res. 1977;128(2):309–28. doi: 10.1016/0006-8993(77)90997-0 - DOI - PubMed

Publication types