. 2021 Sep 16;16(9):e0256664.
doi: 10.1371/journal.pone.0256664. eCollection 2021.

A high-frequency single nucleotide polymorphism in the MtrB sensor kinase in clinical strains of Mycobacterium tuberculosis alters its biochemical and physiological properties

Affiliations

A high-frequency single nucleotide polymorphism in the MtrB sensor kinase in clinical strains of Mycobacterium tuberculosis alters its biochemical and physiological properties

Uchenna Watson Waturuocha et al. PLoS One. .

Abstract

The DNA polymorphisms found in clinical strains of Mycobacterium tuberculosis drive altered physiology, virulence, and pathogenesis in them. Although the lineages of these clinical strains can be traced back to common ancestor/s, there exists a plethora of difference between them, compared to those that have evolved in the laboratory. We identify a mutation present in ~80% of clinical strains, which maps in the HATPase domain of the sensor kinase MtrB and alters kinase and phosphatase activities, and affects its physiological role. The changes conferred by the mutation were probed by in-vitro biochemical assays which revealed changes in signaling properties of the sensor kinase. These changes also affect bacterial cell division rates, size and membrane properties. The study highlights the impact of DNA polymorphisms on the pathophysiology of clinical strains and provides insights into underlying mechanisms that drive signal transduction in pathogenic bacteria.


Conflict of interest statement

The authors have declared that no competing interests exist.

Figures

Fig 1
Fig 1. Sequence analysis to identify the SNP in MtrB sensor kinase.
A. Total SNPs found in the DNA sequence of the mtrAB TCS in the 2501 strains of M. tuberculosis (sequences available in GMTV database). B. A list of nonsynonymous SNPs found in the MtrB protein with the codon changes and their percentage frequencies. C. Sequence alignment of the protein showing the histidine kinase and HATPase domain of the sensor kinase protein MtrB, using H37Rv as the reference strain. The alignment of sequence from H37Rv and one representative strain from GMTV carrying the mutation is shown. SHELR box in the kinase domain is marked in bold and shaded grey with the mutation from Methionine to Leucine at the 517th residue marked in bold; CS1 is the number assigned to the representative clinical strain used for alignment. D. Pfam based predicted structure of the sensor kinase protein MtrB, highlighting three distinct domains: the HAMP domain, the Histidine Kinase (HK) domain, and the HATPase domain. The mutation at the 517th position, which lies in the HATPase domain, is marked by the black arrow.
Fig 2
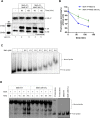
Fig 2. Assessment of the autophosphorylation and autokinase activity of the sensor kinase MtrB carrying M517L mutation.
A. Autophosphorylation time-course analysis for the mutated and wild-type MtrB SK protein. M, Marker. B. Quantitative measurement of phosphorylation of the WT and mutant MtrB proteins at various time points (as shown in Fig 2A). The signal recorded for both proteins at the first time point was taken as 1 and the later time points were normalized to it (n = 3). C. Phosphotransfer time course to analyze the effect of the mutation on the phosphotransfer efficiency to the RR MtrA. The mutated or the wild-type MtrB protein were incubated with the RR MtrA (after autophosphorylation) in the phosphotransfer assay. M, marker. D and E. Quantitation of phosphorylated SK MtrB~P and RR MtrA~P protein at various time points (generated through wild type or and mutant MtrB as shown in Fig 2C). The signal recorded by the phosphotransfer of the SK at the first time point was taken as 100%, and the subsequent time points were normalized to it (n = 3) (p values; *≤ 0.05, **≤ 0.01).
Fig 3
Fig 3. Effect of the mutation on the phosphatase activity of the SK on RR~P and its DNA binding ability.
A. Dephosphorylation analysis of MtrA~P through wild type or mutant MrB. MtrA~P was generated as described in the Methods section and incubated with the wild type or mutant MtrB for the indicated time points. M, marker. B. Quantitative measurement of the amount of MtrA~P remaining at the indicated time points is shown in Fig 3A. The signal recorded with MtrA~P in the absence of SK was taken as 100, and the other time points were normalized to it to calculate the percentage of phosphorylated RR (n = 3). C. Titration of MtrA RR protein concentration to determine the minimal concentration of unphosphorylated MtrA which can bind to the oriC. Labeled DNA were incubated with increasing concentration of MtrA protein (as indicated) and tested for mobility shift of the probe by EMSA. The RR KdpE was used as a negative control to evaluate nonspecific binding (lane 2). D. A comparative analysis of MtrA binding to oriC DNA as a function of phosphorylation through wild-type or mutant MtrB’ SK proteins used at different concentrations. For all experiments, n = 3 biological replicates and a representative image is shown.
Fig 4
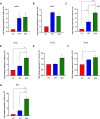
Fig 4. Assessment of the impact of MtrB mutation on downstream gene expression in M. tuberculosis H37Ra.
A-G. Relative expression of mRNA levels in H37Ra strains over-expressing the wild-type or mutant mtrB cloned in the pMV261 vector and grown in Middlebrook 7H9 medium. The expression of the specific genes was normalized to the levels of 16S rRNA before calculating the fold change between test and vector control samples. The expression changes are shown for the A. mtrB; B. mtrA; C. ilvE; D. ftsQ; E. murG; F. ftsW; G. ftsZ. For all experiments, n = 3 biologically independent experiments. (p values; *≤ 0.05, **≤ 0.01, ***≤ 0.001, ****≤ 0.0001).
Fig 5
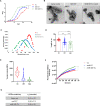
Fig 5. Analysis of growth rates and cell size of strains overexpressing wild-type or mutant MtrB.
A. Growth curves of H37Ra strains overexpressing mtrB WT, mtrB’ (M517L) or the vector alone in 7H9 medium (containing 10% OADC, 0.5% glucose, 0.05% Tween80) (n = 3). B. Transmission electron microscopy analysis (TEM) of recombinant H37Ra strains. Representative micrographs of various strains as indicated. C. Normalized distribution of the bacterial cell length of various strains based on the EM images shown in Fig 5B. D. Average cell length of various strains calculated from EM images shown in Fig 5B. E. Representative topographical images of various strains (as indicated) by atomic force microscopy (AFM). The upper panel of images represent the peak force error maps for each sample and the lower panel of images show the height of each sample. F. Graph showing the nonlinear regression fit of the fluorescence curve obtained for the three strains vector control, mtrB WT and mtrB’ M517L at an excitation-emission of 530–590 obtained after incubation with EtBr (statistical analysis performed only for the last time point of 60min). G. Membrane permeability calculated by the accumulation of EtBr over 60 minutes and represented as t1/2 in seconds at a concentration of 0.5 μM of EtBr. The slopes of fluorescence emission curve obtained in Fig 5G were used to determine the t1/2 value for membrane permeability. For all experiments, n = 3. (P values; *P ≤ 0.05, **P ≤ 0.01, ***P ≤ 0.001, ****P ≤ 0.0001).
Fig 6
Fig 6. A schematic describing the downstream changes caused by the SNP in the MtrB SK via its altered signalling.

References

    1. Ramaswamy S, Musser JM. Molecular genetic basis of antimicrobial agent resistance in Mycobacterium tuberculosis: 1998 update. Tuber Lung Dis. 1998;79: 3–29. doi: 10.1054/tuld.1998.0002 - DOI - PubMed
    1. Braden CR, Morlock GP, Woodley CL, Johnson KR, Colombel AC, Cave MD, et al.. Simultaneous Infection with Multiple Strains of Mycobacterium tuberculosis. Clin Infect Dis. 2001;33: e42–e47. doi: 10.1086/322635 - DOI - PubMed
    1. Manca C, Tsenova L, Iii CEB, Freeman S, Haslett PAJ, James M, et al.. Mycobacterium tuberculosis CDC1551 Induces a More Vigorous Host Response In Vivo and In Vitro, But Is Not More Virulent Than Other Clinical Isolates. J Immunol. 1999;162: 6740–6746. - PubMed
    1. Gagneux S, DeRiemer K, Van T, Kato-Maeda M, De Jong BC, Narayanan S, et al.. Variable host-pathogen compatibility in Mycobacterium tuberculosis. Proc Natl Acad Sci U S A. 2006;103: 2869–2873. doi: 10.1073/pnas.0511240103 - DOI - PMC - PubMed
    1. Sarkar R, Lenders L, Wilkinson KA, Wilkinson RJ, Nicol MP. Modern lineages of Mycobacterium tuberculosis exhibit lineage-specific patterns of growth and cytokine induction in human monocyte-derived macrophages. PLoS One. 2012;7: 6–13. doi: 10.1371/journal.pone.0043170 - DOI - PMC - PubMed

Publication types

MeSH terms