

A comprehensive integrated post-GWAS analysis of Type 1 diabetes reveals enhancer-based immune dysregulation
- PMID: 34529725
- PMCID: PMC8445446
- DOI: 10.1371/journal.pone.0257265
A comprehensive integrated post-GWAS analysis of Type 1 diabetes reveals enhancer-based immune dysregulation
Abstract
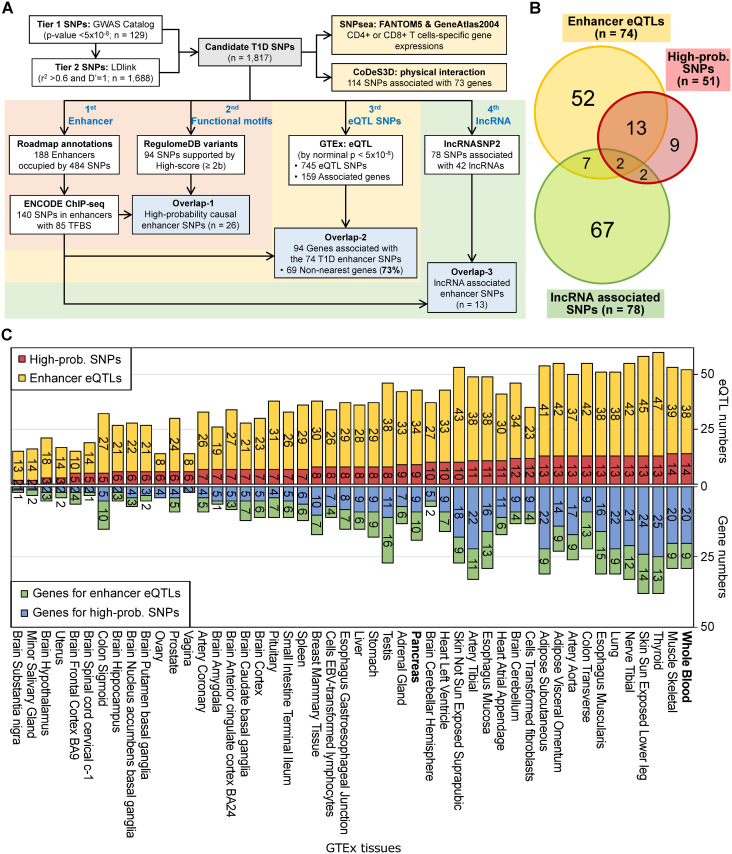
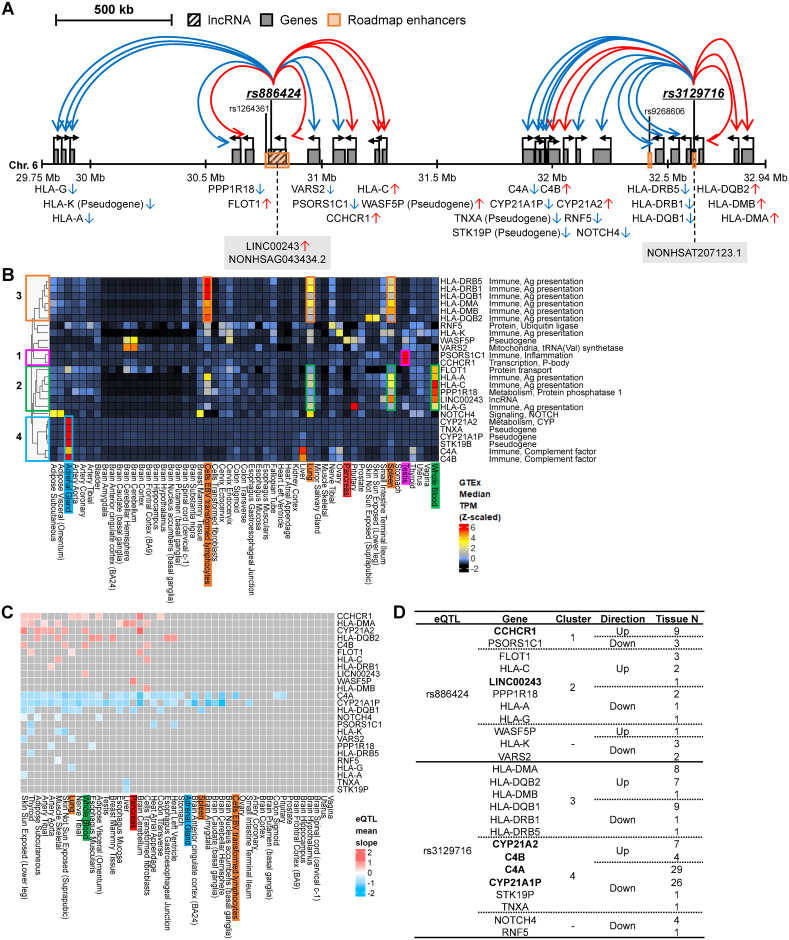
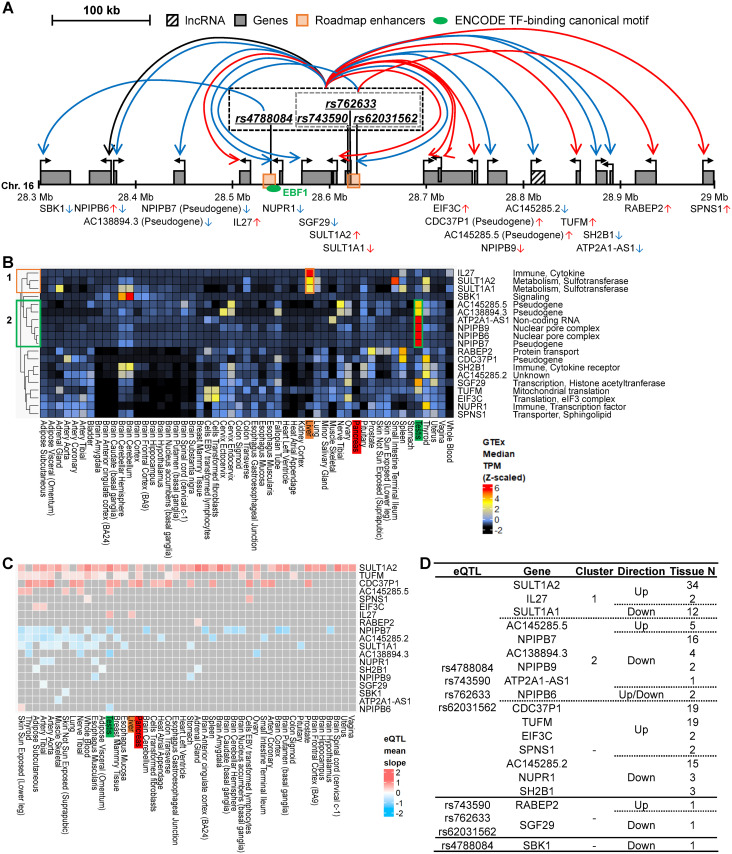
Type 1 diabetes (T1D) is an organ-specific autoimmune disease, whereby immune cell-mediated killing leads to loss of the insulin-producing β cells in the pancreas. Genome-wide association studies (GWAS) have identified over 200 genetic variants associated with risk for T1D. The majority of the GWAS risk variants reside in the non-coding regions of the genome, suggesting that gene regulatory changes substantially contribute to T1D. However, identification of causal regulatory variants associated with T1D risk and their affected genes is challenging due to incomplete knowledge of non-coding regulatory elements and the cellular states and processes in which they function. Here, we performed a comprehensive integrated post-GWAS analysis of T1D to identify functional regulatory variants in enhancers and their cognate target genes. Starting with 1,817 candidate T1D SNPs defined from the GWAS catalog and LDlink databases, we conducted functional annotation analysis using genomic data from various public databases. These include 1) Roadmap Epigenomics, ENCODE, and RegulomeDB for epigenome data; 2) GTEx for tissue-specific gene expression and expression quantitative trait loci data; and 3) lncRNASNP2 for long non-coding RNA data. Our results indicated a prevalent enhancer-based immune dysregulation in T1D pathogenesis. We identified 26 high-probability causal enhancer SNPs associated with T1D, and 64 predicted target genes. The majority of the target genes play major roles in antigen presentation and immune response and are regulated through complex transcriptional regulatory circuits, including those in HLA (6p21) and non-HLA (16p11.2) loci. These candidate causal enhancer SNPs are supported by strong evidence and warrant functional follow-up studies.
Conflict of interest statement
The authors have declared that no competing interests exist.
Figures
Similar articles
-
Identification of functional enhancer variants associated with type I diabetes in CD4+ T cells.Front Immunol. 2024 Jun 14;15:1387253. doi: 10.3389/fimmu.2024.1387253. eCollection 2024. Front Immunol. 2024. PMID: 38947339 Free PMC article.
-
Disease-specific biases in alternative splicing and tissue-specific dysregulation revealed by multitissue profiling of lymphocyte gene expression in type 1 diabetes.Genome Res. 2017 Nov;27(11):1807-1815. doi: 10.1101/gr.217984.116. Epub 2017 Oct 12. Genome Res. 2017. PMID: 29025893 Free PMC article.
-
Risk variants disrupting enhancers of TH1 and TREG cells in type 1 diabetes.Proc Natl Acad Sci U S A. 2019 Apr 9;116(15):7581-7590. doi: 10.1073/pnas.1815336116. Epub 2019 Mar 25. Proc Natl Acad Sci U S A. 2019. PMID: 30910956 Free PMC article. Clinical Trial.
-
The genetic architecture of type 1 diabetes mellitus.Mol Cell Endocrinol. 2018 Dec 5;477:70-80. doi: 10.1016/j.mce.2018.06.002. Epub 2018 Jun 18. Mol Cell Endocrinol. 2018. PMID: 29913182 Review.
-
Exploring the Triple Interaction between the Host Genome, the Epigenome, and the Gut Microbiome in Type 1 Diabetes.Int J Mol Sci. 2020 Dec 24;22(1):125. doi: 10.3390/ijms22010125. Int J Mol Sci. 2020. PMID: 33374418 Free PMC article. Review.
Cited by
-
Modulation of autoimmune diabetes by N-ethyl-N-nitrosourea- induced mutations in non-obese diabetic mice.Dis Model Mech. 2022 Jun 1;15(6):dmm049484. doi: 10.1242/dmm.049484. Epub 2022 Jun 1. Dis Model Mech. 2022. PMID: 35502705 Free PMC article.
-
How do immune cells shape type 1 diabetes? Insights from Mendelian randomization.Front Endocrinol (Lausanne). 2024 Dec 24;15:1402956. doi: 10.3389/fendo.2024.1402956. eCollection 2024. Front Endocrinol (Lausanne). 2024. PMID: 39777226 Free PMC article.
-
Teplizumab in Type 1 Diabetes Mellitus: An Updated Review.touchREV Endocrinol. 2023 Nov;19(2):22-30. doi: 10.17925/EE.2023.19.2.7. Epub 2023 Oct 6. touchREV Endocrinol. 2023. PMID: 38187075 Free PMC article. Review.
-
Nature vs. nurture: FOXP3, genetics, and tissue environment shape Treg function.Front Immunol. 2022 Aug 12;13:911151. doi: 10.3389/fimmu.2022.911151. eCollection 2022. Front Immunol. 2022. PMID: 36032083 Free PMC article. Review.
-
Teplizumab's immunomodulatory effects on pancreatic β-cell function in type 1 diabetes mellitus.Clin Diabetes Endocrinol. 2024 Aug 10;10(1):23. doi: 10.1186/s40842-024-00181-w. Clin Diabetes Endocrinol. 2024. PMID: 39123252 Free PMC article. Review.
References
-
- Insel RA, Dunne JL, Atkinson MA, Chiang JL, Dabelea D, Gottlieb PA, et al.. Staging presymptomatic type 1 diabetes: a scientific statement of JDRF, the Endocrine Society, and the American Diabetes Association. Diabetes Care. 2015/09/26. 2015;38: 1964–1974. doi: 10.2337/dc15-1419 - DOI - PMC - PubMed
Publication types
MeSH terms
Substances
Grants and funding
LinkOut - more resources
Full Text Sources
Medical
Research Materials
