. 2021 Nov 1;218(11):e20210862.
doi: 10.1084/jem.20210862. Epub 2021 Sep 16.

Intercrypt sentinel macrophages tune antibacterial NF-κB responses in gut epithelial cells via TNF

Affiliations

Intercrypt sentinel macrophages tune antibacterial NF-κB responses in gut epithelial cells via TNF

Annika Hausmann et al. J Exp Med. .

Abstract

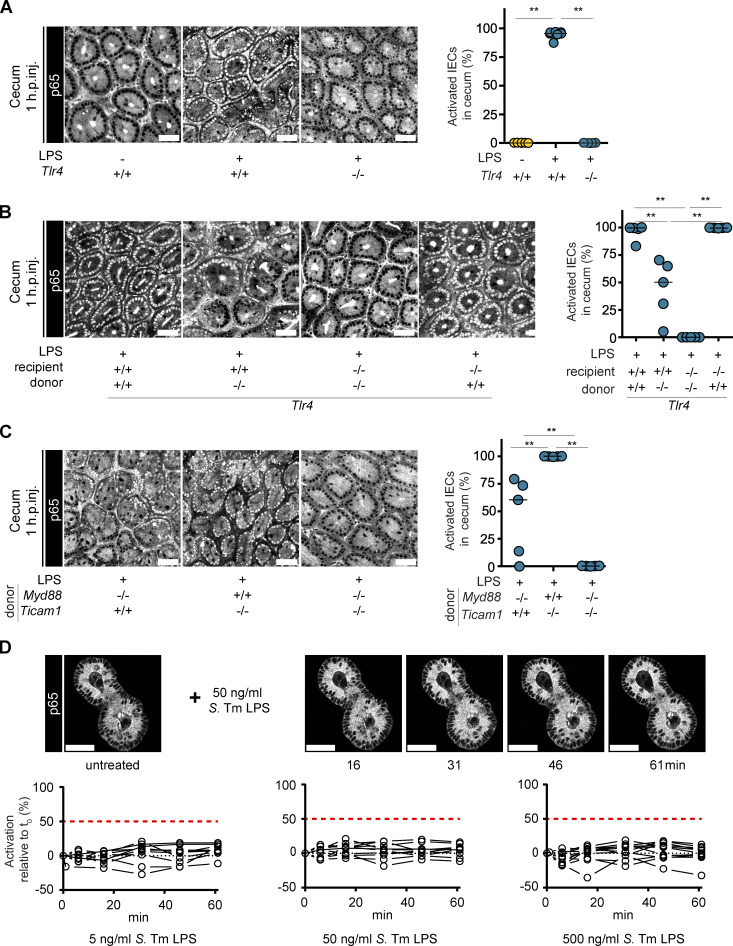
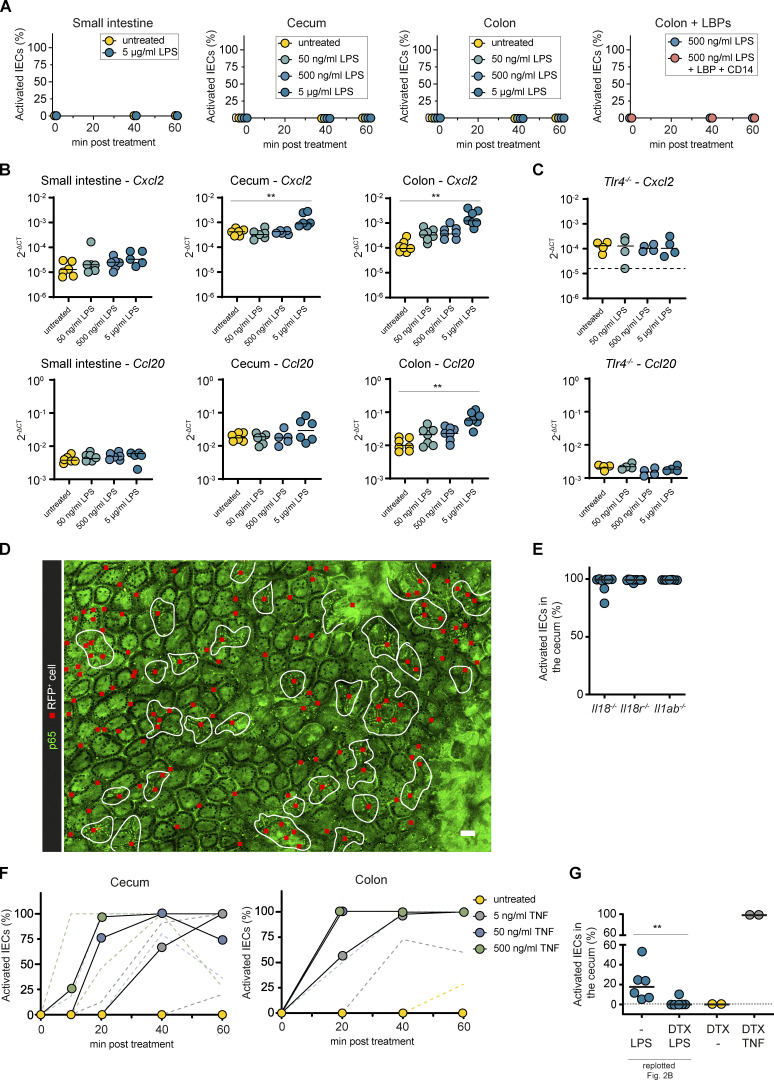
Intestinal epithelial cell (IEC) NF-κB signaling regulates the balance between mucosal homeostasis and inflammation. It is not fully understood which signals tune this balance and how bacterial exposure elicits the process. Pure LPS induces epithelial NF-κB activation in vivo. However, we found that in mice, IECs do not respond directly to LPS. Instead, tissue-resident lamina propria intercrypt macrophages sense LPS via TLR4 and rapidly secrete TNF to elicit epithelial NF-κB signaling in their immediate neighborhood. This response pattern is relevant also during oral enteropathogen infection. The macrophage-TNF-IEC axis avoids responses to luminal microbiota LPS but enables crypt- or tissue-scale epithelial NF-κB responses in proportion to the microbial threat. Thereby, intercrypt macrophages fulfill important sentinel functions as first responders to Gram-negative microbes breaching the epithelial barrier. The tunability of this crypt response allows the induction of defense mechanisms at an appropriate scale according to the localization and intensity of microbial triggers.


Conflict of interest statement

Disclosures: The authors declare no competing interests exist.

Figures

None
Graphical abstract
Figure 1.
Figure 1.
TLR4+ immune cells induce epithelial NF-κB signaling in the cecal mucosa upon LPS exposure. Mice were i.v. injected with LPS. Cecal explants were imaged at 1 h.p.inj. by two-photon microscopy. (A–C) Representative images and quantification of epithelial NF-κB activation in the indicated mice (A, n = 4–7) or BMCs (B, n = 5; C, n = 5). Each circle represents one mouse. Black line: median. **, P ≤ 0.01 by Mann–Whitney U test. (D) Small intestinal organoids were treated with 5, 50, or 500 ng/ml LPS and imaged for ∼1 h. Representative images of one organoid over time (top) and quantification of NF-κB activation (bottom; relative change). Each circle represents one organoid at the given time (minutes after start of the treatment, n = 7). Lines connect data points from the same organoid. Red dashed line: 50% activation threshold. Black dotted line: no change. Scale bars: 50 µm. Combined data of two (C and D), three (A), or four (B) independent experiments.
Figure S1.
Figure S1.
TLR4+ immune cells induce epithelial NF-κB activation in the small intestine and colon. (A) Schematic drawing of the two-photon imaging (left). The intestinal mucosa is imaged from the luminal side (black arrowhead), resulting in images in horizontal plane of the mucosa (right; part of the image shown in Fig. 1 A). White dashed line/E, epithelium; L, lumen; white asterisks, epithelial nuclei. (B) Fold changes in expression of A20, Cxcl2, and Tnf in the cecal mucosa of mice depicted in Fig. 1 A (n = 5). (C) Fold changes in expression of A20, Cxcl2, and Tnf in the cecal mucosa of mice depicted in Fig. 1 B in comparison to PBS-injected mice in Fig. 1 A (n = 5). (D and E) Two-photon microscopy images and quantification of epithelial NF-κB activation in the (D; n = 3–5) small intestine and (E; n = 3–5) colon of LPS-injected BMCs, and (F) in small intestine and colon of Myd88−/− > p65GFP-FLxTlr4−/−, Ticam1−/− > p65GFP-FLxTlr4−/− BMCs. Each circle represents one mouse. Black line: median. Statistical analysis: Mann–Whitney U test. *, P ≤ 0.05; **, ≤ 0.01. Scale bars: 50 µm. Combined data of three (B), four (C), five (D), six (E), or seven (F) independent experiments. Each circle represents one mouse. Black line: median. Scale bars: 50 µm.
Figure S2.
Figure S2.
TNF produced by CD11c+ cells induces local epithelial NF-κB activation in the intestinal mucosa. (A and B) p65GFP-FL intestinal epithelial organoids established from the indicated regions were treated with 5, 50, and 500 ng/ml or 5 µg/ml LPS (+ LBP and CD14, if indicated) and imaged for 1 h (A; n = 3–17), or analyzed by qPCR at 3 h of treatment (B and C; n = 6 or 7). (C) Colon organoids from p65GFP-FLxTlr4−/− mice (n = 4). (D) Representative two-photon microscopy overview image of the cecal mucosa of mice described in Fig. 2 A at 1 h.p.inj. of LPS (n = 6). Red squares indicate RFP+ (Tlr4+/+) cells. White lines indicate IEC NF-κB activation zones (defined as areas with continuous epithelial NF-κB activation). (E) Quantification of epithelial NF-κB activation in Il18−/− > p65GFP-FLxTlr4−/−, Il18r−/− > p65GFP-FLxTlr4−/−, and Il1ab−/− > p65GFP-FLxTlr4−/− BMCs at 1 h.p.inj. of LPS (n = 7 or 8). (F) p65GFP-FL intestinal epithelial organoids from cecum (left) or colon (right) were treated with 5, 50, and 500 ng/ml TNF and imaged for 1 h (n = 3–17). (G) Quantification of epithelial NF-κB activation in mice as described in Fig. 2 B. Mice pretreated with DTX were injected with PBS or TNF (n = 2–6). Cecae were imaged at 1 h.p.inj. Data of LPS-injected mice are replotted from Fig. 2 B for comparison. Black line: median (B, C, E, and G). Dashed line: detection limit (C and G) or error range (A and F). Each circle represents one organoid sample (B and C), one mouse (E and G), or the median (A and F). Statistical analysis: one-way ANOVA with Dunett’s correction (B and C) or Mann–Whitney U test (E and G). *, P ≤ 0.05; **, P ≤ 0.01. Scale bars: 50 µm. Combined data of two (A, small intestine; B, C, D, and F, cecum), three (A, cecum), four (F, colon), six (B and E), or eight (A, colon) independent experiments.
Figure 2.
Figure 2.
CD11c+ cells induce local epithelial NF-κB activation via TNF. Mice were i.v. injected with LPS and cecal explants imaged at 1 h.p.inj. by two-photon microscopy (representative image and quantification) if not indicated otherwise. (A) Cecum mucosa from p65GFP-FLxTlr4−/− mice reconstituted with a 1:10 mix of ActRFP (10%, Tlr4+/+) and p65GFP-FLxTlr4−/− (90%) BM. Analysis of RFP+ cells within an epithelial NF-κB activation zone (see Fig. S2 D, n = 10–18). (BD) Cecal epithelium NF-κB activation of the indicated BMCs or p65GFP-FL mice pretreated with isotype control/anti-TNF antibody or i.v. injected with TNF and analyzed at the indicated time points (n = 5 or 6). (E) TNF-treated small-intestinal epithelial organoids. Representative image and quantification of NF-κB activation kinetics with 5, 50, or 500 ng/ml TNF (n = 9–17). Lines connect data points from the same organoid. Red dashed line: 50% activation threshold. Black dotted line: no change. (F) Representative images of the cecal epithelium and quantification of epithelial NF-κB activation of p65GFP-FLxTlr4−/− mice reconstituted with a 1:20 mix of CD11c-DTR and TNFa−/− BM, pretreated with DTX (n = 5–8). (B–D and F) Black line: median. *, P ≤ 0.05; **, P ≤ 0.01 by Mann–Whitney U test. Each circle represents one mouse or one organoid (E). Combined data of two (A and B), three (D and E), four (F), or six (C) independent experiments. Scale bars: 50 µm.
Figure 3.
Figure 3.
LPS exposure induces a rapid response in LP cells, followed by secondary epithelial NF-κB activation. (A–D) Confocal microscopy images of fixed cecae of p65GFP-FL mice (A–C) or WT mice (D) i.v. injected with (A) PBS or (B–D) LPS and analyzed as indicated. Boxes in overview images indicate insets. Arrowheads indicate p65+ nuclei (A–C) or MHCII+ cells (D). Arrows indicate p65 nuclei (A–C) or IECs (D). Scale bars: 30 µm (overview images A–C), 20 µm (overview image D), or 10 µm (insets A–C). Representative images of mice from three independent experiments (n = 4–7).
Figure S3.
Figure S3.
Receptor expression in IECs. (A–D) Confocal microscopy images of (A) the cecal patch, and (B) a mucosa-associated lymphoid follicle in fixed cecae of p65GFP-FL mice i.v. injected with LPS at 1 h.p.inj. Boxes in overview images indicate insets. Arrowheads indicate p65+ nuclei. Arrows indicate p65 nuclei. Scale bars: 50 µm (overview images) or 10 µm (insets). TLR4 staining in small intestine (C) and colon (D) of WT mice. Arrowheads indicate MHCII+ cells. Arrows indicate IECs. Scale bars: 20 µm. Representative images of mice from two experiments. (E) Heat map depicting expression levels of Tlr2, Tlr4, Tlr6, Tlr11, Tnfrsf1a (TNFR1), and Tnfrsf1b (TNFR2) in untreated or TNF-treated (5 ng/ml, 8 h) small intestinal epithelial organoids derived from SPF (SPF1, SPF2) or germ-free (GF) mice, m-ICc12 cells, and mouse embryonic fibroblasts (MEFs; reanalysis of a previously published transcriptome dataset, all detectable Tlrs depicted; Hausmann et al., 2020b). (F) Cecal mucosa stained for TNFR1 at 1 h.p.inj. of LPS. Scale bars: 50 µm. Representative images of mice from three independent experiments (n = 4–7).
Figure 4.
Figure 4.
Tissue resident, monocyte-derived macrophages secrete TNF to induce local epithelial NF-κB activation. (A) ELISA measurements of TNF concentrations in the cecal mucosa of LPS injected WT mice (n = 5 or 6). Dashed line: detection limit. y axis in log10 scale. (B) Percentage of TNF+ DCs or macrophages (gating as shown in Fig. S4 D) in the cecum, small intestine, and colon of LPS-treated WT mice (1 h.p.inj.) and PBS-treated controls (n = 5–7). (C) Representative images of the cecal epithelium and quantification of epithelial NF-κB activation of p65GFP-FL mice pretreated with anti-CSF1R or isotype control, injected with LPS, and imaged 1 h.p.inj. (n = 7). Depletion efficiency of macrophages and DCs in anti-CSF1R treated mice. (D) Normalized marker expression of TNF+ compared with TNF macrophages in the cecum, small intestine, and colon of LPS-injected WT mice (n = 4–7). (E) Percentage of CD4+/− Tim4+/− cells among TNF and TNF+ macrophages in the cecum of LPS-injected WT mice (n = 4). (F) TNF-PLA analysis of cecae from p65GFP-FLxTlr4−/− mice reconstituted with a 1:40 mix of ActRFP (2.5%, Tlr4+/+) and p65GFP-FLxTlr4−/− (97.5%) BM. Representative confocal microscopy image of fixed cecal tissue at 40 min.p.inj. (left) and quantification of PLA for TNF in crypts without (−) or with (+) epithelial NF-κB activation (Fig. S5 A) at 1 h.p.inj. (n = 11–13). Scale bar: 10 µm. Black line: median. Statistical analysis: one-way ANOVA with Dunett’s correction (A), two-way ANOVA with Sidak’s multiple comparison test (B), or Mann–Whitney U test (C, E, and F). *, P ≤ 0.05; **, P ≤ 0.01. Each circle represents one mouse (A–E) or one crypt (F; five mice analyzed). Combined data of two (D), three (B and C), four (F), or six (A) independent experiments, or exemplary data of two (E) independent experiments.
Figure S4.
Figure S4.
Intestinal macrophages secrete TNF to induce local epithelial NF-κB activation. (A) Gating strategy for intestinal MP subsets in the cecal mucosa of mice depicted in B and C. (B and C) Flow cytometry analysis of cecal MPs from PBS- or LPS-injected (B) KappaBle mice for assessment of NF-κB activation (gating as shown in A; n = 3–5) or (C) WT mice for identification of TNF-producing MP subsets (gating as shown in A; n = 3–6). (D) Updated gating strategy for differentiation of intestinal DCs and macrophages as shown in Fig. 4, B, D, and E. Lineage = NK1.1, CD3, B220. (E) For scRNAseq, CD45+ live MHCII+ lineage (NK1.1, CD3, B220) cells were sorted from the cecal mucosa of 40 min LPS-injected mice or PBS-treated controls (n = 4 mice) and subsequently analyzed by scRNAseq (10X Genomics). T-distributed stochastic neighbor embedding plots showing the distribution of the analyzed cells indicated by cluster (left) or treatment (right). (F) Expression levels of intestinal MP markers: this analysis revealed two clear macrophages clusters (7 and 10). CD11b CD103+ Xcr1+ DCs were represented in clusters 1–4, out of which cluster 2 mainly consisted of cells from LPS-treated mice, indicating that this might represent an activated state. This is in line with the secondary TNF production of this subset at later time points after injection, as detected by flow cytometry (C). Clusters 0 and 5 were positive for Sirpa and contained CD11b+ CD103+ DCs (cluster 0) and CD11b+ CD103 DCs (cluster 5). While clusters 12 and 13 were positive for a number of monocyte/macrophage markers and therefore likely represent maturing macrophages, the assignment of clusters 6, 8, and 9 was challenging due to overlapping marker expression. These clusters, together with cluster 11 (mast cells), likely contained precursors (macrophage/DC, cluster 8) or contaminating cells (T cells, cluster 6 and 8; plasma cells, cluster 9). (G) Expression analysis of TLR4 signaling–associated genes. (H) Gene set enrichment analysis for macrophage clusters (7 and 10). (I) Frequency of DCs and macrophages in the cecum, small intestine, and colon of naive WT mice (n = 5). Each circle represents one mouse (B, C, and I) or one cell (E). Black line: median. Combined data of two (I), three (B), or nine (C) independent experiments. Statistical analysis: one-way ANOVA with Tukey’s correction (C) or Mann–Whitney U test (B). *, P ≤ 0.05; **, P ≤ 0.01.
Figure S5.
Figure S5.
Intestinal epithelial NF-κB activation status of S. Tm–infected mice correlates with mucosal expression of NF-κB target genes. (A) Representative image of TNF-PLA in the cecal mucosa of LPS-injected mice as described in Fig. 4 F. Dashed line indicates a crypt without epithelial NF-κB activation. Solid line indicates a crypt with epithelial NF-κB activation. Scale bars: 50 µm. (B) LPS concentrations in the cecum lumen of untreated mice and mice that were streptomycin-pretreated and infected with S. Tm for 24 h (n = 3). (C) Quantification of epithelial NF-κB activation in the cecum of TNF-treated mice with or without isoflurane anesthesia at 15 min.p.inj. (n = 3–5). (D) Relative distribution of intestinal epithelial NF-κB activation status of S. Tm–infected mice described in Fig. 5 A, sorted by time of infection (n = 28). (E and F) Transcript levels of Cxcl2 and Zyx in the cecal mucosa of mice described in A and naive p65GFP-FL mice, grouped according to (E) the time point of infection (color code as in A) or (F) the epithelial NF-κB activation status of the respective mice. Expression levels were normalized to Actb and depicted in 2-ΔCT (n = 33). (G–I) Confocal microscopy images of mice infected with S. Tm for 12 h (n = 6). 3D visualizations in Video 1, Video 2, and Video 3. Boxes in overview images indicate insets. Arrowheads indicate p65+ nuclei (G). Asterisks indicate p65 nuclei (H). Arrows indicate S. Tm in LP (G) or in the lumen (H). Dashed line indicates the epithelium (I). Scale bars: 30 µm (overview images) or 10 µm (insets). (J) C3 transcription levels in untreated and TNF-treated (5 ng/ml, 4 h) NF-κBΔIEC small intestinal epithelial organoids depicted as 2-ΔCT. Expression levels were normalized to Actb (n = 5). (K) Gating strategy for analysis of C3-coated S. Tm in the intestinal lumen (Fig. 5 G). Combined data of two (B and C) or five (J) independent experiments or representative images of five independent experiments (G–I). Statistical analysis: Mann-Whitney U test. *, P ≤ 0.05; **, P ≤ 0.01. Black line: median. Each circle represents one mouse (B–F) or one experiment (average, J).
Figure 5.
Figure 5.
TNF-mediated epithelial NF-κB activation occurs upon bacterial infection and induces an antibacterial response. (A) Representative two-photon microscopy images of cecal explants of streptomycin-pretreated p65GFP-FL mice infected with S. Tm for 8–13.5 h (n = 28). Categories for scoring of epithelial NF-κB activation status: “no activation” (green); “patchy activation” (blue); “full activation” (orange); “inflammation” (red; tissue distortion evident); “unspecified” (gray; was excluded from further analysis). Scale bars: 50 µm. (B) Distribution of the analyzed 28 samples of A among the four epithelial NF-κB activation categories (bottom). For simplification, the blue, orange, and red categories were summarized as “NF-κB signaling” (yellow, top). (C) Tnf transcript levels in the cecal mucosa of mice described in A and naive p65GFP-FL mice, grouped according to the epithelial NF-κB activation status of the respective mice and depicted as 2-ΔCT. Expression levels were normalized to Actb (n = 33). (D) TNFa+/− or TNFa−/− > p65GFP-FLxTlr4−/− BMCs were analyzed as described in A and B. (E) Log2 ratios of selected genes in a transcriptome analysis of TNF-treated (8 h, 5 ng/ml) compared with untreated small intestinal epithelial organoids (Hausmann et al., 2020b). FDR, false discovery rate. (F) C3 transcript levels in untreated and TNF-treated (5 ng/ml, 4 h) small intestinal organoids depicted as 2-ΔCT. Expression levels were normalized to Actb. (G) Streptomycin-pretreated TNFa−/− mice and heterozygous littermates were orally infected with S. Tm for 36h. S. Tm in the cecal lumen (gated on O12+ cells, see Fig. S5 K) were stained for surface C3 to assess coating of luminal bacteria by flow cytometry (C3+ population). MFI, median fluorescence intensity. Statistical analysis: Mann–Whitney U test (C, F, and G) or χ2 test (D). *, P ≤ 0.05; **, P ≤ 0.01. Each circle represents one mouse (C and G) or one experiment (average; F). y axis in log10 scale (C, F, and G). Combined data of three (G), four (F), five (A–C), or six (D) independent experiments.

References

    1. Abeler-Dörner, L., Laing A.G., Lorenc A., Ushakov D.S., Clare S., Speak A.O., Duque-Correa M.A., White J.K., Ramirez-Solis R., Saran N., et al. . 2020. High-throughput phenotyping reveals expansive genetic and structural underpinnings of immune variation. Nat. Immunol. 21:86–100. 10.1038/s41590-019-0549-0 - DOI - PMC - PubMed
    1. Adachi, O., Kawai T., Takeda K., Matsumoto M., Tsutsui H., Sakagami M., Nakanishi K., and Akira S.. 1998. Targeted disruption of the MyD88 gene results in loss of IL-1- and IL-18-mediated function. Immunity. 9:143–150. 10.1016/S1074-7613(00)80596-8 - DOI - PubMed
    1. Akira, S., and Hoshino K.. 2003. Myeloid differentiation factor 88-dependent and -independent pathways in toll-like receptor signaling. J. Infect. Dis. 187(s2, Suppl 2):S356–S363. 10.1086/374749 - DOI - PubMed
    1. Allaire, J.M., Poon A., Crowley S.M., Han X., Sharafian Z., Moore N., Stahl M., Bressler B., Lavoie P.M., Jacobson K., et al. . 2021. Interleukin-37 regulates innate immune signaling in human and mouse colonic organoids. Sci. Rep. 11:8206. 10.1038/s41598-021-87592-2 - DOI - PMC - PubMed
    1. Arnold, I.C., Mathisen S., Schulthess J., Danne C., Hegazy A.N., and Powrie F.. 2016. CD11c(+) monocyte/macrophages promote chronic Helicobacter hepaticus-induced intestinal inflammation through the production of IL-23. Mucosal Immunol. 9:352–363. 10.1038/mi.2015.65 - DOI - PMC - PubMed

Publication types

LinkOut - more resources