. 2022 Feb 24;139(8):1234-1245.
doi: 10.1182/blood.2021012322.

PKM2 promotes neutrophil activation and cerebral thromboinflammation: therapeutic implications for ischemic stroke

Affiliations

PKM2 promotes neutrophil activation and cerebral thromboinflammation: therapeutic implications for ischemic stroke

Nirav Dhanesha et al. Blood. .

Abstract

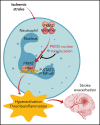
There is a critical need for cerebro-protective interventions to improve the suboptimal outcomes of patients with ischemic stroke who have been treated with reperfusion strategies. We found that nuclear pyruvate kinase muscle 2 (PKM2), a modulator of systemic inflammation, was upregulated in neutrophils after the onset of ischemic stroke in both humans and mice. Therefore, we determined the role of PKM2 in stroke pathogenesis by using murine models with preexisting comorbidities. We generated novel myeloid cell-specific PKM2-/- mice on wild-type (PKM2fl/flLysMCre+) and hyperlipidemic background (PKM2fl/flLysMCre+Apoe-/-). Controls were littermate PKM2fl/flLysMCre- or PKM2fl/flLysMCre-Apoe-/- mice. Genetic deletion of PKM2 in myeloid cells limited inflammatory response in peripheral neutrophils and reduced neutrophil extracellular traps after cerebral ischemia and reperfusion, suggesting that PKM2 promotes neutrophil hyperactivation in the setting of stroke. In the filament and autologous clot and recombinant tissue plasminogen activator stroke models, irrespective of sex, deletion of PKM2 in myeloid cells in either wild-type or hyperlipidemic mice reduced infarcts and enhanced long-term sensorimotor recovery. Laser speckle imaging revealed improved regional cerebral blood flow in myeloid cell-specific PKM2-deficient mice that was concomitant with reduced post-ischemic cerebral thrombo-inflammation (intracerebral fibrinogen, platelet [CD41+] deposition, neutrophil infiltration, and inflammatory cytokines). Mechanistically, PKM2 regulates post-ischemic inflammation in peripheral neutrophils by promoting STAT3 phosphorylation. To enhance the translational significance, we inhibited PKM2 nuclear translocation using a small molecule and found significantly reduced neutrophil hyperactivation and improved short-term and long-term functional outcomes after stroke. Collectively, these findings identify PKM2 as a novel therapeutic target to improve brain salvage and recovery after reperfusion.


Figures

None
Graphical abstract
Figure 1.
Figure 1.
Nuclear PKM2 is elevated in peripheral neutrophils after a stroke in humans and in WT mice and regulates neutrophil hyperactivation. (A) Top: schematic of experimental design. Bottom: western blot analysis of PKM2 in the cytosolic and nuclear fraction from the peripheral neutrophils isolated from the patients with acute ischemic stroke who underwent successful mechanical thrombectomy. The quantitative data for cytosolic and nuclear PKM2 intensity (normalized to the intensity of lamin-B1/glyceraldehyde-3-phosphate dehydrogenase (GAPDH) are shown on the right. (B) Top: schematic of experimental design. Bottom: western blot analysis of PKM2 in the cytosolic and nuclear fraction from the peripheral neutrophils of male WT mice. The quantitative data for cytosolic and nuclear PKM2 intensity (normalized to the intensity of lamin-B1/GAPDH at each time point) are shown on the right. (C) Western blot analysis of PKM2 from neutrophils derived from the bone marrow of male mice. (D) Immunofluorescence analysis of NETs from peripheral neutrophils isolated 6 hours after reperfusion. Neutrophils were stimulated with a suboptimal concentration of PMA (10 ng/mL), and NETs were visualized by using SYTOX Green stain. Scale bars, 100 µm. Quantification is shown on the right. (E) Inflammatory cytokines in peripheral neutrophils isolated 6 hours after reperfusion from each group as analyzed by enzyme-linked immunosorbent assay (ELISA). (F) Gene expression analysis for the neutrophils isolated 6 hours after reperfusion as analyzed by reverse transcriptase polymerase chain reaction. Data are from 2-way repeated measures analysis of variance (ANOVA) (Kruskal-Wallis test) followed by Fisher’s least significant difference (LSD) test; panels (A-B); or an unpaired Student t test (D-F). Data are mean ± standard error of the mean (SEM); n = 4-6 (A-B); n = 4-5 (D-E); n = 6 (F). AU, arbitrary units; HIF1-α, hypoxia-inducible factor 1-α; MCAO, middle cerebral artery occlusion; MMP9, matrix metallopeptidase 9; mRNA, messenger RNA; NS, not significant; TICI, thrombolysis in cerebral infarction.
Figure 2.
Figure 2.
Deletion of PKM2 in myeloid cells improves stroke outcome in the filament and embolic models in a preexisting comorbid condition of hyperlipidemia. (A) Schematic of experimental design. (B-E) Filament model; n = 10-11 male mice. (B) Left: representative magnetic resonance imaging from 1 mouse of each genotype on day 1. White is the infarct area. Right: corrected mean infarct area of each genotype. (C) Survival rate between day 0 and day 7 after 60 minutes of transient ischemia. (D) mNSS in the same mice at days 1, 3, and 7 based on spontaneous activity, symmetry in the movement of 4 limbs, forepaw outstretching, climbing, body proprioception, and responses to vibrissae touch (higher score indicates a better outcome). (E) Fall latency in the accelerated rota-rod test. (F-I) Embolic model; n = 10 male mice. (F) Infarction (%), (G) survival rate, (H) mNSS, and (I) fall latency. (F) Left: representative magnetic resonance imaging from 1 mouse of each genotype on day 1. White is the infarct area. Right: corrected mean infarct area of each genotype. The animals that successfully completed the particular neurologic test were included in the analysis (see exclusion/inclusion criteria in “Methods”). Data are from an unpaired Student t test, mean ± SEM (B-F) or median ± range (D-E,H-I). Comparison of survival curves was evaluated by log-rank (Mantel-Cox) test (C,G) or by repeated measures ANOVA (Kruskal-Wallis test) followed by Fisher’s LSD test (D-E,H-I).
Figure 3.
Figure 3.
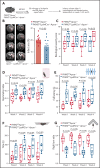
Myeloid cell–specific PKM2−/− mice exhibit improved long-term sensorimotor recovery up to day 28. (A) Schematic of experimental design. (B) Left: representative magnetic resonance imaging from 1 mouse of each genotype on day 1 in filament model. White is the infarct area. Right: corrected mean infarct area of each genotype. (C) mNSS in the same mice at weeks 1, 2, 3, and 4 based on spontaneous activity, symmetry in the movement of 4 limbs, forepaw outstretching, climbing, body proprioception, and responses to vibrissae touch (higher score indicates a better outcome). Sensorimotor recovery in the same mice as analyzed by asymmetry index in cylinder test (D), fall latency in accelerated rota-rod test (E), motor strength in hanging-wire test (F), and right turn ratio in corner test (G). The data in panels C-G are in box plots and the horizontal bars indicate median value. The animals that successfully completed the particular neurologic test were included in the analysis (see exclusion/inclusion criteria in “Methods”). Data are mean ± SEM (B) or median ± range (C,G); n = 10 male mice (B,G). Data are from an unpaired Student t test (B) or 2-way repeated measures ANOVA (Kruskal-Wallis test) followed by Fisher’s LSD test (D,G).
Figure 4.
Figure 4.
Myeloid cell–specific PKM2−/− mice exhibited improved local cerebral blood flow and reduced poststroke cerebral thrombosis. (A) Left: representative images were taken by using laser speckle imaging of regional cerebral blood flow in the cortical region. Right: quantification at different time points (5 to 120 minutes). (B) Left: representative immunostaining images for platelets (CD41+, green; fibrinogen, red). Scale bar, 100 μm. Right: thrombotic index as defined by the ratio of occluded brain vessels to the total brain vessels in the ipsilateral hemisphere. (C) Brain homogenates from the infarcted and peri-infarcted area after 1 hour of ischemia and 23 hours of reperfusion were processed for western blotting: representative western blots and densitometric analysis of fibrinogen and platelets (CD4+). β-actin was used as a loading control. All data are from male mice and are mean ± SEM; n = 5 (A); n = 4 (B-C). Data are from 2-way repeated measures ANOVA (Kruskal-Wallis test) followed by Fisher’s LSD test (A), or an unpaired Student t test (B-C). I/R, ischemia and reperfusion.
Figure 5.
Figure 5.
PKM2 mediates poststroke inflammation by promoting phosphorylation of STAT3 in neutrophils. (A) Left: representative image of flow cytometric analysis for MPO from each group. Right: quantification of MPO expression levels in peripheral neutrophils isolated 6 hours post-reperfusion in mice with stroke. Neutrophils were stimulated with a suboptimal concentration of PMA (10 ng/mL). (B) Elastase levels as determined by ELISA from the cell extracts of peripheral neutrophils, isolated 6 hours post-reperfusion in mice with sham-surgery or stroke. (C) Left: representative immunostained images for neutrophils (brown Ly6B.2-positive cells indicated by red arrows) in infarcted brain regions. Inset in the boxed region is magnified and shown in microphotograph. Scale bar, 100 μm. Right: quantification. (D) Peripheral neutrophils were isolated 6 hours postreperfusion in mice with stroke, and cell extracts were IP with PKM2 antibody or control IgG and immunoblotted for PKM2 and STAT3. (E) Western blot analysis of PKM2 cell extracts from the peripheral neutrophils isolated 6 hours post-reperfusion in mice with stroke. The quantitative phospho STAT3 and phospho NF-κβ intensity (normalized to the total STAT3 and NF-κβ, respectively) are shown on the right. Data are from female mice and are mean ± SEM. n = 5 (A); n = 3-4 (B-C,E). Data are from 2-way repeated measures ANOVA (Kruskal-Wallis test) followed by Fisher’s LSD test (A-B) and unpaired Student t-tests (C,E). FSC, forward scatter; IgG, immunoglobulin G; IP, immunoprecipitated; MPO, myeloperoxidase; MFI, mean fluorescence intensity.
Figure 6.
Figure 6.
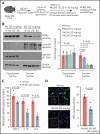
ML265 treatment significantly reduces PKM2 nuclear translocation and neutrophil hyperactivation after acute ischemic stroke. (A) Schematic of experimental design. (B) Western blot analysis of PKM2 in the cytosolic and nuclear fraction from the peripheral neutrophils isolated 6 hours after reperfusion in mice treated with ML265 at the indicated doses. The quantitative data of cytosolic and nuclear PKM2 intensity (normalized to the intensity of lamin-B1 or GAPDH at each time point) are shown on the right. (C) TNF-α, IL-1β, and IL-6 levels in neutrophils isolated 6 hours after reperfusion from each group as analyzed by ELISA. (D) Immunofluorescence analysis of NETs from the neutrophils isolated 6 hours after reperfusion. Neutrophils were stimulated with the suboptimal concentration of PMA (10 ng/mL), and NETs were visualized by using SYTOX Green stain. Scale bars, 100 µm. Quantification is shown on the right. Data are from male WT mice and are mean ± SEM; n = 3 (B); n = 4 (C); n = 5 (D). Data are from 2-way repeated measures ANOVA (Kruskal-Wallis test) followed by Fisher’s LSD test (B), or an unpaired Student t test (C,D).
Figure 7.
Figure 7.
ML265-treated male WT mice exhibited significantly reduced infarct area and improved long-term sensorimotor outcomes. (A) Schematic of experimental design. (B) Left: representative magnetic resonance imaging from one mouse of each group on day 1 in filament model. White is the infarct area. Right: corrected mean infarct area of each genotype. (C) mNSS in the same mice at weeks 1, 2, 3, and 4 based on spontaneous activity, symmetry in the movement of 4 limbs, forepaw outstretching, climbing, body proprioception, and responses to vibrissae touch (higher score indicates a better outcome). Sensorimotor recovery in the same mice as analyzed by right turn ratio in corner test (D), fall latency in accelerated rota-rod test (E), and motor strength in hanging-wire test (F). The data in panels C-F are in box plots and the horizontal bars indicate median value. (G) Survival rate between day 0 and day 28. Data are mean ± SEM (B) and median ± range (C,F); n = 15-16 mice. Data are from an unpaired Student t test (B), or 2-way repeated measures ANOVA (Kruskal-Wallis test) followed by Fisher’s LSD test (C,F). Comparison of survival curves was evaluated by log-rank (Mantel-Cox) test (G).

Comment in

References

    1. Alexandrov AV, Grotta JC. Arterial reocclusion in stroke patients treated with intravenous tissue plasminogen activator. Neurology. 2002;59(6):862-867. - PubMed
    1. Rubiera M, Alvarez-Sabín J, Ribo M, et al. . Predictors of early arterial reocclusion after tissue plasminogen activator-induced recanalization in acute ischemic stroke. Stroke. 2005;36(7):1452-1456. - PubMed
    1. Goyal M, Menon BK, van Zwam WH, et al. ; HERMES collaborators . Endovascular thrombectomy after large-vessel ischaemic stroke: a meta-analysis of individual patient data from five randomised trials. Lancet. 2016;387(10029):1723-1731. - PubMed
    1. Stoll G, Nieswandt B. Thrombo-inflammation in acute ischaemic stroke - implications for treatment. Nat Rev Neurol. 2019;15(8):473-481. - PubMed
    1. De Meyer SF, Denorme F, Langhauser F, Geuss E, Fluri F, Kleinschnitz C. Thromboinflammation in stroke brain damage. Stroke. 2016;47(4): 1165-1172. - PubMed

Publication types