. 2022 Mar 17;29(3):476-489.e6.
doi: 10.1016/j.chembiol.2021.08.014. Epub 2021 Sep 15.

Control of topoisomerase II activity and chemotherapeutic inhibition by TCA cycle metabolites

Affiliations

Control of topoisomerase II activity and chemotherapeutic inhibition by TCA cycle metabolites

Joyce H Lee et al. Cell Chem Biol. .

Abstract

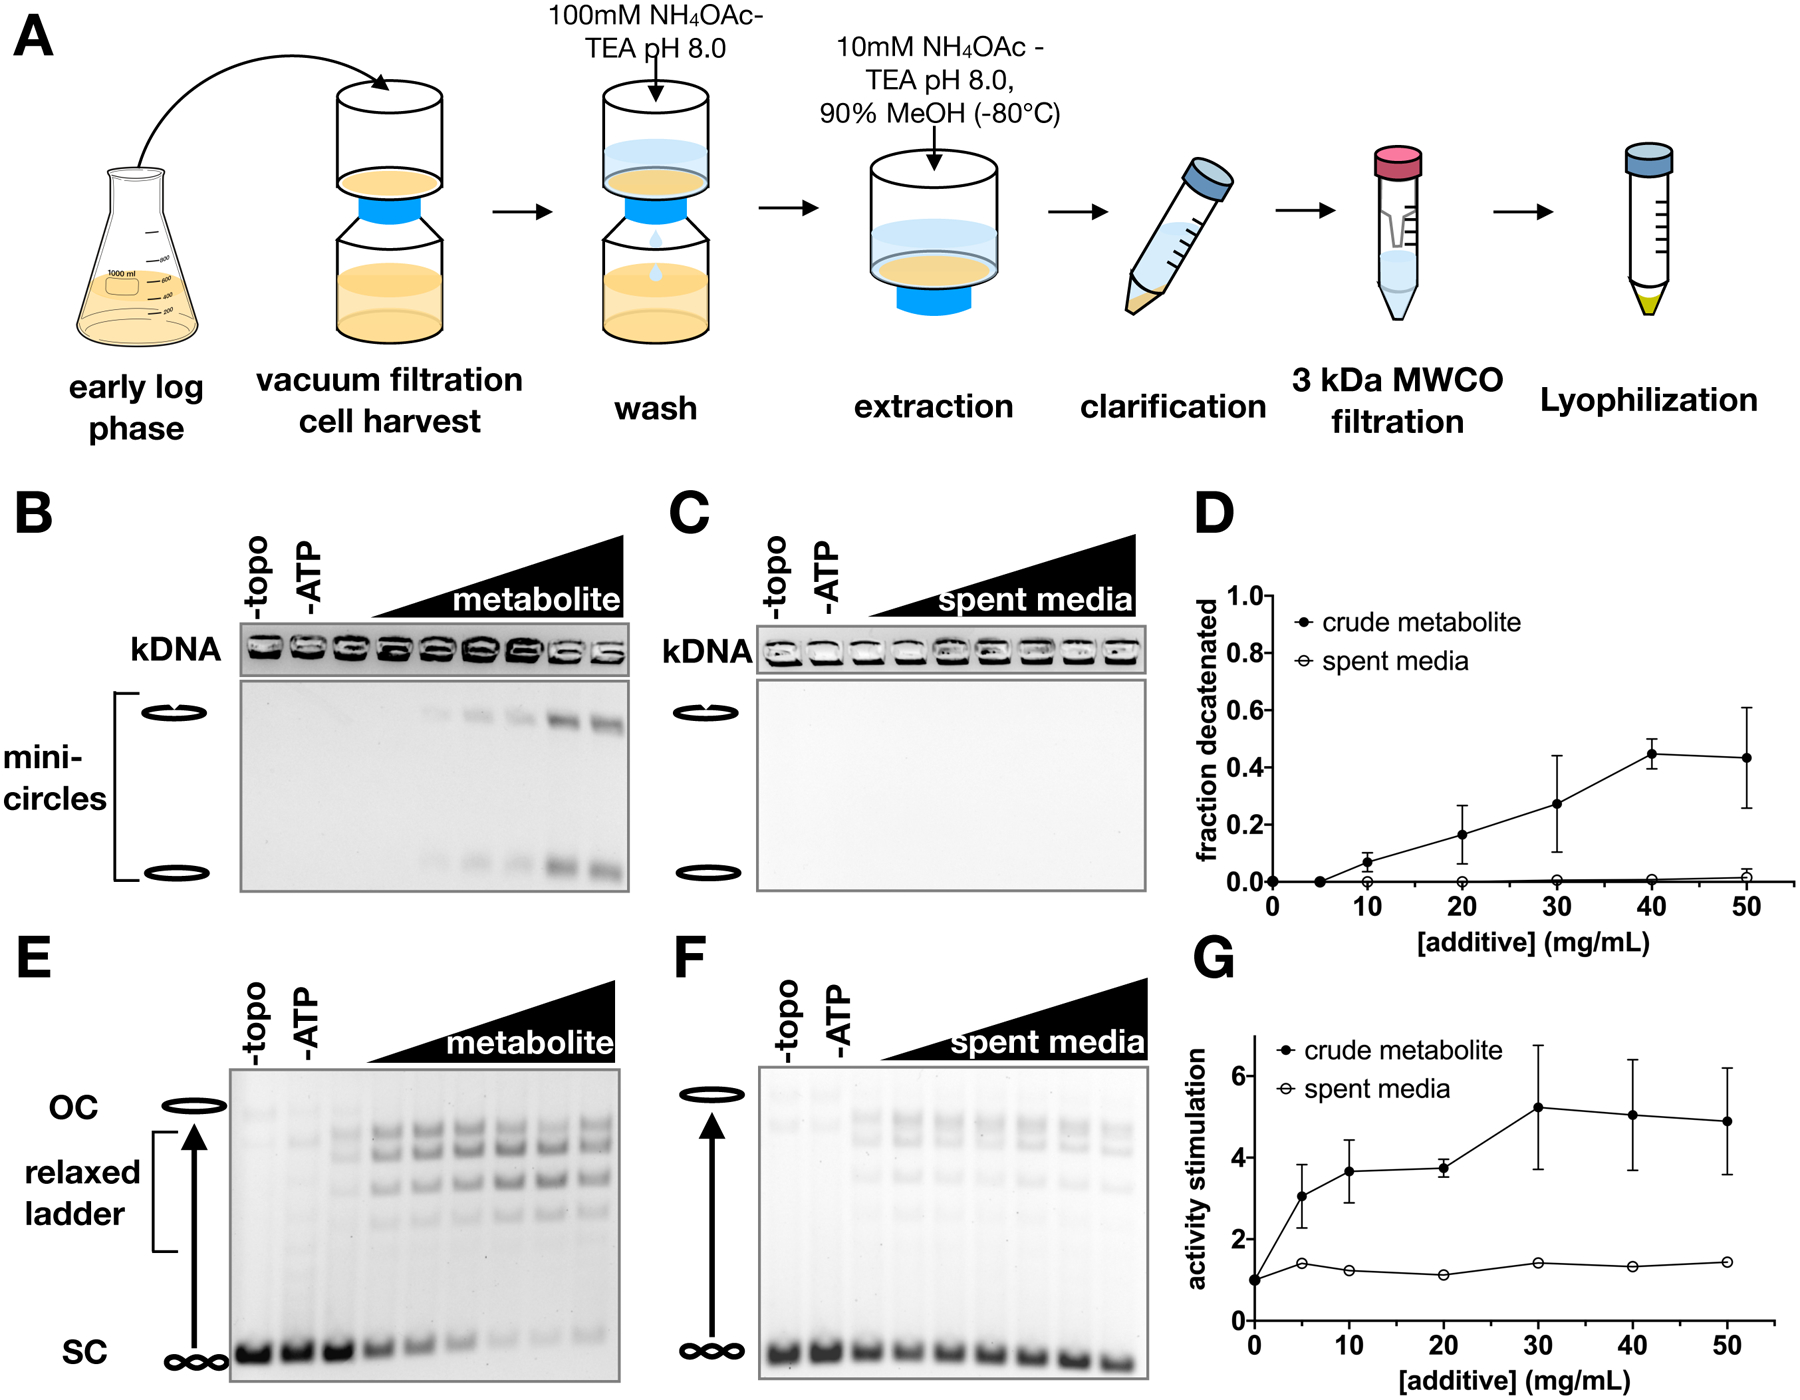
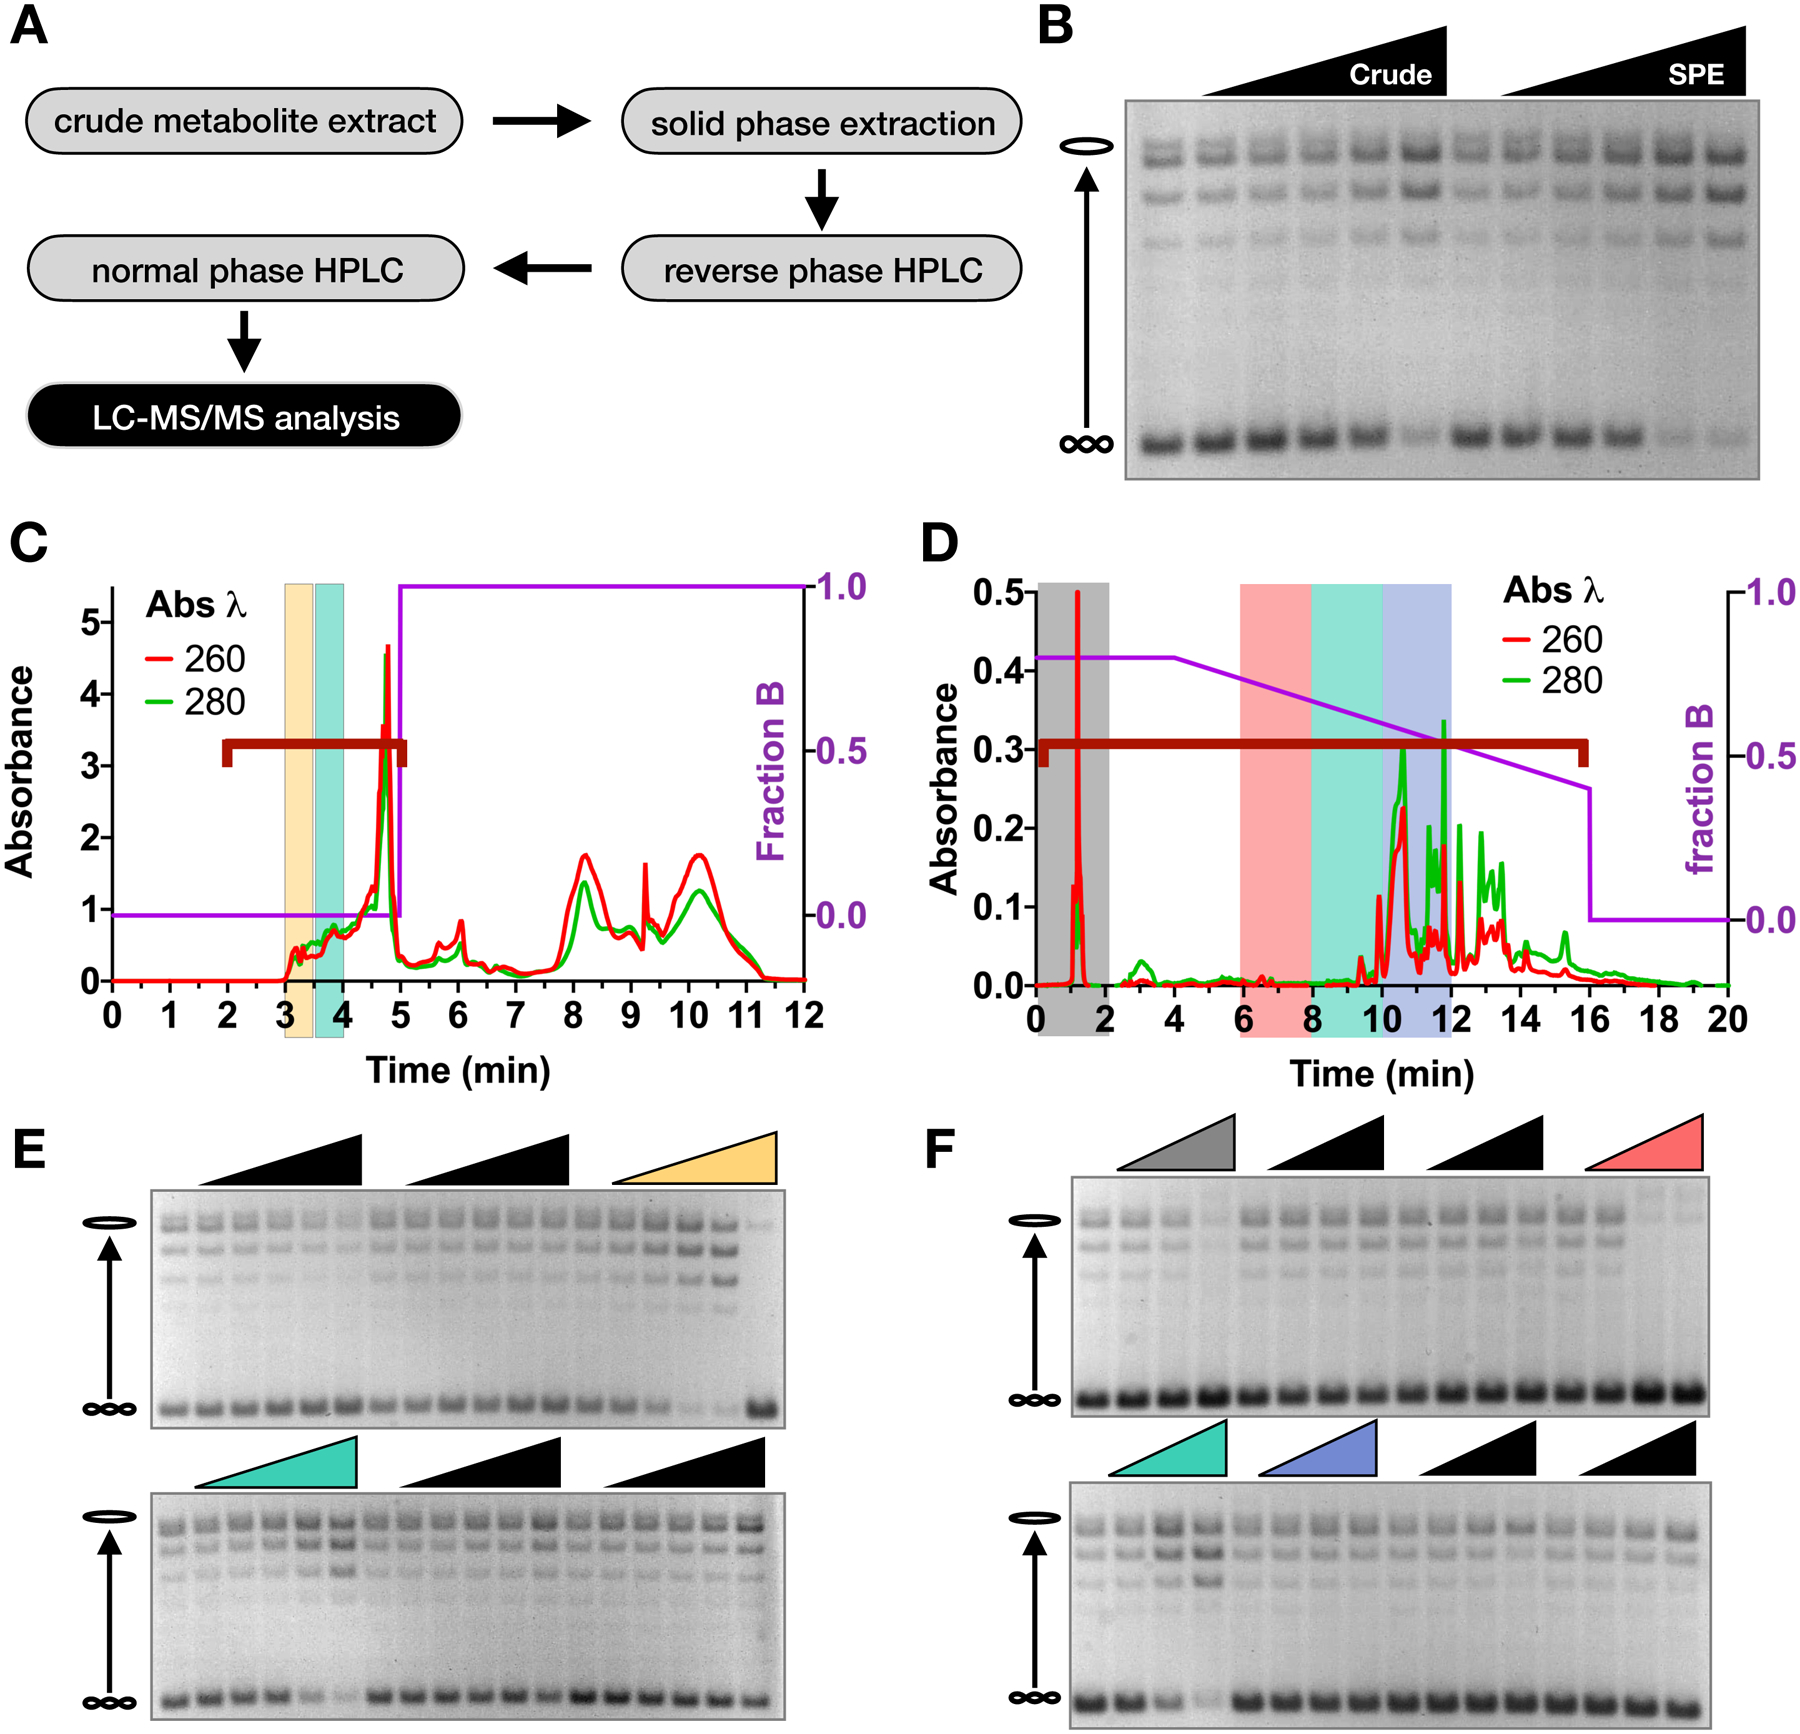
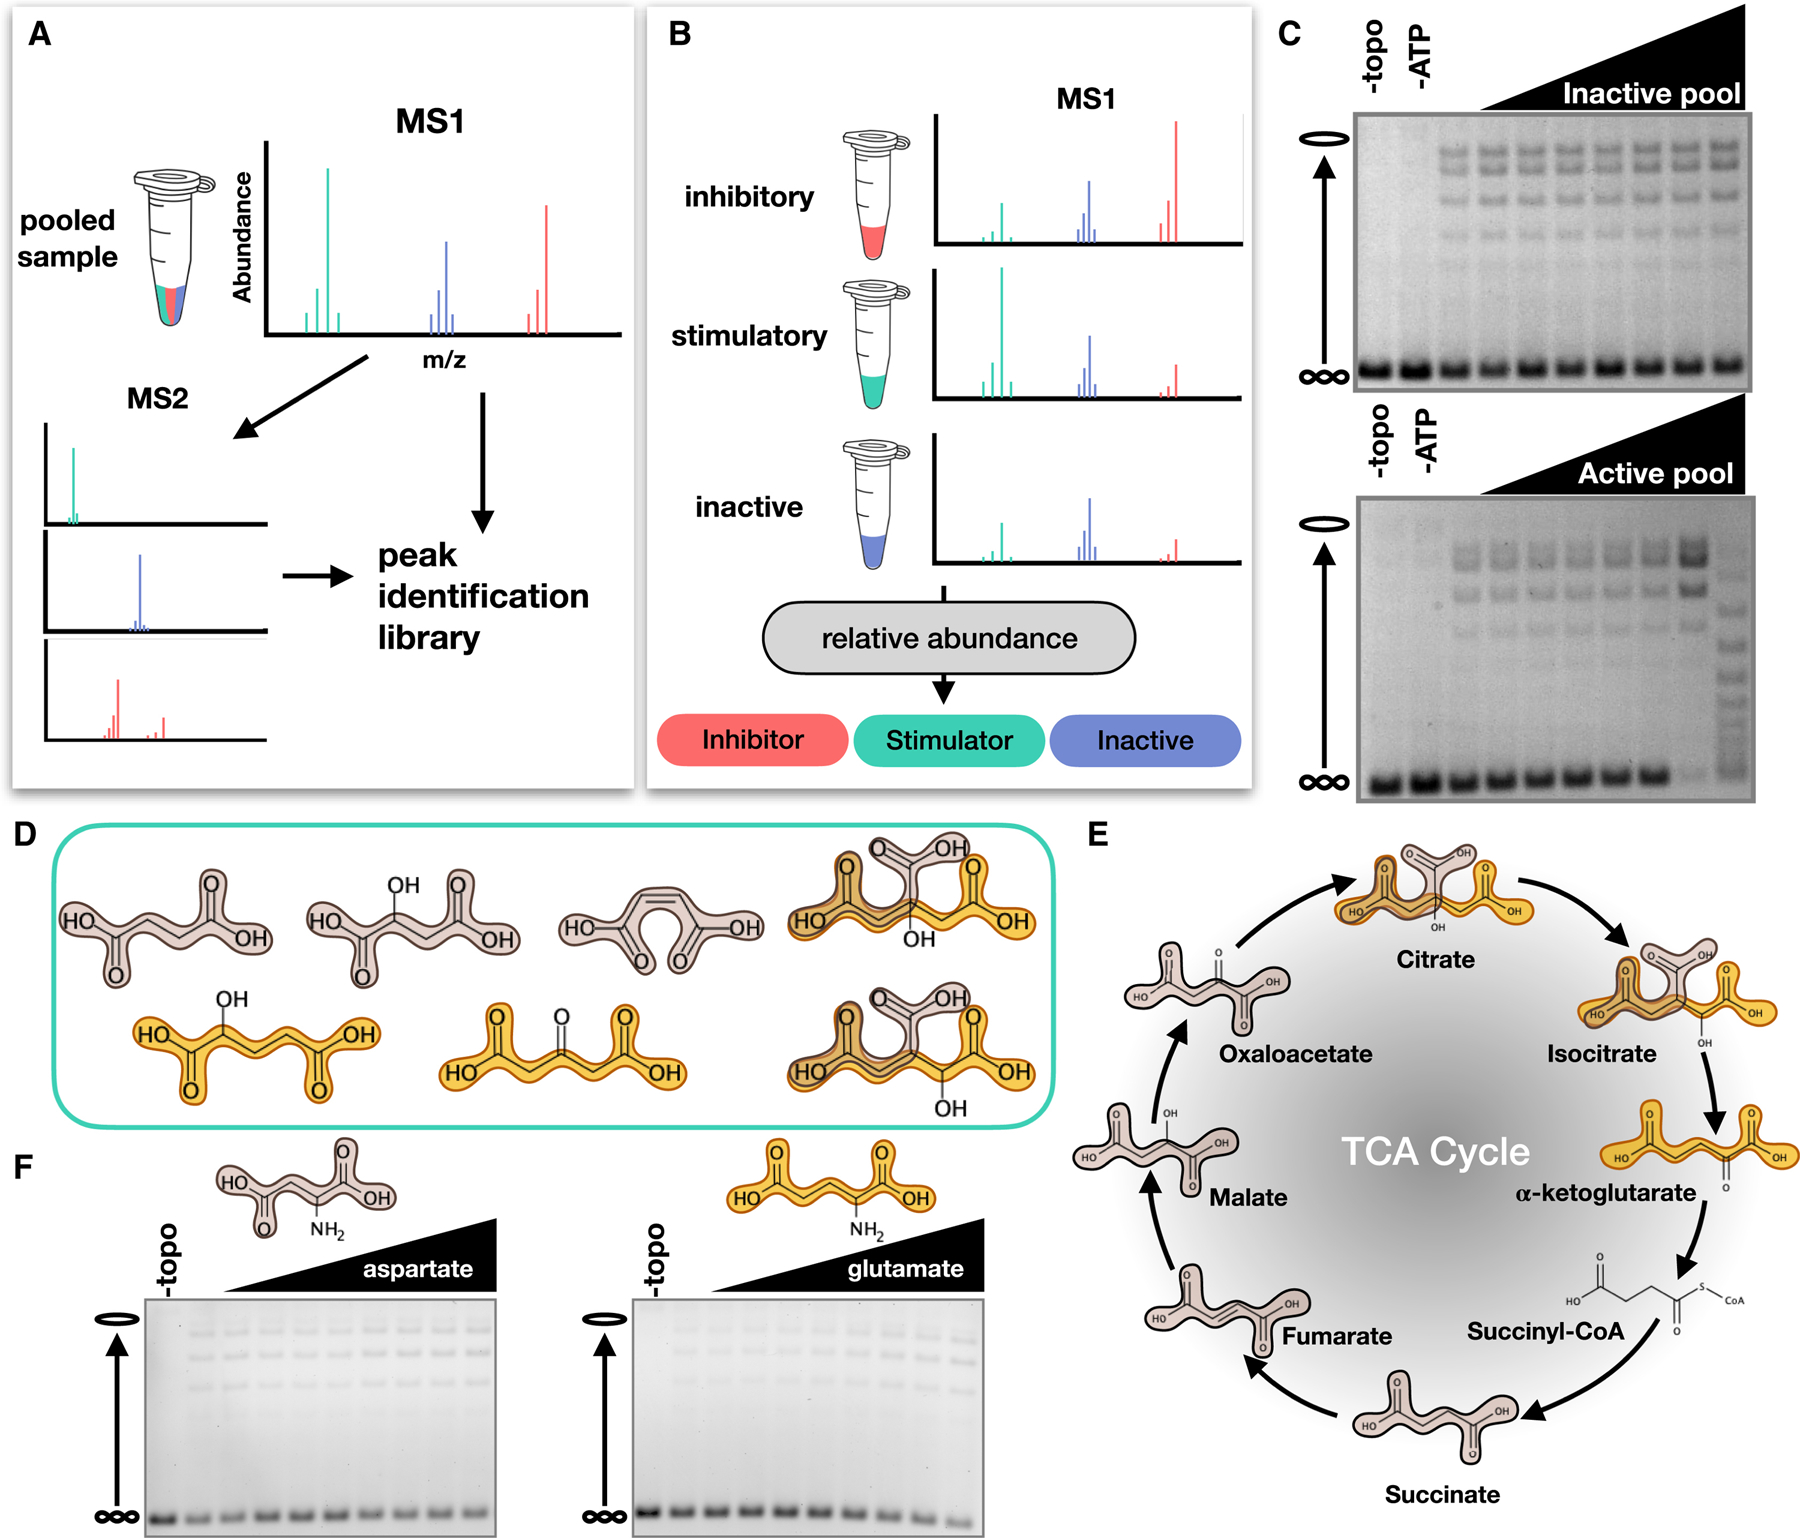
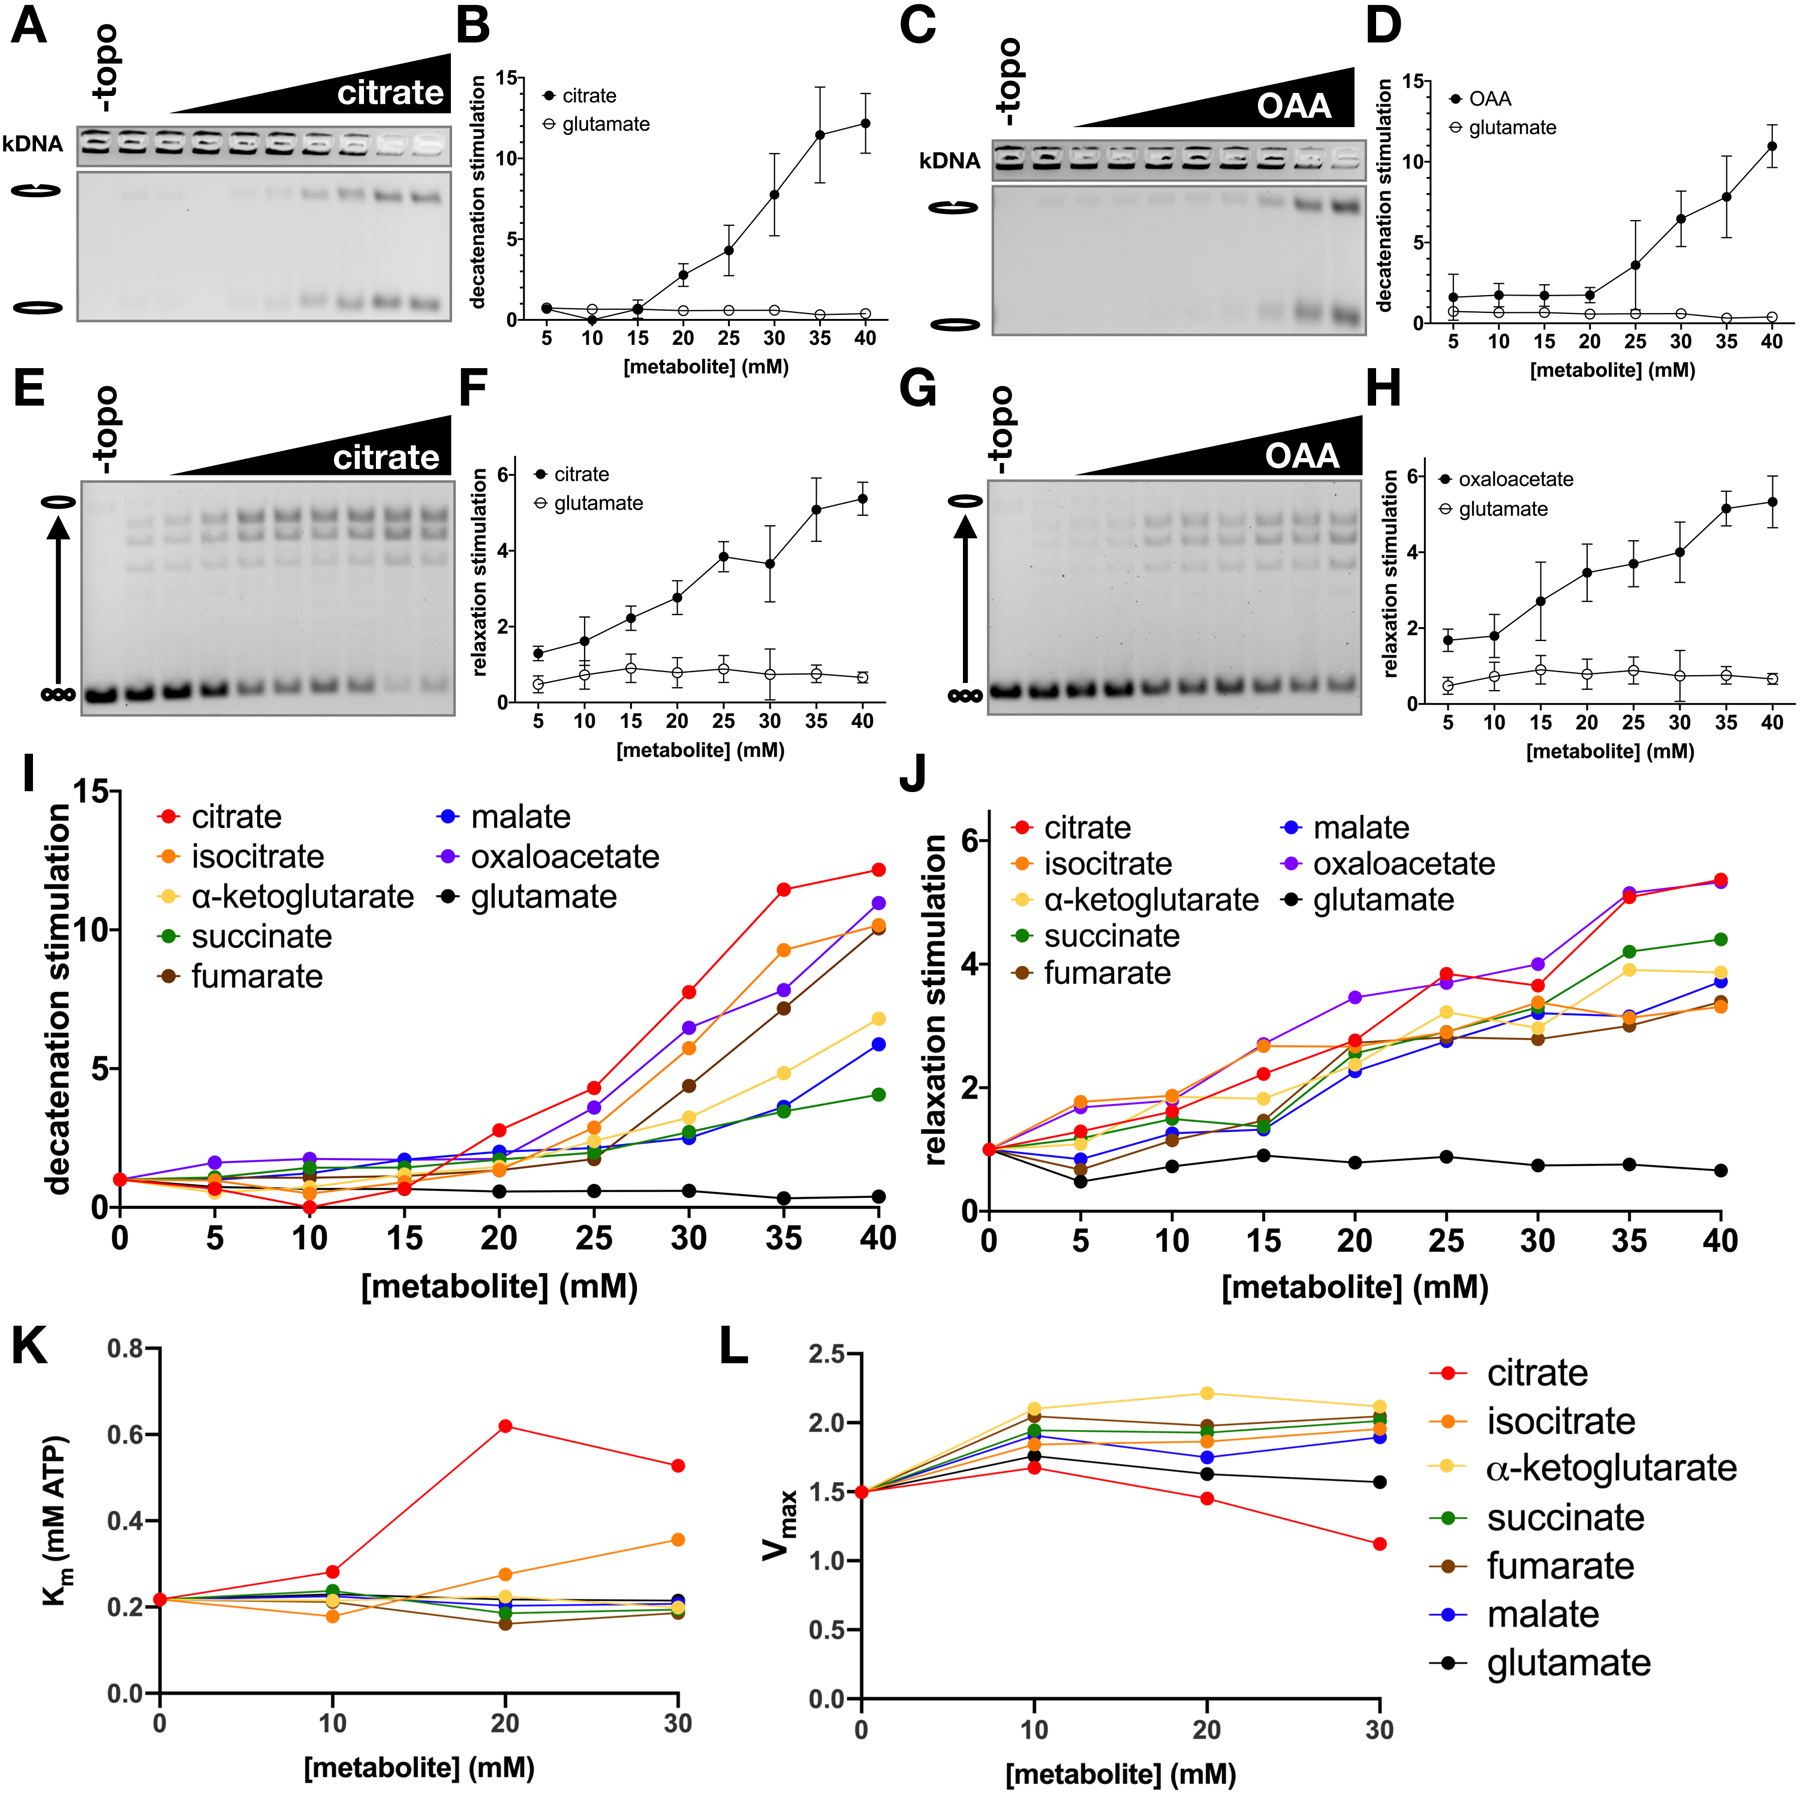
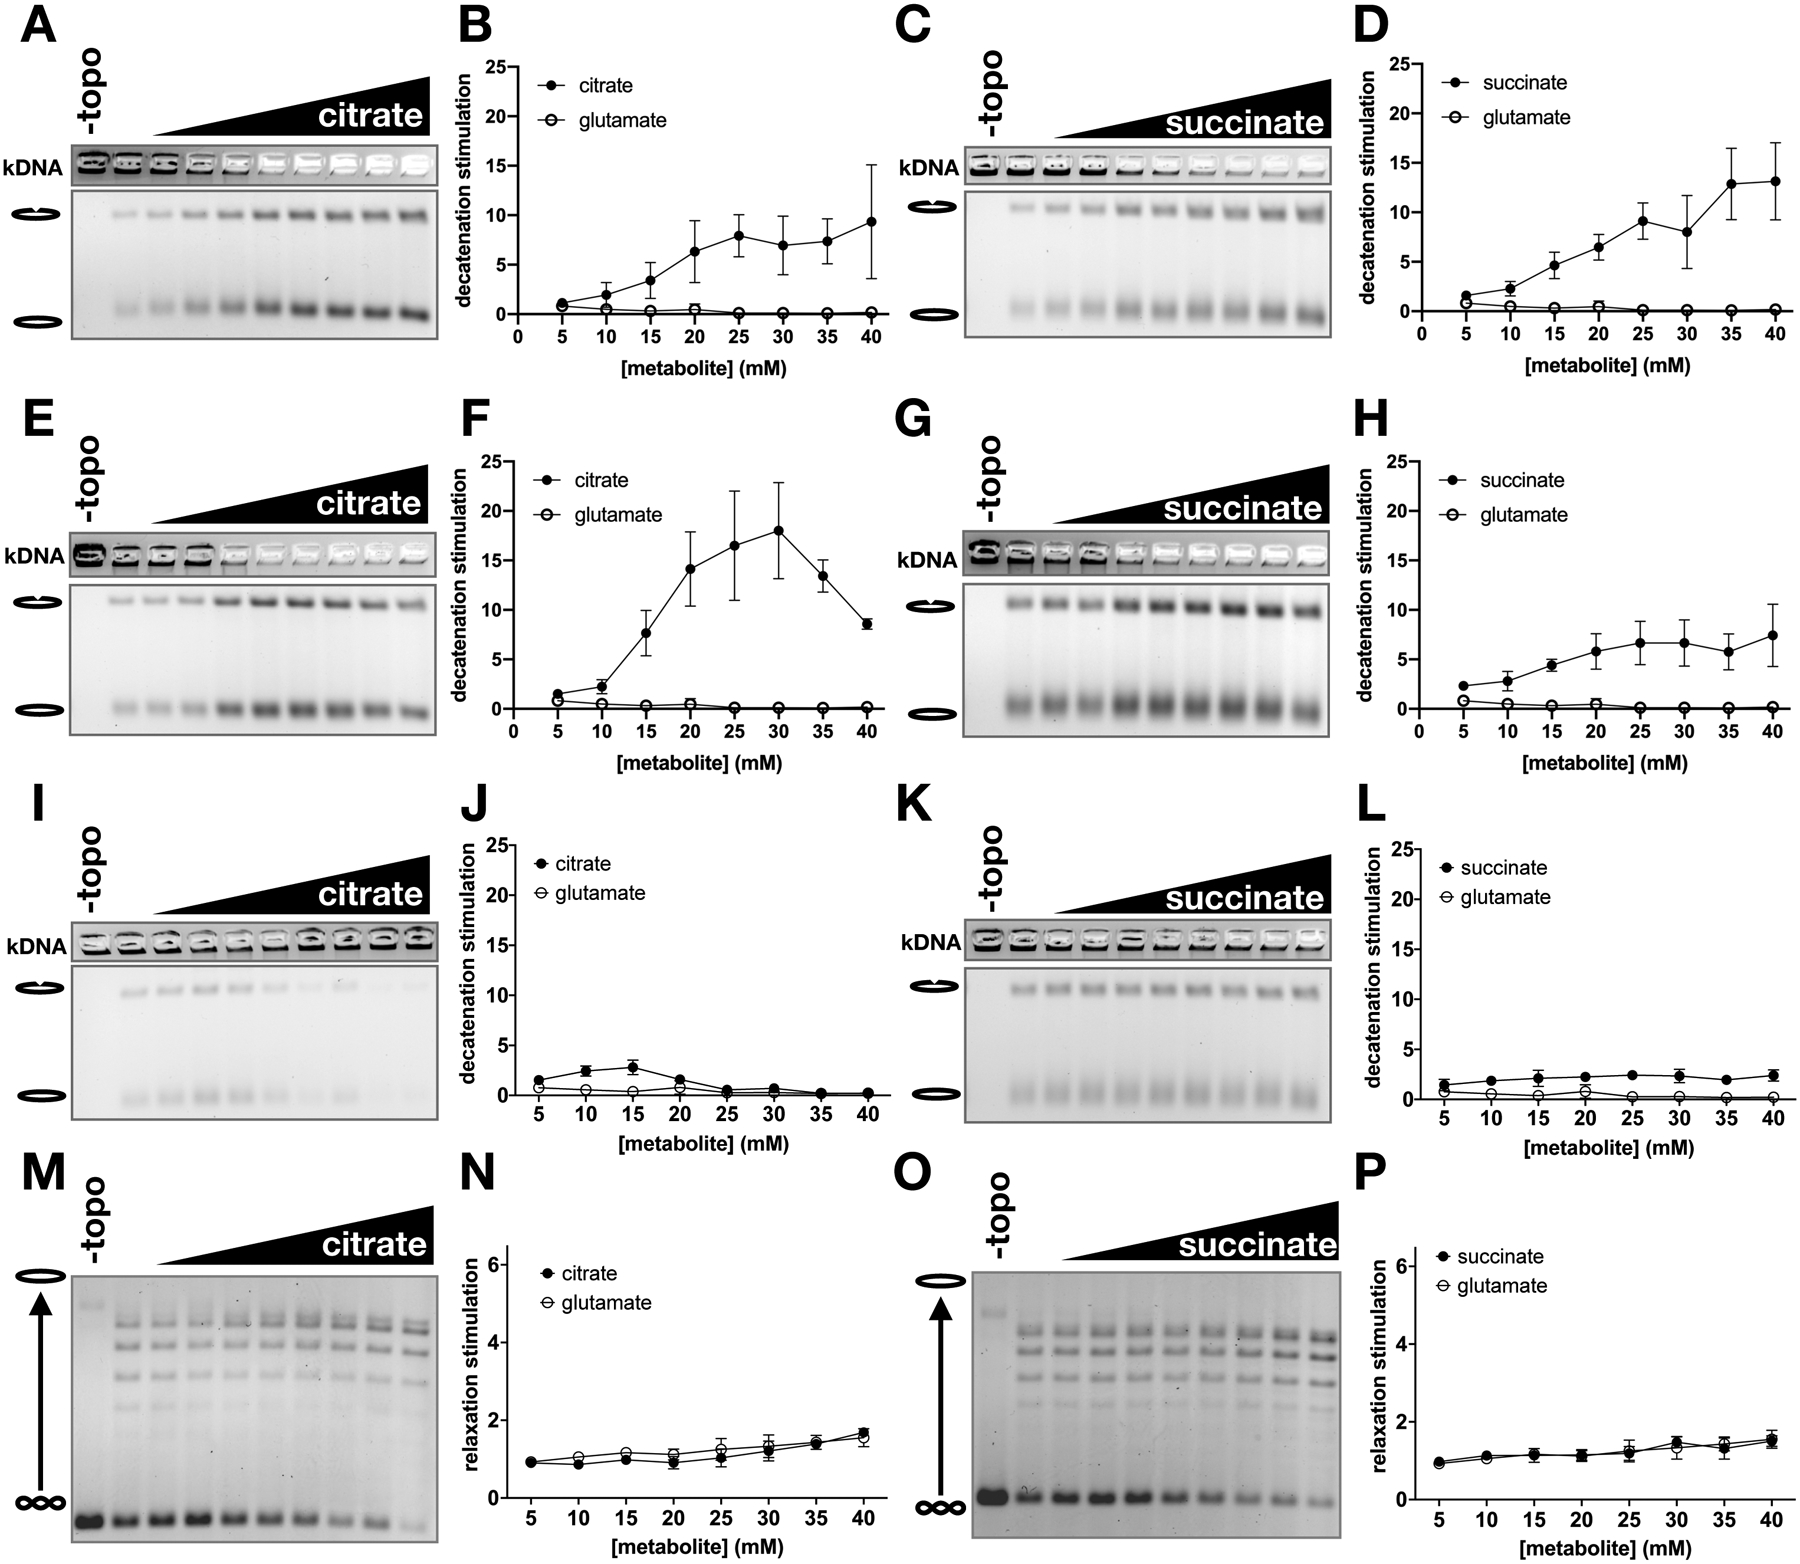
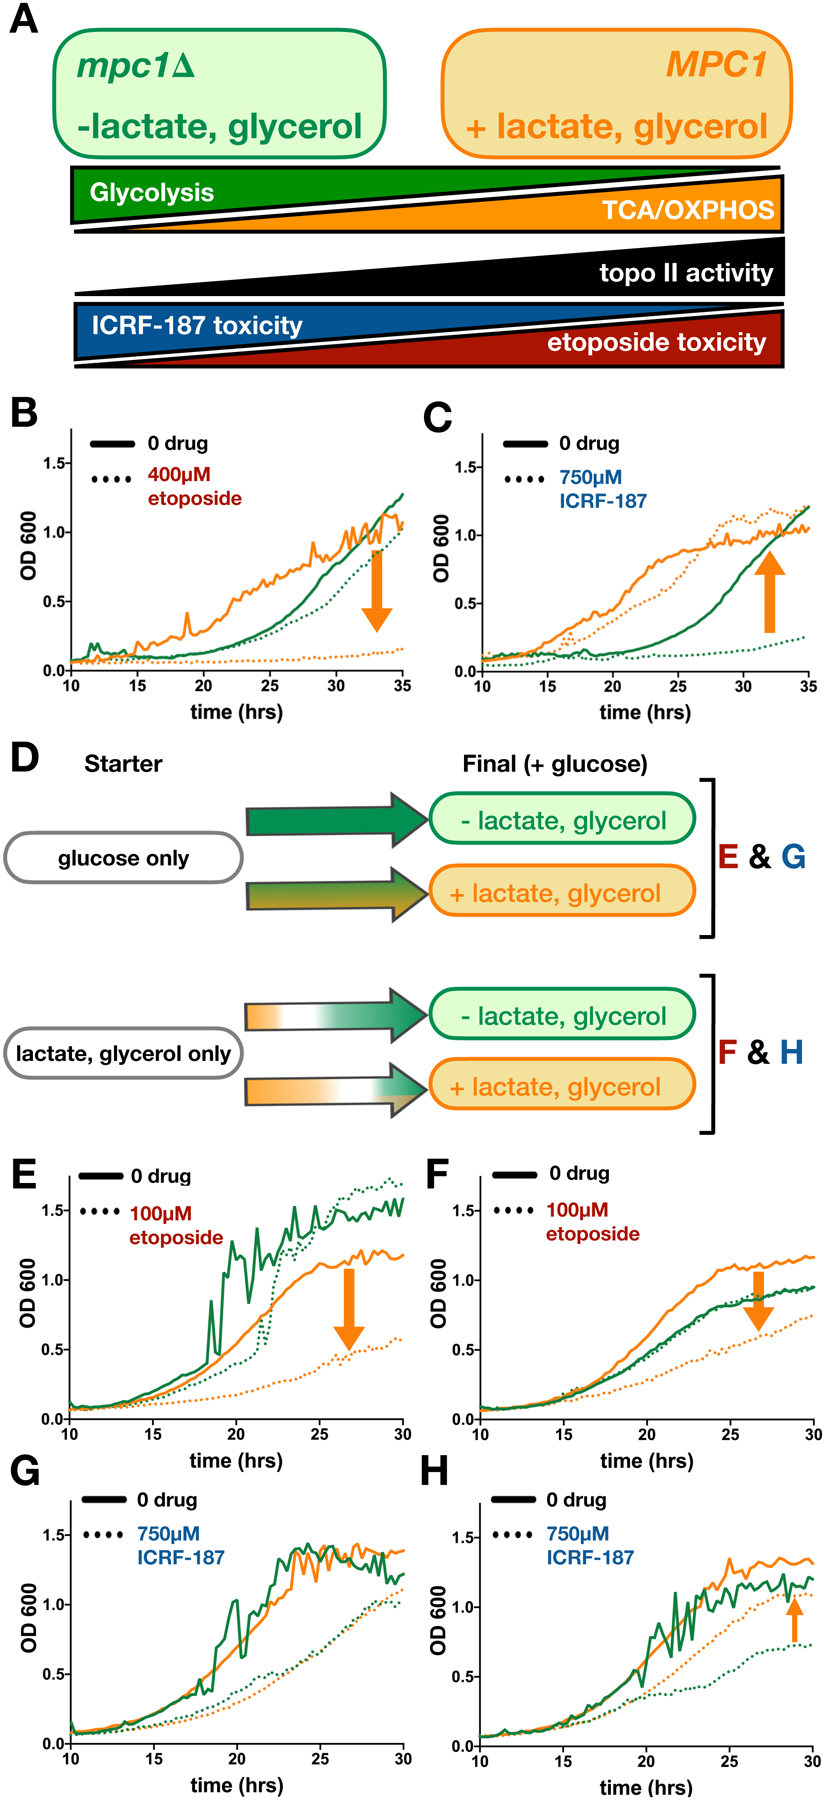
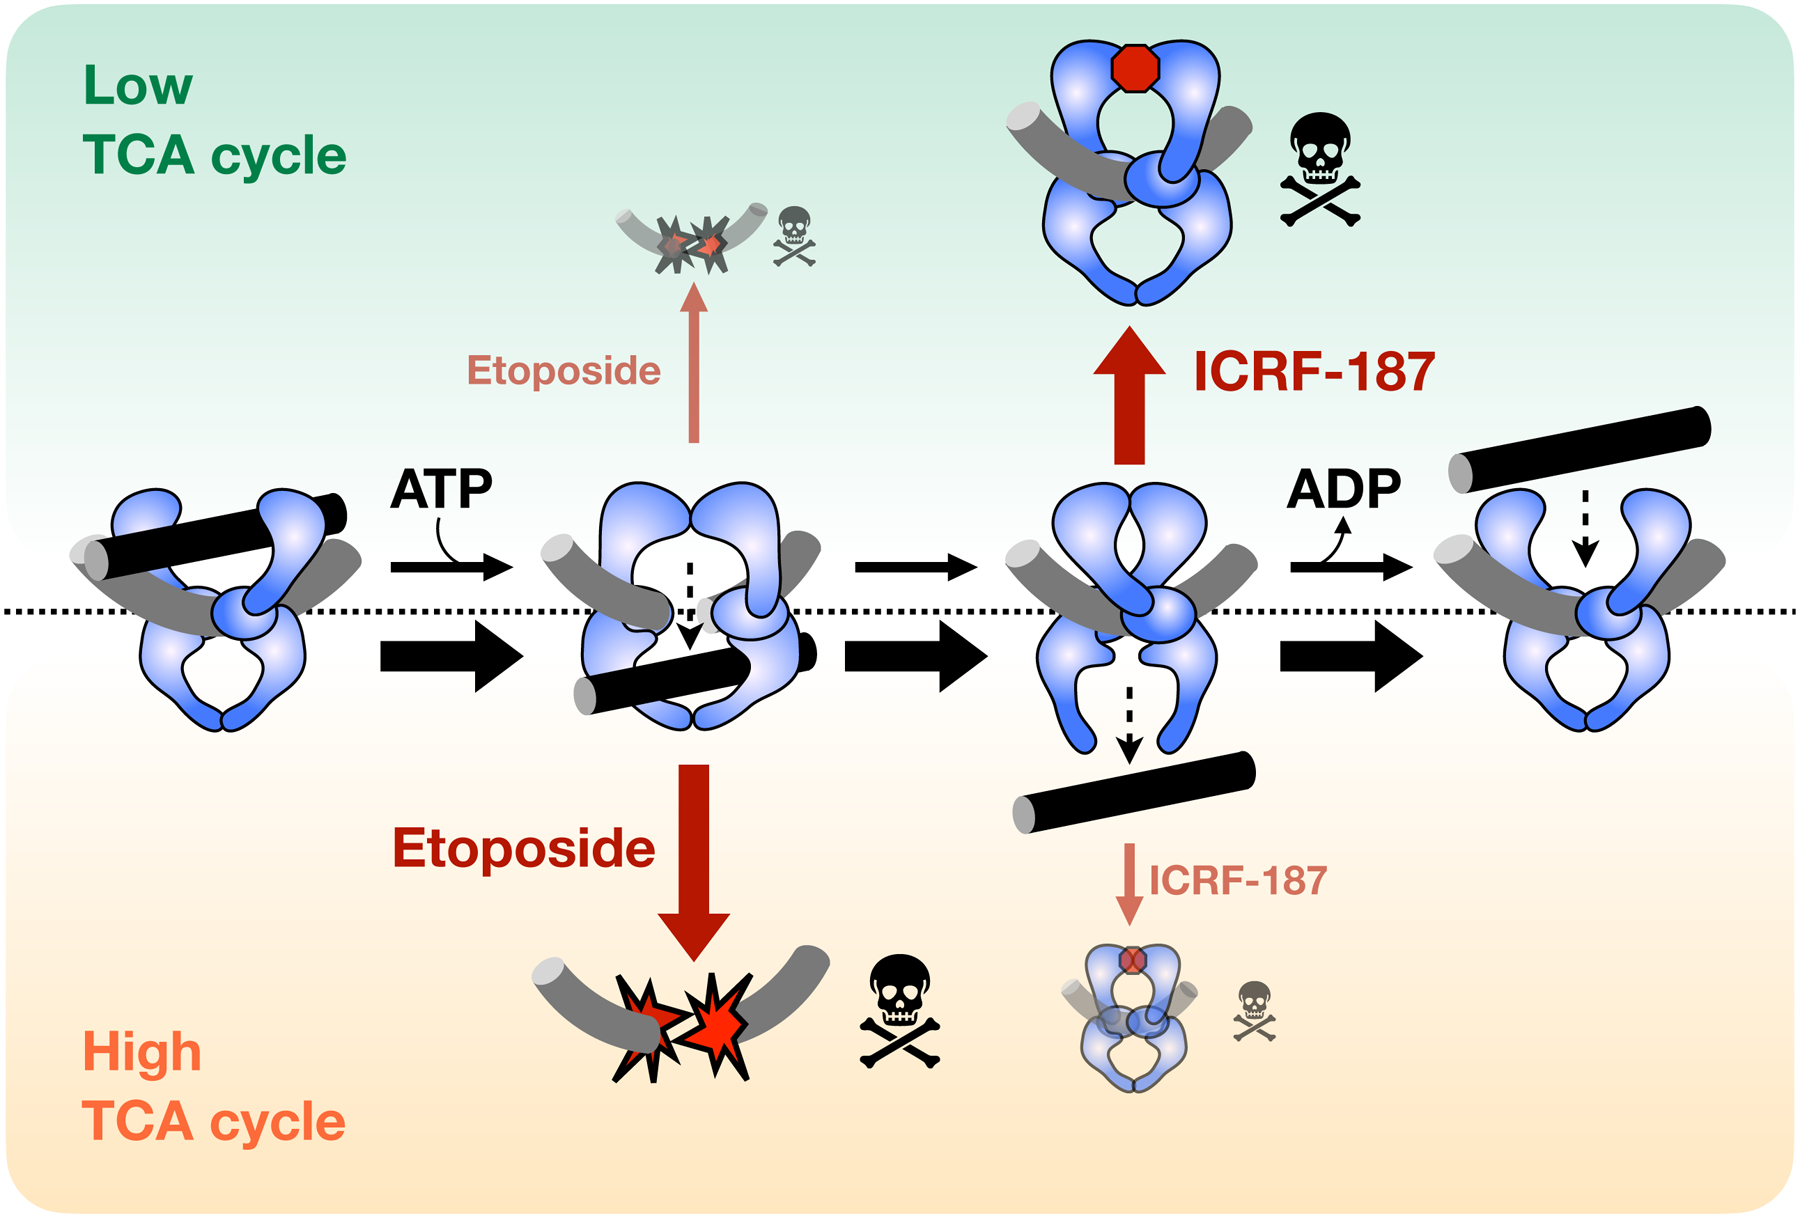
Topoisomerase II (topo II) is essential for disentangling newly replicated chromosomes. DNA unlinking involves the physical passage of one duplex through another and depends on the transient formation of double-stranded DNA breaks, a step exploited by frontline chemotherapeutics to kill cancer cells. Although anti-topo II drugs are efficacious, they also elicit cytotoxic side effects in normal cells; insights into how topo II is regulated in different cellular contexts is essential to improve their targeted use. Using chemical fractionation and mass spectrometry, we have discovered that topo II is subject to metabolic control through the TCA cycle. We show that TCA metabolites stimulate topo II activity in vitro and that levels of TCA flux modulate cellular sensitivity to anti-topo II drugs in vivo. Our work reveals an unanticipated connection between the control of DNA topology and cellular metabolism, a finding with ramifications for the clinical use of anti-topo II therapies.

Keywords: DNA topology; ICRF-187; TCA cycle; cancer; chemotherapy; dexrazoxane; etoposide; metabolism; topoisomerase.


Conflict of interest statement

Declaration of interests The authors declare no competing interests.

Figures

Figure 1.
Figure 1.. Crude metabolite extracts stimulate ScTop2 activity.
(A) Schematic of metabolite extraction procedure. (B-G) Representative gels and graphs of mean ± SD (n=3) for decatenation assays (B-D) and supercoil relaxation assays (E-G). Bands representing nicked minicircles and closed minicircles are indicated (B-C), as are bands representing unrelaxed substrate (SC), the relaxed topoisomer distribution, and nicked/open circle (OC) plasmids (E-F). No enzyme (‘-topo’) and no ATP (‘-ATP’) negative controls show the starting substrate. Metabolite extract and spent media were titrated from 0 to 50 mg/ml in 10 mg/ml increments.
Figure 2.
Figure 2.. Purification of stimulatory metabolites from crude metabolite extracts.
(A) Schematic of metabolite purification method. (B) Supercoil relaxation assay with metabolite samples before (‘Crude’) and after solid phase extraction (‘SPE’). Metabolite fractions were added from 0 to 40 mg/ml in two-fold increments. (C-D) Chromatograms of reverse phase (C) and normal phase (D) HPLC runs. The HPLC method is depicted by the purple line as indicated by the right y-axis. Red and green traces show absorbance values at 260 nm and 280 nm wavelengths respectively, as indicated on the left y-axis. (E-F) Supercoil relaxation assays of reverse-phase fractions (E) and normal-phase fractions (F), as indicated by the red brackets in (C) and (D). Fractions of interest are highlighted by corresponding colors in the chromatograms and relaxation assay gels. Lyophilized material from each fraction was titrated down from the maximum possible concentration in two-fold dilution steps.
Figure 3.
Figure 3.. Identification and structure activity relationship (SAR) analysis of stimulatory compounds
(A) Schematic depicting LC-MS/MS analysis of metabolite fractions to generate an ion peak-identification library. (B) Schematic depicting the individual analysis of metabolite fractions. (C) Example supercoil relaxation assays from testing an inactive and active pool of five candidate compounds. Each candidate compound was titrated from 0 to 20 mg/ml in two-fold steps. (D) Representative compounds with stimulatory activity. Succinic acid (tan) and glutaric acid (gold) motifs are highlighted. (E) TCA cycle metabolites. (F) Effects of dicarboxylic amino acids on topo II supercoil relaxation activity. Aspartate and glutamate were titration from 0 to 40 mM in 5 mM increments.
Figure 4.
Figure 4.. TCA cycle intermediates stimulate strand passage by topo II without significant effects on ATP hydrolysis.
(A-H) Stimulation of topo II decatenation activity (A-D) and supercoil relaxation activity (E-H) by citrate and oxaloacetate (OAA). Metabolites were titrated from 0 to 40mM in 5mM increments. Graphs (B, D, F, and H) represent mean ± SD of n=3–5. (I-J) Stimulation of ScTop2 decatenation (I) and relaxation (J) activity by TCA metabolites and glutamate (negative control). Stimulation values represent mean of n=3–6 independent experiments. (See also Figure S3). (K-L) Effects of TCA metabolites on ATP hydrolysis activity. Km (K) and Vmax (μmol ATP • min−1 • nmol topo II−1) (L) values were derived from 3 replicates. (See also Figure S6).
Figure 5.
Figure 5.. Stimulatory effect of TCA metabolites is eukaryotic specific.
Citrate and succinate were titrated from 0 to 40 mM in 5 mM increments and added to decatenation assays with HsTop2B (A-D), HsTop2A (E-H), and Ec topo IV (I-L), and to supercoil relaxation assays with Sc topo I. Graphs represent mean ± SD of n=3–5.
Figure 6.
Figure 6.. Changes in TCA cycle flux affect sensitivity of yeast to topo II inhibitors.
Green indicates conditions in which TCA flux is decreased. Orange indicates conditions in which TCA flux is increased. (A) Predicted correlation between ATP-generating metabolic pathways and topo II activity. Cells generate ATP by glycolysis (green) and oxidative phosphorylation (TCA/OXPHOS, orange). Our model predicts that topo II activity (black) is directly correlated to TCA metabolism; thus, etoposide toxicity (red) should directly correlate with TCA flux and ICRF-187 toxicity (blue) should inversely correlate with TCA flux. (B-C) Growth curves of mpc1Δ (green) compared to MPC1 (orange) in the presence of etoposide (B) and ICRF-187 (C). Orange arrows show the effect of increasing TCA flux (down indicates sensitization and up indicates rescue, see also Figures S7A–B). (D) Schematic of the effects of nutrient changes on flux through glycolysis and TCA cycle. Colored arrows show shifts in metabolism over time. Letters to the right of (D) indicate the nutrient conditions of the growth curves shown in (E-H). (E-H) Green lines show growth in glucose-only media and orange lines show growth in media with glucose and LG. Cultures were inoculated from starters grown in glucose-only media (E and G) or LG-only media (F and H). As before, orange arrows show the effect of increasing TCA flux on cytotoxicity of etoposide (E-F) and ICRF-187 (G-H). See also Figures S7F–I.
Figure 7.
Figure 7.. Schematic depicting how sensitivity to topo II-targeting drugs is influenced by metabolic state.
When TCA cycle flux is low (green) topo II strand passage activity is not stimulated. General catalytic inhibitors (e.g., ICRF-187) that decrease topo II activity are more effective in this state, as compared to a high TCA state (orange). By contrast, topo II poisons (e.g., etoposide) are more toxic in the high TCA state because elevated topo II activity leads to increased formation of DNA cleavage complexes.

References

    1. Almeida A, Bolaños JP, and Moncada S (2010). E3 ubiquitin ligase APC/C-Cdh1 accounts for the Warburg effect by linking glycolysis to cell proliferation. Proc. Natl. Acad. Sci. U. S. A 107, 738–741. - PMC - PubMed
    1. Anand R, Memisoglu G, and Haber J (2017). Cas9-mediated gene editing in Saccharomyces cerevisiae. Protoc. Exch 1–6.
    1. Astuti D, Latif F, Dallol A, Dahia PLM, Douglas F, George E, Sko F, Husebye ES, Eng C, and Maher ER (2001). Gene Mutations in Succinate Dehydrogenase Subunit SDHB Cause Susceptibility to Familial Pheochromocytoma and to Familial Paranganglioma. Am. J. Hum. Genet 69, 49–54. - PMC - PubMed
    1. Azarova AM, Lyu YL, Lin CP, Tsai YC, Lau JYN, Wang JC, and Liu LF (2007). Roles of DNA topoisomerase II isozymes in chemotherapy and secondary malignancies. Proc. Natl. Acad. Sci. U. S. A 104, 11014–11019. - PMC - PubMed
    1. Baksh SC, and Finley LWS (2020). Metabolic Coordination of Cell Fate by α-Ketoglutarate-Dependent Dioxygenases. Trends Cell Biol. 31, 24–36. - PMC - PubMed

Publication types

MeSH terms

LinkOut - more resources