. 2021 Nov 4;28(11):1922-1935.e5.
doi: 10.1016/j.stem.2021.08.007. Epub 2021 Sep 15.

Dietary suppression of MHC class II expression in intestinal epithelial cells enhances intestinal tumorigenesis

Affiliations

Dietary suppression of MHC class II expression in intestinal epithelial cells enhances intestinal tumorigenesis

Semir Beyaz et al. Cell Stem Cell. .

Abstract

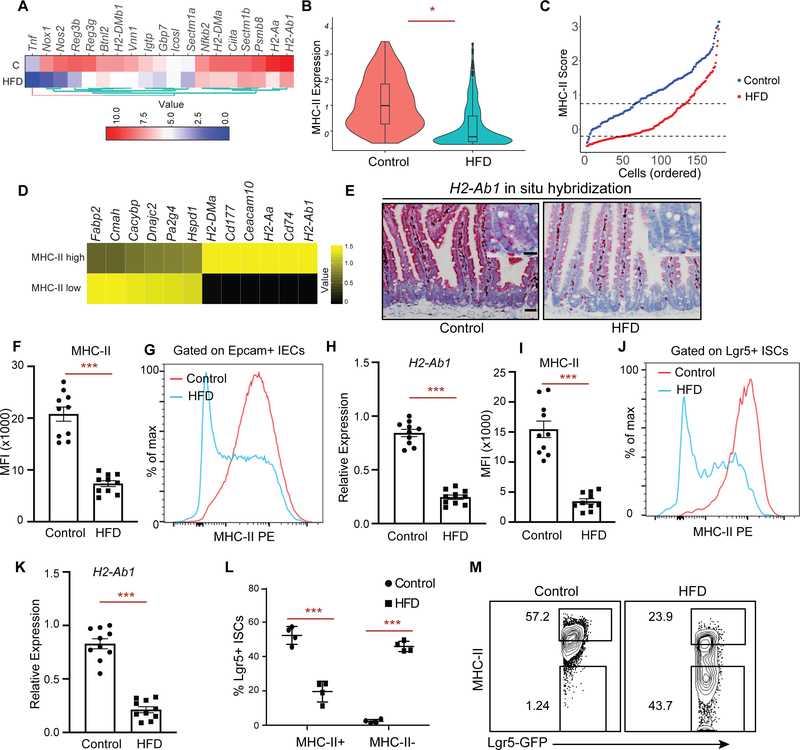
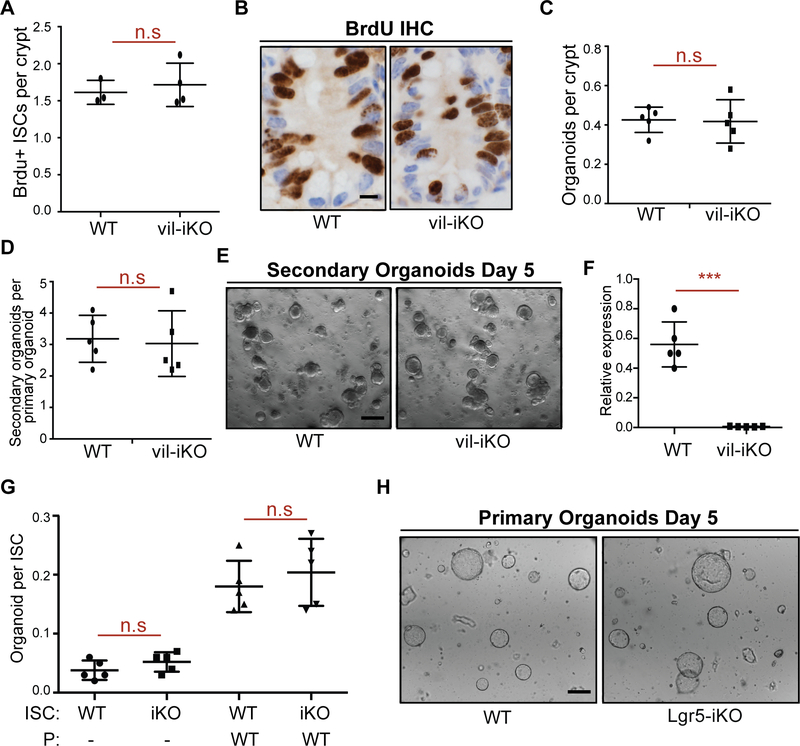
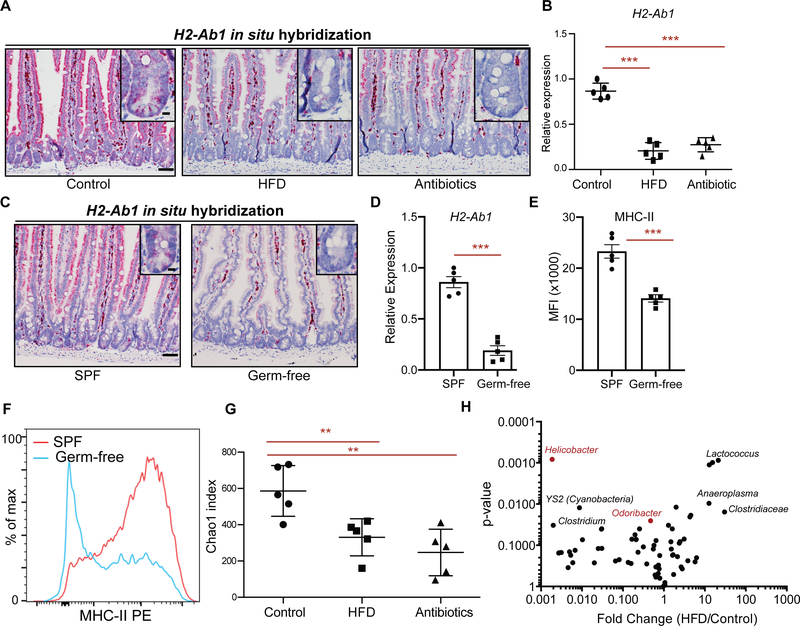
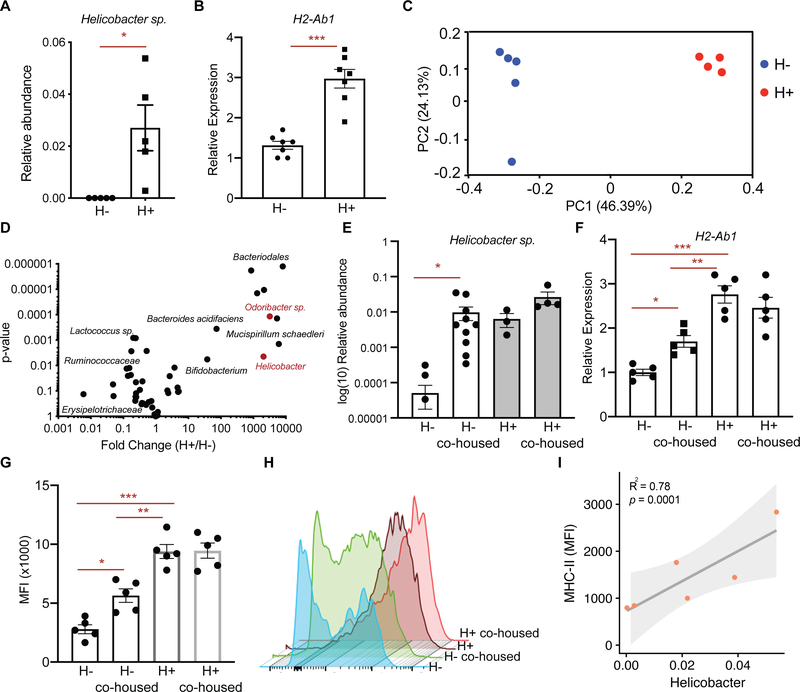
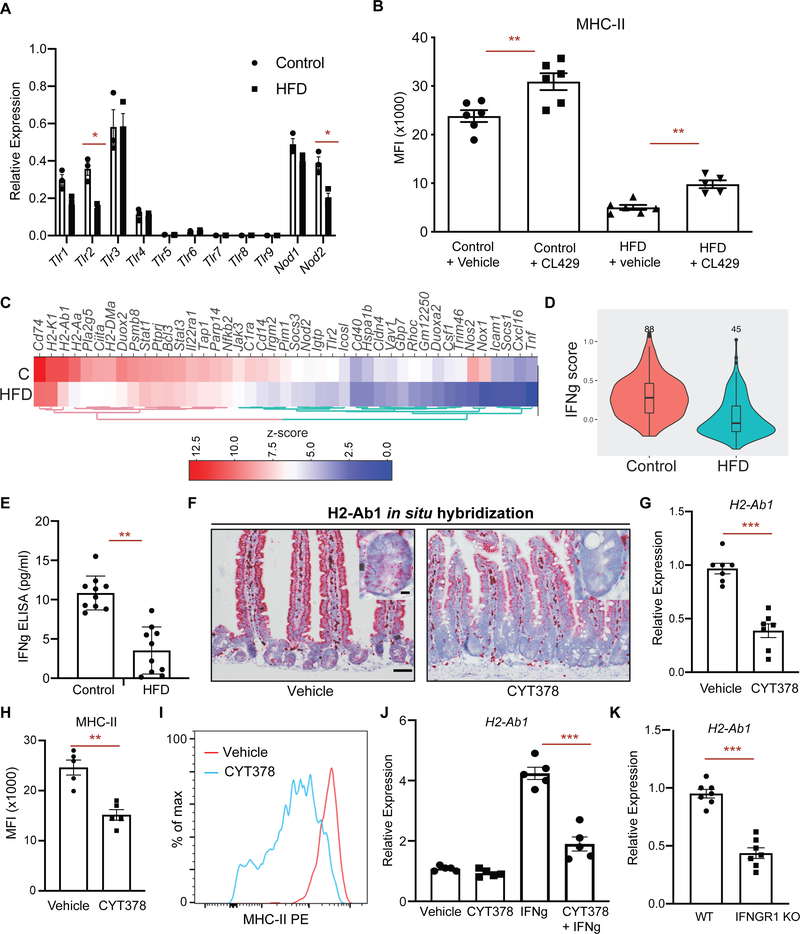
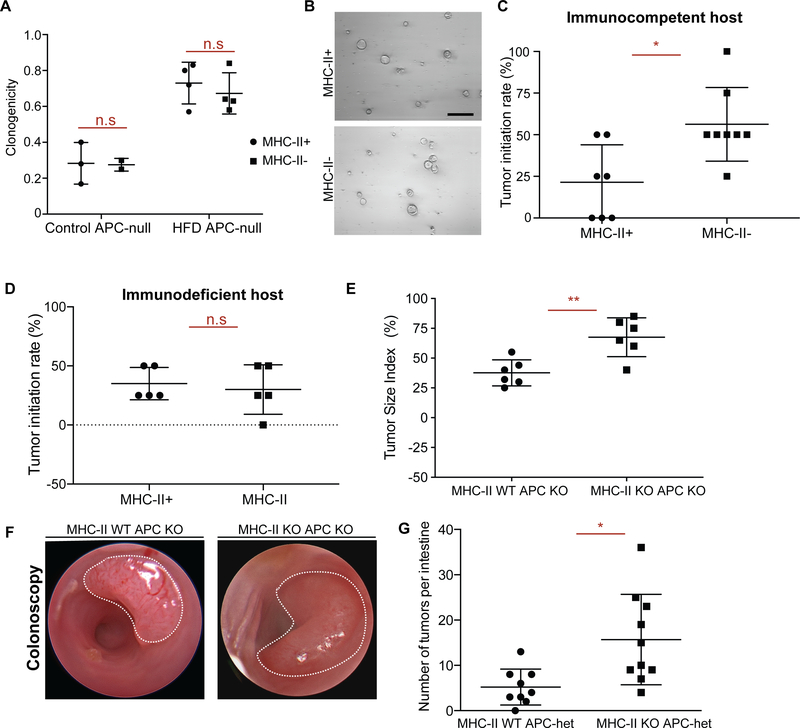
Little is known about how interactions of diet, intestinal stem cells (ISCs), and immune cells affect early-stage intestinal tumorigenesis. We show that a high-fat diet (HFD) reduces the expression of the major histocompatibility complex class II (MHC class II) genes in intestinal epithelial cells, including ISCs. This decline in epithelial MHC class II expression in a HFD correlates with reduced intestinal microbiome diversity. Microbial community transfer experiments suggest that epithelial MHC class II expression is regulated by intestinal flora. Mechanistically, pattern recognition receptor (PRR) and interferon-gamma (IFNγ) signaling regulates epithelial MHC class II expression. MHC class II-negative (MHC-II-) ISCs exhibit greater tumor-initiating capacity than their MHC class II-positive (MHC-II+) counterparts upon loss of the tumor suppressor Apc coupled with a HFD, suggesting a role for epithelial MHC class II-mediated immune surveillance in suppressing tumorigenesis. ISC-specific genetic ablation of MHC class II increases tumor burden cell autonomously. Thus, HFD perturbs a microbiome-stem cell-immune cell interaction that contributes to tumor initiation in the intestine.

Keywords: MHC-II; antigen presentation; cancer; diet; high-fat diet; intestinal stem cells; microbiome; obesity.


Conflict of interest statement

Declaration of interests The authors declare no competing financial interests. S.H.O. serves as an advisory board member for Cell Stem Cell. S.B. received research funding from Elstar Therapeutics and Revitope Oncology for research that is not related to this study.

Figures

Figure 1 |
Figure 1 |. High Fat Diet reduces MHC-II expression on Lgr5+ intestinal stem cells (ISCs).
A. A heat map of downregulated genes assessed by bulk RNA-seq in Lgr5-GFPhi intestinal stem cells (Lgr5+ ISCs) isolated from long-term high fat diet (HFD)-fed mice compared to control mice (n=2). Scale represents computed z-scores of log10 expression values. B. Violin plots demonstrating MHC-II expression in single Lgr5+ ISCs isolated from control (n=171 cells, 2 independent experiments) or HFD mice by single cell RNA-seq (scRNA-seq) (n=144 cells, 2 independent experiments). C. Control (blue) and HFD (red) Lgr5+ ISCs ranked according to their expression of MHC II pathway genes (y-axis). Dashed lines correspond to y-intercepets of −0.2 and 0.75, which are the 25th and 75th percentile of scores in HFD cells, used to define MHC-II low (score < −0.2) and MHC-II high (score > 0.75) HFD cells. In contrast, these values correspond to 1st and 35th percentile of scores in control cells. D. Heatmap showing differentially expressed (DE) genes (rows) between MHC-II low and MHC-II high HFD ISCs as defined in panel C. Scale represents computed z-scores of log10 expression values. E. Single-molecule in situ hybridization of MHC-II (H2-Ab1) in control and HFD mice (n=5). F, G. Mean fluorescence intensity (MFI) of MHC-II in Epcam+ intestinal epithelial cells (IECs) from crypts of control and HFD mice (F, n=10 mice, mean ± s.e.m.). Representative flow cytometry histogram plots of MHC-II expression in Epcam+ IECs (G). H. Relative expression of MHC-II (H2-Ab1) in Epcam+ IECs isolated from crypts of control and HFD mice (n=10 mice, mean ± s.e.m.). I, J. Mean fluorescence intensity (MFI) of MHC-II in Lgr5+ ISCs from crypts of control and HFD mice (I, n=10 mice, mean ± s.e.m.). Representative flow cytometry histogram plots of MHC-II expression in Epcam+ cells (J). K. Relative expression of MHC-II (H2-Ab1) in Lgr5+ ISCs isolated from crypts of control and HFD mice (n=10 mice, mean ± s.e.m.). L, M. Frequency of MHC-II+ and MHC-II− Lgr5+ ISCs in control and HFD mice by flow cytometry (L, n=4, mean ± s.d). Representative flow cytometry plots of MHC-II in control and HFD ISCs (M). *P < 0.05, **P < 0.01, ***P < 0.001 (Student’s t-tests). Scale bars, 50 μm (E) and 20 μm (E, inset). See also Figure S1 and Table S1.
Figure 2 |
Figure 2 |. Intestine-specific deletion of MHC-II does not alter the organoid forming capacity of ISCs.
A, B. Number of bromodeoxyuridine (BrdU)+ crypt base columnar cells after a 4-hour pulse in MHC-IIL/L; Villin-CreERT2 (vil-iKO) mice after tamoxifen administration (WT: n=3, vil-iKO: n=4, mean ± s.d). Representative images of BrdU immunostain in proximal small intestinal crypts (B). C-E Organoid-initiating capacity of WT and vil-iKO crypts (C, n=5, mean ± s.d). Number of secondary organoids per dissociated crypt-derived primary organoid (D, n=5, mean ± s.d). Representative images of day-5 WT and vil-iKO primary organoids (E). F. Relative expression of MHC-II in dissociated WT and vil-iKO primary organoids at day 5 (n=5, mean ± s.d). G, H. Organoid-initiating capacity of ISCs from WT and MHC-IIL/L; Lgr5-EGFP-IRES-CreERT2 (Lgr5-iKO) mice with and without Paneth cells (P) from WT mice (n=5, mean ± s.d). Representative images of organoids derived from WT and Lgr5-iKO ISCs co-cultured with WT Paneth cells five days after seeding (H). n.s.: not significant, ***P < 0.001 (Student’s t-tests). Scale bars, 100 μm (E, H) and 20 μm (B). See also Figure S2
Figure 3 |
Figure 3 |. Intestinal microbiome regulates epithelial MHC-II expression
A. In situ hybridization for H2-Ab1 in control, HFD, and antibiotic-treated mice in proximal small intestine (n=5 mice). B. Relative expression of MHC-II in Lgr5+ ISCs from control, HFD, and antibiotic-treated mice (n=5, mean ± s.d). C. Single-molecule in situ hybridization of MHC-II (H2-Ab1) in specific pathogen-free (SPF) and germ-free mice (n=5 mice). D. Relative expression of MHC-II (H2-Ab1) in Lgr5+ ISCs from SPF and germ-free mice (n=5, mean ± s.e.m.). E, F. Mean fluorescence intensity (MFI) of MHC-II in Lgr5+ ISCs from SPF and germ-free mice (E, n=5, mean ± s.e.m.). Representative flow cytometry histogram plots of MHC-II expression in Lgr5+ ISCs (F). G. Chao1 index of microbial diversity in Control, HFD, and mice treated with antibiotics for 3 months (n=5, mean ± s.d). H. Volcano plot demonstrating significantly enriched and depleted microbial species in HFD versus control mice (n=5). **P < 0.01, ***P < 0.001 (Student’s t-tests). Scale bars, 100 μm (A, C) and 20 μm (A, C, insets). See also Figure S2
Figure 4 |
Figure 4 |. Helicobacter colonization correlates with epithelial MHC-II expression
A. Relative abundance of Helicobacter spp. in mice housed in clean (H−) room and dirty (H+) room (n=5 mice, mean ± s.e.m.). B. Relative expression of MHC-II (H2-Ab1) in Epcam+ cells isolated from crypts of mice housed in H− room or H+ room (n=7, mean ± s.e.m.). C. Principal coordinate analysis (PCoA) of microbial composition in feces of mice housed in H− room or H+ room (n=5). D. Volcano plot demonstrating significantly enriched and depleted microbial species in mice housed in H+ room versus H− room (n=5). E. Relative abundance of Helicobacter sp. in mice housed either in H− room (n=10), H+ room (n=3), or after co-housing H− mice (n=10) with H+ mice (n=4) in H+ room (mean ± s.e.m.). F. Relative expression of MHC-II (H2-Ab1) in Epcam+ cells isolated from crypts of mice housed either in H− room, H+ room, or after co-housing H− mice with H+ mice in H+ room (n=5, ANOVA). G, H. Mean fluorescence intensity (MFI) of MHC-II in Epcam+ cells isolated from crypts of mice housed either in H− room, H+ room, or after co-housing H− mice with H+ mice in H+ room (G, n=5, mean ± s.e.m., ANOVA). Representative flow cytometry histogram plots of MHC-II expression in Lgr5+ ISCs (H). I. Correlation of MHC-II expression with Helicobacter abundance in germ-free mice that were transplanted with fecal content from H− and H+ mice. Unless otherwise indicated *P < 0.05, **P < 0.01, ***P < 0.001 (Student’s t-tests). See also Figure S2 and Table S2.
Figure 5 |
Figure 5 |. PRR and IFN γ signaling regulate epithelial MHC-II expression
A. Relative expression of pattern recognition receptors (PRR) in control and HFD ISCs (n=3). B. Mean fluorescence intensity (MFI) of MHC-II in Lgr5+ ISCs from vehicle- and TLR2/NOD2 agonist CL429− treated control and HFD mice (n=6 mice, mean ± s.e.m.). C. A heat map of expression levels of IFN γ-induced genes between HFD and control Lgr5+ ISCs by bulk RNA-seq (n=2). Scale represents computed z-scores of log10 expression values. D. Violin plots demonstrating the expression levels of IFN γ-induced genes in control and HFD Lgr5+ ISCs by scRNA-seq. E. IFN γ levels in the intestines of control and HFD mice as measured by ELISA (n=10, mean ± s.e.m.). F. In situ hybridization for H2-Ab1 in vehicle- and JAK1/2 & TBK1/IKKε inhibitor (CYT387)-treated mice in small intestine (n=3). G. Relative expression of MHC-II (H2-Ab1) in Lgr5+ ISCs from vehicle- and CYT387-treated mice (n=7, mean ± s.e.m.). H, I. Mean fluorescence intensity (MFI) of MHC-II in Lgr5+ ISCs from vehicle- and CYT387-treated mice (H, n=5, mean ± s.e.m.). Representative flow cytometry histogram plots of MHC-II expression in Lgr5+ ISCs (I). J. Relative expression of MHC-II (H2-Ab1) in intestinal organoids-treated with or without CYT387 and/or IFN γ (n=5, mean ± s.e.m.). K. Relative expression of MHC-II (H2-Ab1) in Epcam+ cells isolated from crypts of control or IFNGR1 KO (n=5, mean ± s.e.m.). *P < 0.05, **P < 0.01, ***P < 0.001 (Student’s t-tests). See also Figure S3 and Figure S4
Figure 6 |
Figure 6 |. Loss of MHC-II in premalignant ISCs increases tumor initiation.
A, B. Organoid-initiating capacity of control and HFD MHC-II+ and MHC-II− Apcnull Lgr5+ ISCs at day 5 (control MHC-II+, n=3, control MHC-II-, n=3, HFD MHC-II+, n=4, HFD MHC-II-, n=4, mean ± s.d.). Representative images of HFD MHC-II+ and MHC-II− Apcnull organoids at day 5 (B). C. Tumor initiation rate of orthotopically transplanted MHC-II+ and MHC-II− Apcnull Lgr5+ ISCs from HFD mice into immunocompetent syngeneic hosts (n=8). D. Tumor initiation rate of orthotopically transplanted MHC-II+ and MHC-II− Apcnull Lgr5+ ISCs from HFD mice into immunodeficient (Rag2 KO) hosts (n=8). E, F. Tumor size index in distal colon of mice that received tamoxifen through endoscopy guided tamoxifen injection to induce tumor formation upon loss of APC (E, n=6, MHC-II WT APC KO: villin-Cre-ERT2 APCL/L, MHC-IIL/+, MHC-II KO APC KO: villin-Cre-ERT2 APCL/L, MHC-IIL/L). Representative optical colonoscopy images of tumors (F). G. Number of tumors per small intestine in Lgr5-CreERT2 MHC-IIL/+, APCL/+ (n=9, MHC-II WT APC-het) and Lgr5-CreERT2 MHC-IIL/L, APCL/+ (n=9, MHC-II KO APC KO) mice 5 months post tamoxifen injection. Unless otherwise indicated, data are mean ± s.e.m from n independent experiments; n.s.: not significant, *P < 0.05, **P < 0.01 (Student’s t-tests). See also Figure S5 and Figure S6

Comment in

References

    1. Abreu MT (2010). Toll-like receptor signalling in the intestinal epithelium: how bacterial recognition shapes intestinal function. Nat Rev Immunol 10, 131–144. - PubMed
    1. Agudo J, Park ES, Rose SA, Alibo E, Sweeney R, Dhainaut M, Kobayashi KS, Sachidanandam R, Baccarini A, Merad M, et al. (2018). Quiescent Tissue Stem Cells Evade Immune Surveillance. Immunity 48, 271–285 e275. - PMC - PubMed
    1. Ali N, Zirak B, Rodriguez RS, Pauli ML, Truong HA, Lai K, Ahn R, Corbin K, Lowe MM, Scharschmidt TC, et al. (2017). Regulatory T Cells in Skin Facilitate Epithelial Stem Cell Differentiation. Cell 169, 1119–1129 e1111. - PMC - PubMed
    1. Anders S, and Huber W (2010). Differential expression analysis for sequence count data. Genome biology 11, R106. - PMC - PubMed
    1. Barker N, Ridgway RA, van Es JH, van de Wetering M, Begthel H, van den Born M, Danenberg E, Clarke AR, Sansom OJ, and Clevers H (2009). Crypt stem cells as the cells-of-origin of intestinal cancer. Nature 457, 608–611. - PubMed

Publication types

Substances