. 2021 Oct 25;56(20):2808-2825.e10.
doi: 10.1016/j.devcel.2021.08.018. Epub 2021 Sep 15.

Cooperation between melanoma cell states promotes metastasis through heterotypic cluster formation

Affiliations

Cooperation between melanoma cell states promotes metastasis through heterotypic cluster formation

Nathaniel R Campbell et al. Dev Cell. .

Abstract

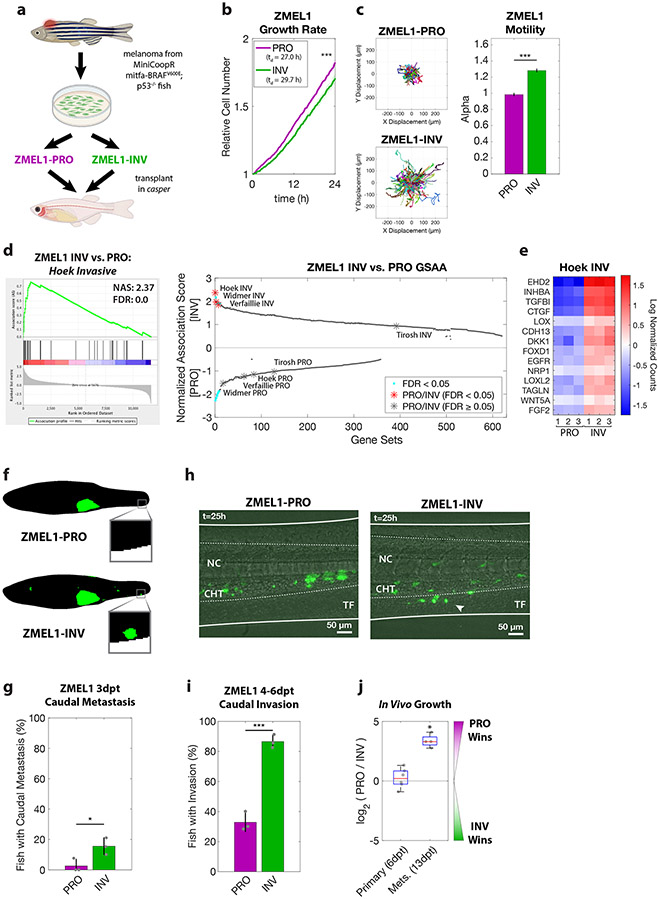
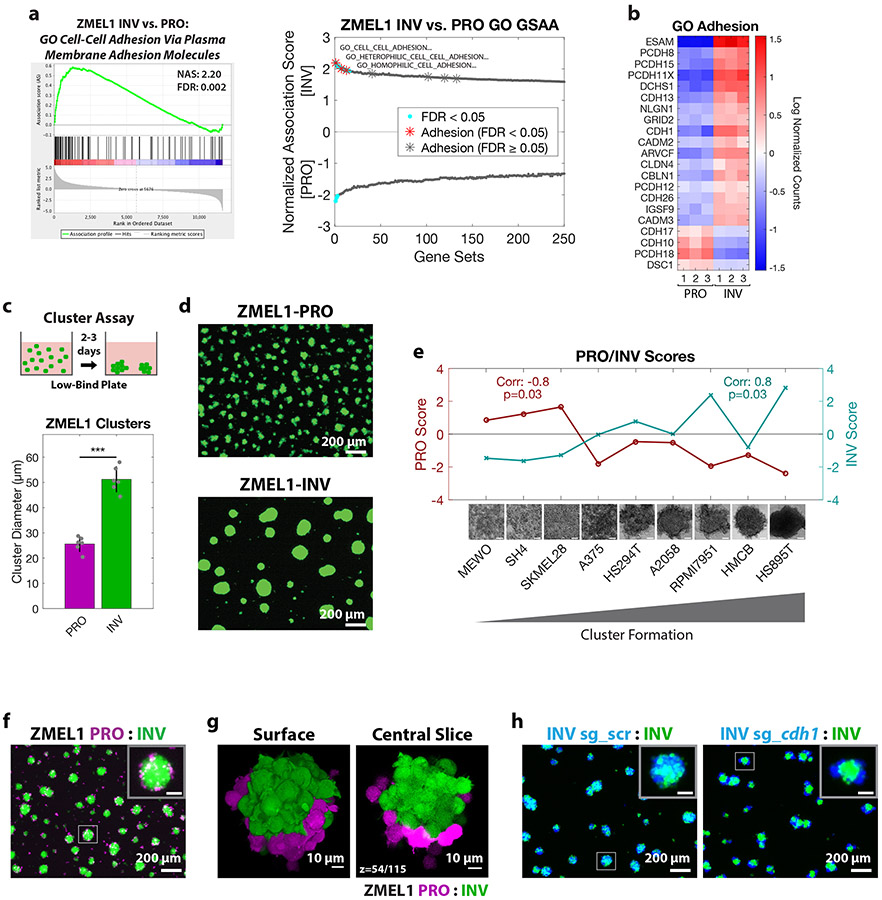
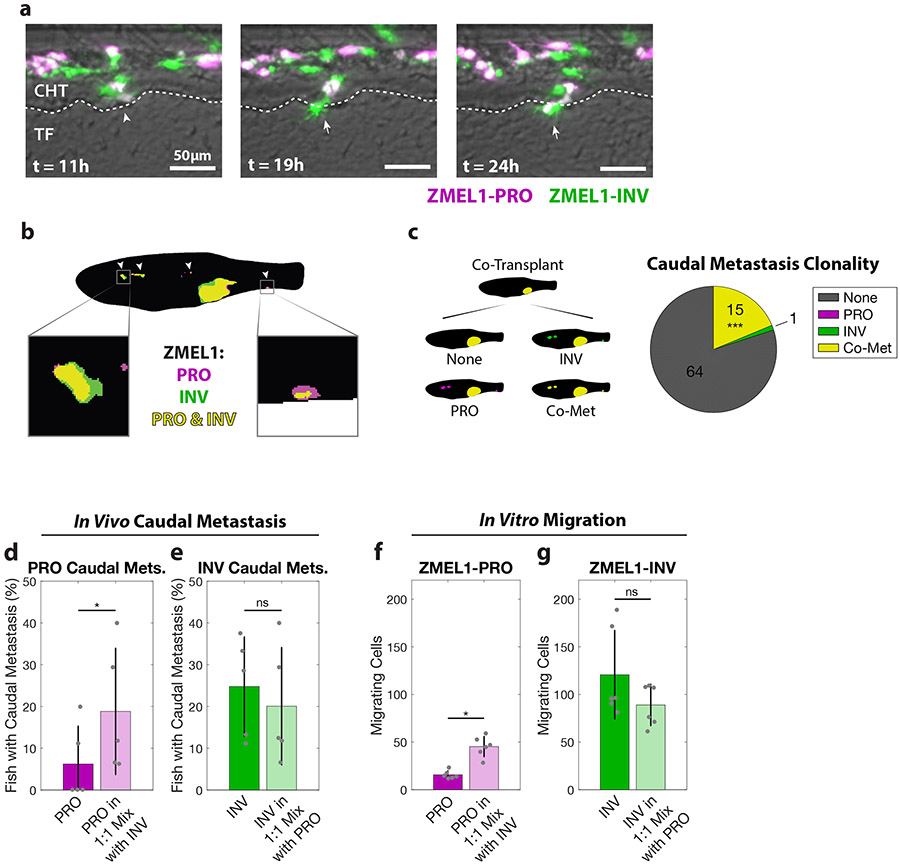
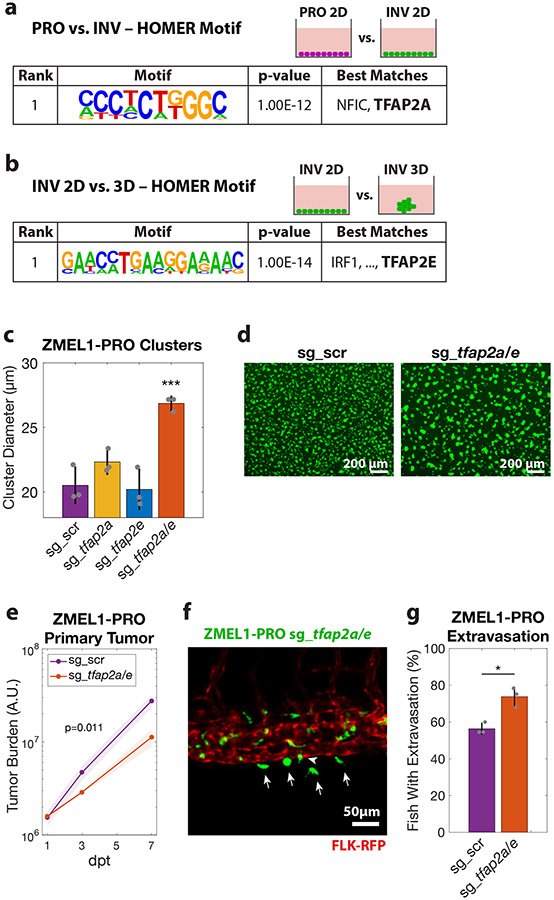
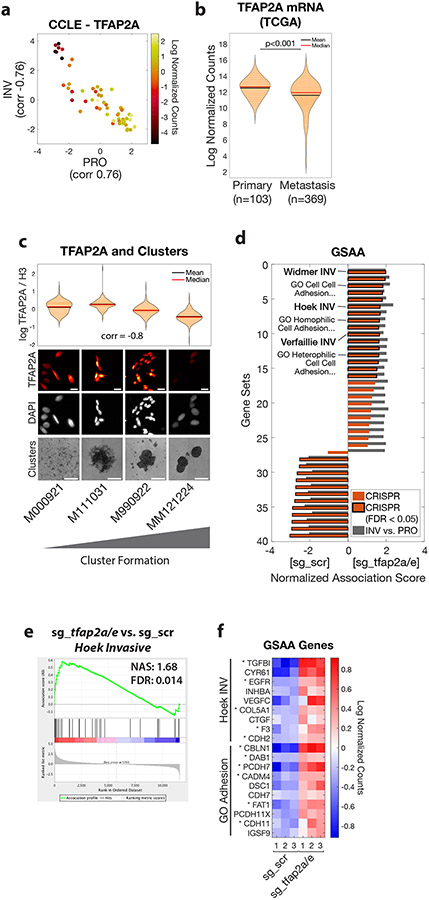
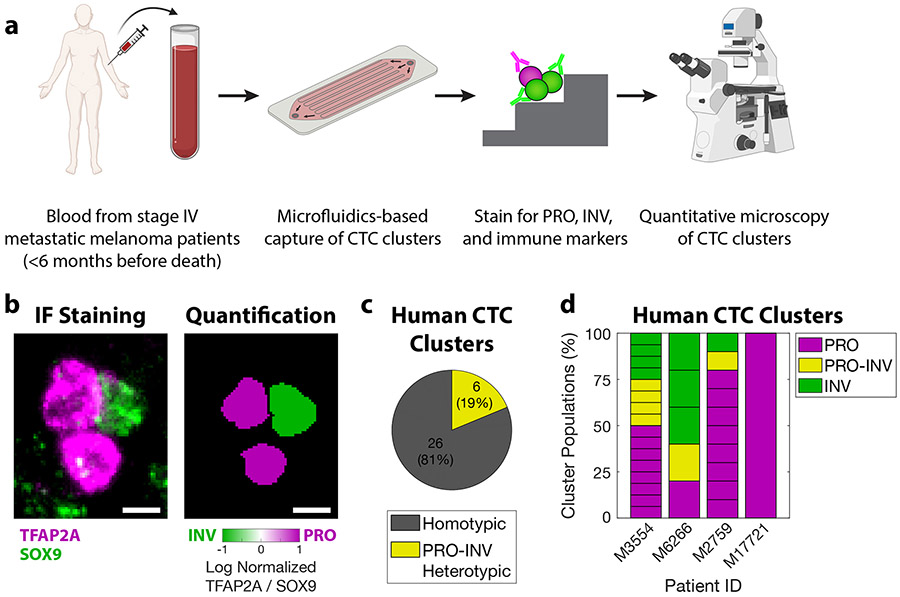
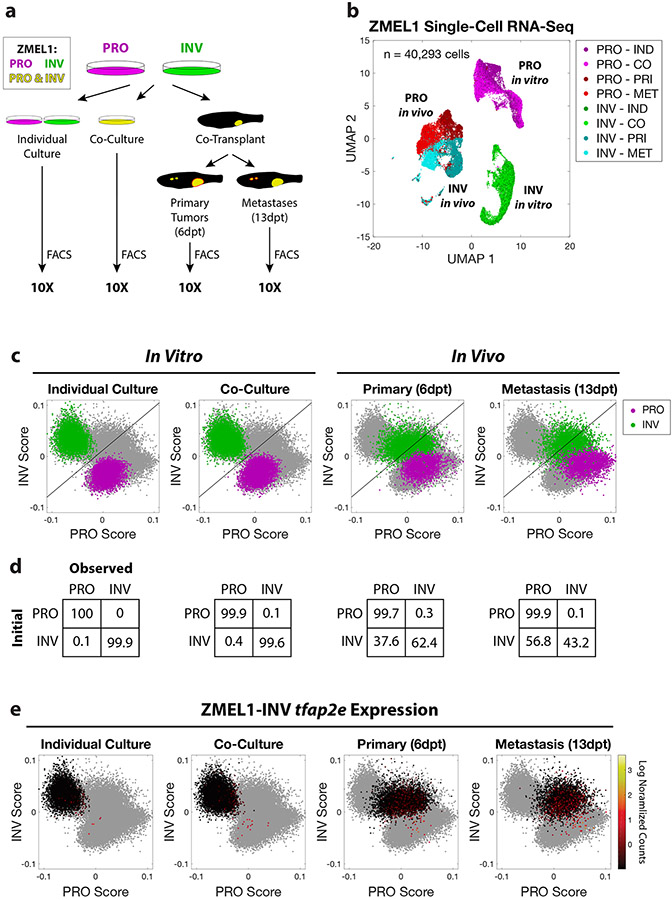
Melanomas can have multiple coexisting cell states, including proliferative (PRO) versus invasive (INV) subpopulations that represent a "go or grow" trade-off; however, how these populations interact is poorly understood. Using a combination of zebrafish modeling and analysis of patient samples, we show that INV and PRO cells form spatially structured heterotypic clusters and cooperate in the seeding of metastasis, maintaining cell state heterogeneity. INV cells adhere tightly to each other and form clusters with a rim of PRO cells. Intravital imaging demonstrated cooperation in which INV cells facilitate dissemination of less metastatic PRO cells. We identified the TFAP2 neural crest transcription factor as a master regulator of clustering and PRO/INV states. Isolation of clusters from patients with metastatic melanoma revealed a subset with heterotypic PRO-INV clusters. Our data suggest a framework for the co-existence of these two divergent cell populations, in which heterotypic clusters promote metastasis via cell-cell cooperation.

Keywords: TFAP2; circulating tumor cell cluster; cluster; cooperation; melanoma; metastasis; zebrafish.


Conflict of interest statement

Declaration of interests M.R.M. receives research funding from GRAIL. D.J.A. is a paid consultant for Microbiotica and receives researching funding from Astra Zeneca and OpenTargets. M.P.L. receives research funding from Roche and Novartis. N.A. is a paid consultant for companies with an interest in liquid biopsy. R.M.W. is a paid consultant to N-of-One Therapeutics, a subsidiary of Qiagen. R.M.W. is on the Scientific Advisory Board of Consano but receives no income for this. R.M.W. receives royalty payments for the use of the casper line from Carolina Biologicals.

Figures

Figure 1.
Figure 1.. PRO and INV coexist in zebrafish melanoma, with INV cells metastasizing more frequently due to increased extravasation.
a. Proliferative (PRO) and invasive (INV) subpopulations were identified from the ZMEL1 zebrafish melanoma cell line, which was originally isolated from a transgenic zebrafish and can be transplanted into transparent casper zebrafish. b-c. Tracking of individual cells by time-lapse microscopy (both p<0.001 by linear regression, N=4 independent experiments). b. Growth curves (mean ± SE of mean, smoothed with moving window average of 5 time points) and doubling time (mean [95% CI]: 27.0 h [26.9, 27.1] vs. 29.7 h [29.6, 29.9] for ZMEL1-PRO and -INV, respectively). c. (left) Representative displacements of 500 tracks, and (right) model estimates ± 95% CI for alpha, the slope of the log-log plot of mean squared displacement vs. lag time (tau) for each ZMEL1-PRO and -INV. Larger alpha indicates more persistent motion, with α=1 for diffusive and α=2 for projectile motion. d. (left) The INV signature (Hoek et al., 2006) was the top gene set by Gene Set Association Analysis (GSAA) of ZMEL1-INV vs. -PRO RNA-seq. (Right) Dual waterfall plot of GSAA ranked by false discovery rate (FDR). Literature PRO/INV gene sets are indicated with an asterisk and colored according to FDR. e. Heatmap of genes in Hoek INV signature that are differentially expressed between ZMEL1-PRO and -INV (log2 fold change cutoff ± 1.5, padj < 0.05). Human ortholog gene names are used for clarity (see Figure S1e for zebrafish gene names). f. Segmentation of representative images of ZMEL1-PRO and -INV tumors and distant metastases (e.g. to caudal region [box]) at 3 days post-transplant (3dpt). Original images shown in Figure S1e. g. Quantification of caudal metastases seeded by ZMEL1 populations at 3 dpt (OR [95% CI]: 11.62 [1.43, 94.53]; p=0.022 by logistic regression; N=3 independent experiments with PRO/INV 10/10, 31/33, and 13/13 fish per group, respectively; n=110 fish total; plot shows mean ± SD). h. Representative composite images at 1 dpt from time lapse confocal microscopy of ZMEL1 cells transplanted intravenously in larval zebrafish. Arrowhead indicates group of cells invading from the notochord (NC) and caudal hematopoietic tissue (CHT) into the tail fin mesenchyme (TF). Images are representative of n=13 fish per cell type. See Video S1 for full time lapse. i. Quantification of caudal tissue invasion by imaging at 4-6dpt (N=3 independent experiments with PRO/INV 23/23, 21/21, and 19/23 fish per group, respectively; OR [95% CI]: 13.58 [5.56, 33.18]; p<0.001 by logistic regression, plot shows mean ± SD). j. Relative number of ZMEL1-PRO and -INV cells isolated and quantified by flow cytometry from primary tumors and metastases of fish transplanted with a 1:1 mixture of ZMEL1-PRO and -INV (primary tumors from n=6 fish; metastases from n=4 fish; p= 0.51 and p=0.031, respectively, by one-sample two-sided t-test with Bonferroni correction). See also Figure S1, Tables S1,S5,S6, and Video S1.
Figure 2.
Figure 2.. Cluster formation by INV state drives spatial patterning of melanoma clusters.
a. (left) Plot of top Gene Ontology (GO) gene set by GSAA for ZMEL1-INV vs. -PRO RNA-seq. (right) Dual waterfall plot of top/bottom 250 gene sets from GO analysis (for full plot see Figure S2a). Adhesion GO gene sets are indicated with an asterisk and colored according to false discovery rate (FDR) b. Heatmap of genes in adhesion GO gene sets (FDR < 0.05, n=3) that are differentially expressed between ZMEL1-PRO and -INV (log2 fold change cutoff ± 1.5, padj < 0.05). Human ortholog gene names are used for clarity (see Figure S2b-c for absolute expression and zebrafish gene names). c. (top) Schematic of assay and (bottom) quantification of cluster formation in low-bind plates after 2 days (N=6 independent experiments, p<0.001 by two-sided t-test, plot shows mean ± SD). d. Representative images of clusters formed after 3 days. e. Human melanoma cell lines ranked by cluster forming ability (left to right: low to high) with PRO/INV gene expression scores (Hoek et al., 2006) (Spearman correlation and Bonferroni-corrected p-values shown, scale bar 100μm). f. Co-clusters of 1:1 mixture of ZMEL1-PRO and -INV (inset scale 50 μm). g. (left) 3D opacity rendering and (right) central slice (slice 54 of 115) of confocal imaging of co-cluster of ZMEL1-PRO and ZMEL1-INV. h. Co-clusters of 1:1 mixture of ZMEL1-INV and ZMEL1-INV with either control (sg_scr) or cdh1 (sg_cdh1) sgRNA (inset scale 50 μm). f-h are composite images. See also Figure S2, Tables S1,S5,S6, and Videos S2,S3.
Figure 3.
Figure 3.. PRO and INV cooperate in metastasis via co-extravasation.
a. In the first 24 hours after intravenous transplant of ZMEL1-PRO and -INV, a PRO-INV mixed cluster (left, arrowhead) extravasated from the caudal hematopoietic tissue (CHT) into the tail fin mesenchyme (TF)—with ZMEL1-INV leading (middle, arrow) and ZMEL1-PRO following (right, arrow). Composite images shown. b. Segmented representative image of adult zebrafish with orthotopic transplant of 1:1 mixture of ZMEL1-PRO and -INV. Arrowheads indicate polyclonal metastases, including to the kidney and caudal regions (left and right boxes, respectively). Original image shown in Figure S3b. c. Number of fish co-transplanted with a 1:1 mixture of ZMEL1-PRO and -INV that have no caudal metastases (None), caudal metastases comprised of exclusively PRO or INV, or caudal metastases formed by PRO-INV co-metastasis (Co-Met) (N=5 independent experiments with 17, 15, 16, 15, and 17 fish each; 80 fish total; p<0.001 by Mantel-Haenszel’s test for null hypothesis of no interaction). d. Percentage of fish with ZMEL1-PRO caudal metastasis 3 dpt following orthotopic transplant of ZMEL1-PRO or a 1:1 mixture of ZMEL1 PRO:INV (OR [95% CI]: 3.31 [1.10, 9.96]; p=0.033 by logistic regression). e. Proportion of fish with ZMEL1-INV caudal metastasis 3 dpt following orthotopic transplant of ZMEL1-INV or a 1:1 mixture of ZMEL1 PRO:INV (OR [95% CI]: 1.32 [0.61, 2.88]; p=0.49 by logistic regression). For c-e: N=5 independent experiments with PRO/MIX/INV 18/17/18, 13/15/14, 15/16/15, 12/15/15, and 15/17/16 fish per group, respectively; 231 fish total; plots show mean ± SD. f. Number of ZMEL1-PRO cells in Boyden Chamber assay migrating per 20X field alone or mixed with ZMEL1-INV (p=0.042 by linear regression). g. Number of ZMEL1-INV cells in Boyden Chamber assay migrating per 20X field alone or mixed with ZMEL1-PRO (p=0.91 by linear regression). For f-g: N=3 independent experiments for each EGFP and tdTomato labeling; plots show mean ± SD. See also Figure S3 and Video S4.
Figure 4.
Figure 4.. TFAP2 distinguishes PRO vs. INV state and modulates clustering and metastasis.
a. HOMER de-novo motif analysis on genes upregulated in ZMEL1-PRO vs. -INV (log2 fold change cutoff ± 1.5, padj < 0.05, ±500bp of transcription start site [TSS]). b. HOMER de-novo motif analysis of genes differentially expressed between ZMEL1-INV in 3D (clusters) vs. 2D (no clusters) (log2 fold change cutoff ± 1.5, padj < 0.05, ±500bp of TSS). c. Cluster size after 2 days in ZMEL1-PRO with CRISPR-Cas9 inactivation of tfap2a and tfap2e alone or in combination (sg_tfap2a/e) versus control (sg_scr) (p-values by linear regression; N=3 independent experiments). d. Representative images of clusters formed after 2 days from ZMEL1-PRO with sg_scr vs. sg_tfap2a/e. e. Growth of ZMEL1-PRO orthotopic primary tumors with sg_scr vs. sg_tfap2a/e (p=0.011 by linear regression; N=3 independent experiments with sg_scr/sg_tfap2a/e 24/22, 22/22, 24/24 fish per group, respectively; n=138 fish total). f. Representative composite image of extravasated (arrows) and partially extravasated (arrow-head) ZMEL1-PRO cells with sg_tfap2a/e following intravenous transplant in casper fish with kdrl-RFP transgene labeling the vasculature. g. Proportion of larval fish intravenously transplanted with ZMEL1-PRO with sg_scr or sg_tfap2a/e with extravasated cells at 1 dpt, as quantified from confocal time lapse microscopy (OR [95% CI]: 2.20 [1.05, 4.61]; p=0.038 by logistic regression; N=3 independent experiments with sg_scr/sg_tfap2a/e 20/20, 22/23, and 22/22 fish per group, respectively; n=129 fish total). See also Figure S4 and Tables S2,S3.
Figure 5.
Figure 5.. TFAP2 correlates with clustering in human melanoma and regulates genes associated with metastasis and cell-cell adhesion
a. Human melanoma cell lines in the Cancer Cell Line Encyclopedia (CCLE, n=56) plotted as PRO and INV scores (Hoek et al., 2006) and colored according to TFAP2A mRNA expression. Pearson correlation coefficients between TFAP2A and PRO/INV scores are shown on axes. b. TFAP2A mRNA expression in The Cancer Genome Atlas (TCGA) melanoma (SKCM) cohort comparing primary tumors and metastases (p<0.001 by Wilcoxon rank sum test with Bonferroni correction). c. Low-passage human melanoma cell lines ranked by increased cluster forming ability (left to right) with TFAP2A expression quantified by immunofluorescence (plot and top; Spearman correlation shown; scale bar 20 μm) and clustering (bottom, scale bar 500 μm). d. GSAA was run using gene sets and GO gene sets with FDR < 0.05 from INV vs. PRO RNA-seq (n=39 gene sets; cyan points in Figures 1d and 2a). Bars show Normalized Association Score (NAS) for CRISPR (ZMEL1-PRO sg_tfap2a/e vs. sg_scr) and INV vs. PRO for each gene set, with black outline representing FDR<0.05 for CRISPR experiment. e. Plot of INV signature (Hoek et al., 2006) by GSAA for ZMEL1-PRO sg_tfap2a/e vs. sg_scr RNA-seq. f. Heatmap of top genes in Hoek INV and GO Adhesion gene sets that are differentially expressed between ZMEL1-PRO sg_tfap2a/e and sg_scr (log2 fold change cutoff ± 0.5, padj < 0.05). Asterisks (*) indicate genes with associated TFAP2A CUT&RUN peaks. Human ortholog gene names are used for clarity (see Figure S5p for zebrafish gene names). See also Figure S5 and Tables S4,S5,S6.
Figure 6.
Figure 6.. PRO-INV heterotypic CTC clusters exist in the blood of melanoma patients.
a. Schematic of experimental design. b. (left) IF staining for TFAP2A and SOX9 (composite image) and (right) nuclear quantification in a PRO-INV heterotypic melanoma CTC cluster. Scale bar is 5μm. c-d. Classification of human melanoma CTC clusters based on quantification of nuclear TFAP2A and SOX9 staining as (c) homotypic (PRO-only or INV-only) vs. PRO-INV heterotypic, and (d) PRO, PRO-INV, and INV. For c-d n=32 clusters from 4 patients. 5 additional patients were analyzed with no CTC clusters identified. For d each stacked box represents one CTC cluster. See also Figure S6 and Table S7.
Figure 7.
Figure 7.. Longitudinal single-cell RNA-seq reveals stability of PRO but not INV state.
a. Schematic of experiment. Prior to flow cytometry and 10X single-cell RNA-seq, ZMEL1-PRO and -INV cells were either grown in vitro (individual or co-culture) or isolated from zebrafish orthotopically transplanted with a 1:1 mixture of PRO and INV (primary tumors or metastases). b. Uniform Manifold Approximation and Projection (UMAP) (McInnes et al., 2018) dimensionality reduction of 40,293 ZMEL1 cells sequenced as in (a). Individual culture (IND); co-culture (CO); primary tumors (PRI); metastases (MET). c. PRO and INV scores based on ZMEL1 bulk RNA-seq plotted for all cells (gray) with ZMEL1-PRO (purple) and ZMEL1-INV (green) for the indicated condition overlaid. Diagonal line represents the classifier used in (d). d. Confusion matrices comparing initial cell identity with observed cell classification based on a linear classifier trained on in vitro individual culture samples. e. ZMEL1-INV cells plotted as in (c) colored according to tfap2e mRNA expression reveal re-activation of tfap2e upon metastatic dissemination. See also Figure S7.

Comment in

References

    1. Aceto N, Bardia A, Miyamoto DT, Donaldson MC, Wittner BS, Spencer JA, Yu M, Pely A, Engstrom A, Zhu H, et al. (2014). Circulating tumor cell clusters are oligoclonal precursors of breast cancer metastasis. Cell 158, 1110–1122. - PMC - PubMed
    1. Ågren JA, Davies NG, and Foster KR (2019). Enforcement is central to the evolution of cooperation. Nature Ecology & Evolution 3, 1018–1029. - PubMed
    1. Archetti M, and Pienta KJ (2019). Cooperation among cancer cells: applying game theory to cancer. Nat Rev Cancer 19, 110–117. - PMC - PubMed
    1. Axelrod R, Axelrod DE, and Pienta KJ (2006). Evolution of cooperation among tumor cells. Proc Natl Acad Sci U S A 103, 13474–13479. - PMC - PubMed
    1. Baron M, Tagore M, Hunter MV, Kim IS, Moncada R, Yan Y, Campbell NR, White RM, and Yanai I (2020). The Stress-Like Cancer Cell State Is a Consistent Component of Tumorigenesis. Cell Systems 11, 536–546. - PMC - PubMed

Publication types