. 2021 Sep 16;21(1):1035.
doi: 10.1186/s12885-021-08765-w.

A TP53 mutation model for the prediction of prognosis and therapeutic responses in head and neck squamous cell carcinoma

Affiliations

A TP53 mutation model for the prediction of prognosis and therapeutic responses in head and neck squamous cell carcinoma

Congyu Shi et al. BMC Cancer. .

Abstract

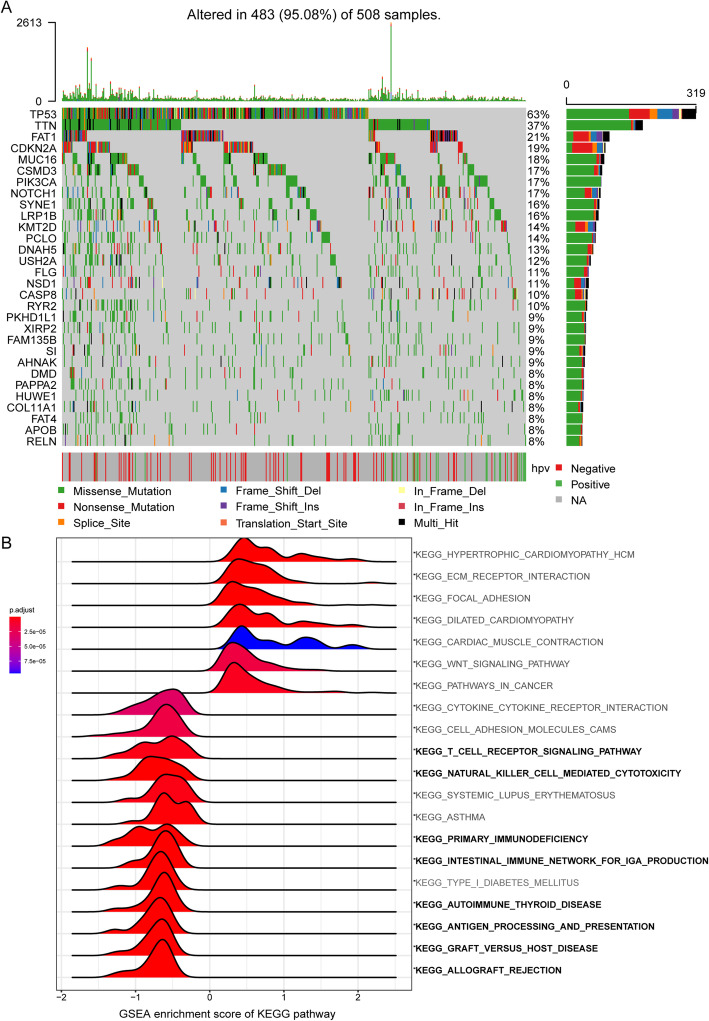
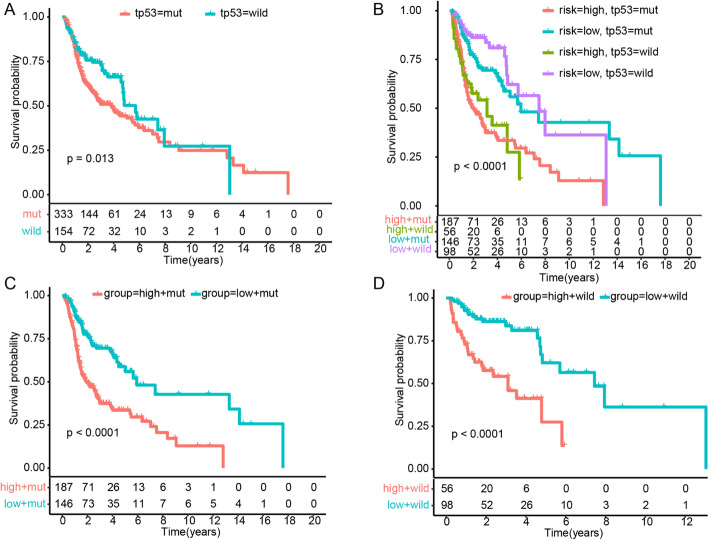
Background: Tumor protein p53 (TP53) is the most frequently mutated gene in head and neck squamous cell carcinoma (HNSC), and TP53 mutations are associated with inhibited immune signatures and poor prognosis. We established a TP53 mutation associated risk score model to evaluate the prognosis and therapeutic responses of patients with HNSC.

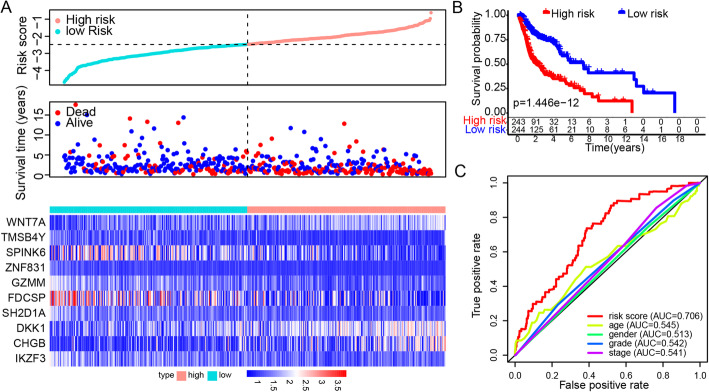
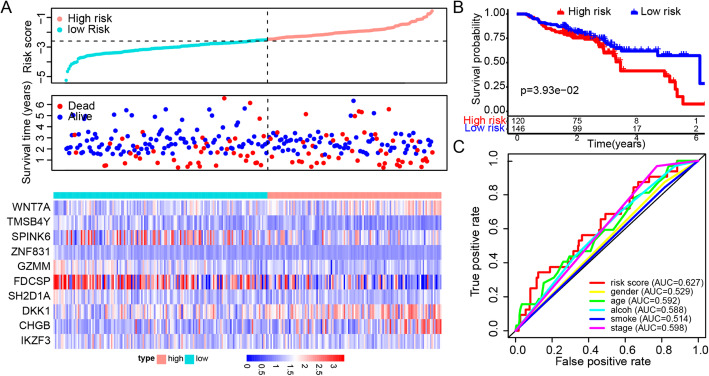
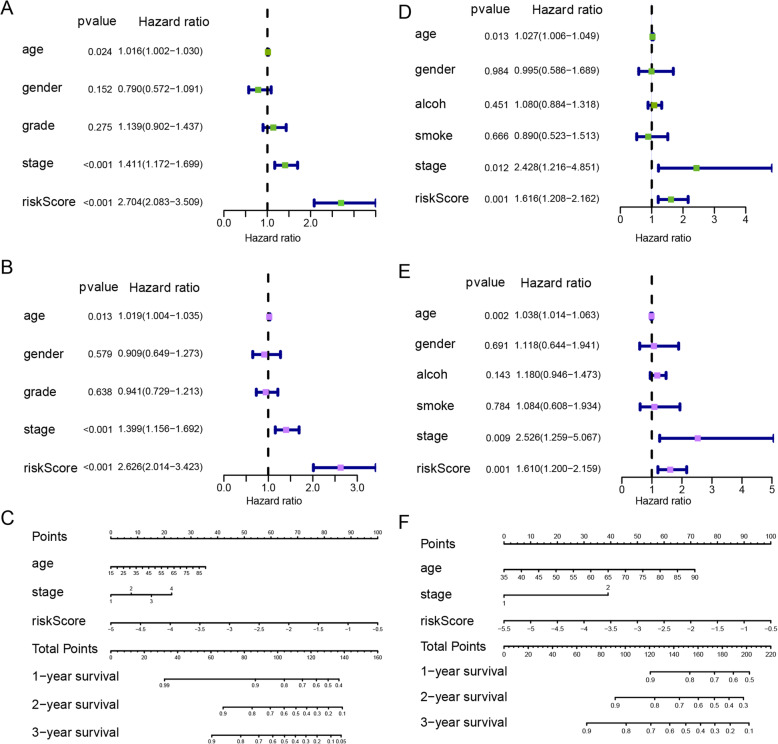
Methods: Differentially expressed genes between patients with and without TP53 mutations were determined by using data from the HNSC cohort in The Cancer Genome Atlas database. Patients with HNSC were divided into high- and low-risk groups based on a prognostic risk score that was generated from ten TP53 mutation associated genes via the multivariate Cox regression model.

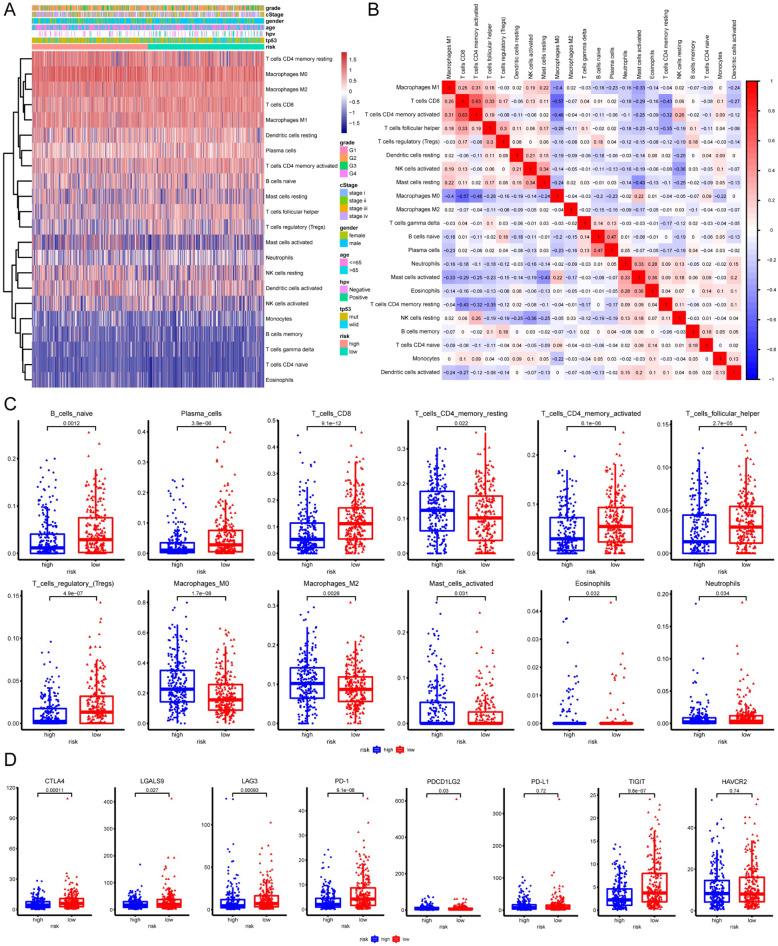
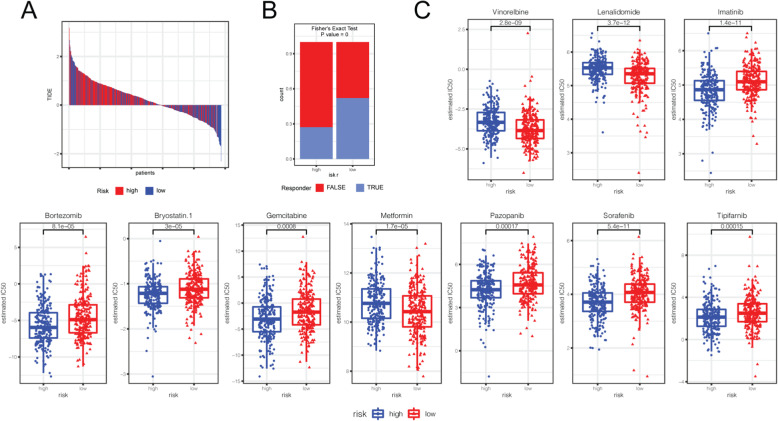
Results: TP53 was the most common mutant gene in HNSC, and TP53 mutations were associated with immunogenic signatures, including the infiltration of immune cells and expression of immune-associated genes. Patients in the high-risk group had significantly poorer overall survival than those in the low-risk group. The high-risk group showed less response to anti-programmed cell death protein 1 (PD-1) therapy but high sensitivity to some chemotherapies.

Conclusion: The risk score based on our TP53 mutation model was associated with poorer survival and could act as a specific predictor for assessing prognosis and therapeutic response in patients with HNSC.

Keywords: Chemotherapy; Head and neck squamous cell carcinoma; Immunotherapy; Prognosis; TP53 mutation; Therapeutic response.


Conflict of interest statement

The authors declare that there is no conflict of interest.

Figures

Fig. 1
Fig. 1
TP53 mutation-associated genes in the TCGA HNSC cohort and GSEA of KEGG pathways. A The mutated genes were listed according to their mutation frequencies, considering the status of HPV infection. The mutations include missense mutations, nonsense mutations, splice-site mutations, frameshift mutations, and in-frame mutations. The oncoplot were drawn in maftools package. B Gene set enrichment analysis (GSEA) was performed to enrich the KEGG pathways in genes that were related to TP53 mutation. Significant enrichments in immune-related KEGG pathways are labeled in bold. A false discovery rate (FDR) of less than 0.05 and an absolute value of the enrichment score (ES) of greater than 0.5 were defined as the cutoff criteria. The analysis were finished using clusterProfiler package
Fig. 2
Fig. 2
Construction of the DEG-based gene signature prognostic model. A Risk score, vital status and heatmap of prognostic genes in the high- and low-risk groups. B Kaplan-Meier survival curves of the relative overall survival of high- and low-risk patients. C The ROC curve for one-year survival of the gene signature and clinical features. DEGs were identified between TP53 mutated and wildtype TCGA-HNSC samples (Padj < 0.05, |logFC| > 1). Prognostic DEGs were screened with coxph P value < 0.001, these genes were displayed in Supplementary Table 3. The risk model was constructed after stepwise coxph analysis with survival package. The information of ten genes in model were summarized in supplementary Table 4
Fig. 3
Fig. 3
Validation of the DEG-based gene signature prognostic model in GSE65858. A Risk score, vital status and heatmap of prognostic genes in the high- and low-risk groups. B Kaplan-Meier survival curves of the relative overall survival of high- and low-risk patients. C The ROC curve for one-year survival of the gene signature and clinical features
Fig. 4
Fig. 4
Kaplan-Meier analysis of overall survival based on the combination of TP53 mutation status and risk score of the prognostic model. A TP53 mutation vs wildtype group. B TP53 mutation status with high−/low-risk group. C TP53 mutation subgroup with high−/low-risk group. D TP53 wildtype subgroup with high−/low-risk group
Fig. 5
Fig. 5
Immune cell infiltration landscapes in high- and low-risk patients with HNSC in TCGA-HNSC cohort. A Scaled immune cell infiltration proportions in high- and low-risk patients. The proportions were estimated by CIBERSORT through mRNA expression matrix (scaled by log2(TPM + 1)); B Correlation matrix for immune cells. C Differences of immune cell infiltrations between high- and low-risk patients. D Differences of immune-associated genes between high- and low-risk patients
Fig. 6
Fig. 6
Immunotherapeutic and chemotherapeutic responses in high- and low-risk patients with HNSC. A Immunotherapeutic responses to anti-PD-1 therapy in high- and low-risk patients. B The P value is shown using Fisher’s exact test to detect whether the immunotherapeutic response rates of the high-risk and low-risk groups were significantly different. C Drugs in clinics or in test for HNSC with significant differential chemotherapeutic responses (P < 0.001) in high- and low-risk patients predicted by the pRRopheic package in the R language
Fig. 7
Fig. 7
Correlation between the gene signature and clinical characteristics in the TCGA HNSC cohort and GSE65858 dataset. Univariate (A) and multivariate (B) Cox regression analyses of correlations between the gene signature and clinical characteristics with overall survival in the TCGA HNSC cohort. C Nomogram for predicting the 1-, 2-, and 3-year overall survival of patients with HNSC. Univariate (D) and multivariate (E) Cox regression analyses of correlations between the gene signature and clinical characteristics with overall survival in the GSE65858 dataset. F Nomogram for predicting the 1-, 2-, and 3-year overall survival of patients in the GSE65858 dataset

References

    1. Leemans CR, Braakhuis BJ, Brakenhoff RH. The molecular biology of head and neck cancer. Nat Rev Cancer. 2011;11(1):9–22. doi: 10.1038/nrc2982. - DOI - PubMed
    1. Yan K, Agrawal N, Gooi Z. Head and neck masses. Med Clin North Am. 2018;102(6):1013–1025. doi: 10.1016/j.mcna.2018.06.012. - DOI - PubMed
    1. Global Burden of Disease Cancer C. Fitzmaurice C, Allen C, Barber RM, Barregard L, Bhutta ZA, Brenner H, Dicker DJ, Chimed-Orchir O, Dandona R, et al. Global, regional, and national cancer incidence, mortality, years of life lost, years lived with disability, and disability-adjusted life-years for 32 cancer groups, 1990 to 2015: a systematic analysis for the global burden of disease study. JAMA Oncol. 2017;3(4):524–548. doi: 10.1001/jamaoncol.2016.5688. - DOI - PMC - PubMed
    1. Miyauchi S, Kim SS, Pang J, Gold KA, Gutkind JS, Califano JA, Mell LK, Cohen EEW, Sharabi AB. Immune modulation of head and neck squamous cell carcinoma and the tumor microenvironment by conventional therapeutics. Clin Cancer Res. 2019;25(14):4211–4223. doi: 10.1158/1078-0432.CCR-18-0871. - DOI - PMC - PubMed
    1. Maier H, Dietz A, Gewelke U, Heller WD, Weidauer H. Tobacco and alcohol and the risk of head and neck cancer. Clin Investig. 1992;70(3–4):320–327. doi: 10.1007/BF00184668. - DOI - PubMed

MeSH terms

Substances