. 2021 Sep 16;14(1):44.
doi: 10.1186/s13072-021-00415-6.

Identification of tissue-specific and common methylation quantitative trait loci in healthy individuals using MAGAR

Affiliations

Identification of tissue-specific and common methylation quantitative trait loci in healthy individuals using MAGAR

Michael Scherer et al. Epigenetics Chromatin. .

Abstract

Background: Understanding the influence of genetic variants on DNA methylation is fundamental for the interpretation of epigenomic data in the context of disease. There is a need for systematic approaches not only for determining methylation quantitative trait loci (methQTL), but also for discriminating general from cell type-specific effects.

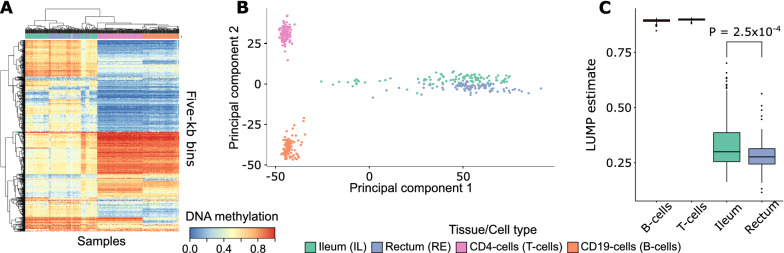
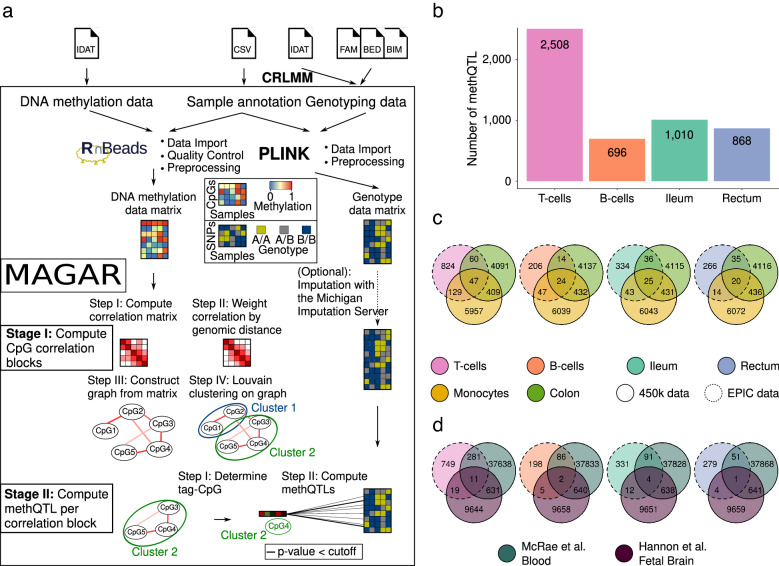
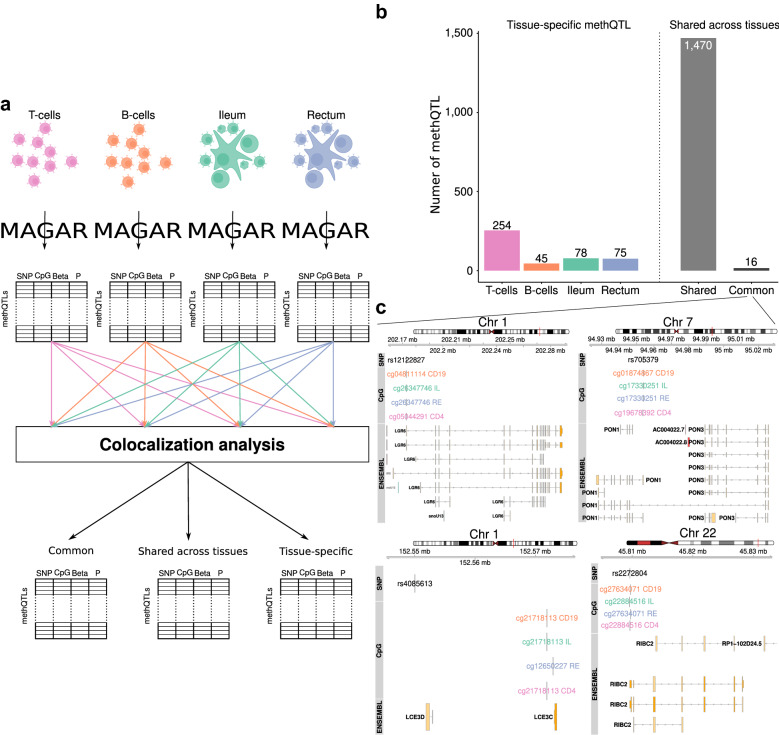
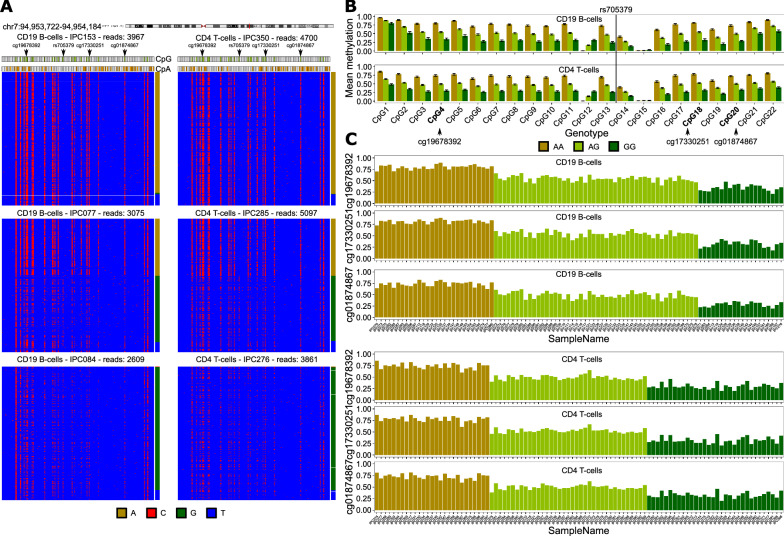
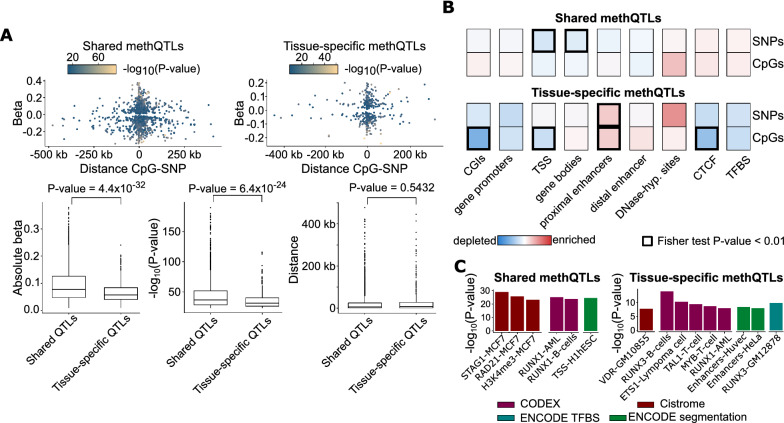
Results: Here, we present a two-step computational framework MAGAR ( https://bioconductor.org/packages/MAGAR ), which fully supports the identification of methQTLs from matched genotyping and DNA methylation data, and additionally allows for illuminating cell type-specific methQTL effects. In a pilot analysis, we apply MAGAR on data in four tissues (ileum, rectum, T cells, B cells) from healthy individuals and demonstrate the discrimination of common from cell type-specific methQTLs. We experimentally validate both types of methQTLs in an independent data set comprising additional cell types and tissues. Finally, we validate selected methQTLs located in the PON1, ZNF155, and NRG2 genes by ultra-deep local sequencing. In line with previous reports, we find cell type-specific methQTLs to be preferentially located in enhancer elements.

Conclusions: Our analysis demonstrates that a systematic analysis of methQTLs provides important new insights on the influences of genetic variants to cell type-specific epigenomic variation.

Keywords: Computational biology; DNA methylation; Quantitative trait loci; Tissue specificity.


Conflict of interest statement

Y.S.A. is a co-founder and co-owner of PolyKnomics, a private organization active in the fields of quantitative, computational, and statistical genomics. All other authors declare that they have no competing interests.

Figures

Fig. 1
Fig. 1
Cell type-specific DNA methylation patterns in the discovery data set. A Heatmap (blue low, red high DNA methylation levels) of the 1000 most variably methylated genome-wide bins of size 5 kb. Hierarchical clustering of samples and bins was performed using Euclidean distance and complete linkage. B PCA plot of genome-wide DNA methylation data at the single-CpG level. The first two principal components are displayed. C Boxplots depicting the distributions of LUMP estimates for the overall immune cell content of the different cell types/tissues. The P-value was computed using a two-sided t-test
Fig. 2
Fig. 2
Overview of MAGAR and methQTL results. A MAGAR is an R-package utilizing a two-stage protocol. After data import via established software packages, CpGs are clustered into CpG-correlation blocks in a four-step procedure. In the second stage, methQTLs are called for each correlation block separately. B Number of methQTLs identified by MAGAR for T cells, B cells, ileum, and rectum samples. Overlap between the methQTLs identified per tissue/cell type with methQTLs identified in the validation cohort (C) and in published methQTLs from blood [12] and fetal brain samples [38] (D). The methQTLs were reduced to those methQTLs affecting CpGs present on the 450k microarray
Fig. 3
Fig. 3
Common and tissue-specific methQTLs identified through colocalization analysis. A To define tissue specificity, we employed MAGAR on the four tissues/cell types independently to obtain methQTL statistics. These were used in pairwise colocalization analyses to define common and tissue-specific methQTL, as well as methQTLs shared across several tissues. B Number of tissue-specific methQTLs per tissue and methQTLs shared across different tissues according to the colocalization analysis. Common methQTLs were shared according to the colocalization analysis and had methQTL P-values below the cutoff in all tissues. C Examples of four common methQTLs located in vicinity to PON1, LGR6, LCE3D, and RIBC2
Fig. 4
Fig. 4
Validation of methQTL at PON1 locus using ultra-deep bisulfite sequencing. A Bisulfite sequencing read pattern maps for three individuals with genotypes homozygous for the reference allele (AA), heterozygous (AG), or homozygous for the alternative allele (GG) for B cells and T cells, respectively. Each line is a sequencing read, where the red color indicates a cytosine, i.e., a methylated cytosine before bisulfite conversion, and blue a thymine, i.e., an unmethylated cytosine before bisulfite conversion. All cytosines within the amplicon are shown in the pattern map and the CpG and CpA dinucleotides are marked. The genotype at rs705379 per sequencing read is indicated on the right. Shown is the common methQTL at the PON1 locus at chr7:94,953,722–94,954,184 (hg19). B Average DNA methylation levels across all samples of the same genotype and standard deviations across the samples. The barplots are shown for all 22 CpGs present in the amplicon. C Average DNA methylation levels across all sequencing reads per sample for the three CpGs that were associated with the SNP genotype in the microarray data analysis for B cells and T cells
Fig. 5
Fig. 5
Properties of methQTLs shared across the tissues and tissue-specific methQTLs. A Distance between the CpG and the SNP, the effect size (slope of the regression) of the methQTL, and the negative common logarithm of the methQTL P-value are visualized. MethQTLs were classified as either shared or tissue-specific. B Enrichment analysis of shared (top) or tissue-specific methQTLs (bottom) in different functional annotations of the genome. Visualized is the common logarithm of the odds ratio and the associated Fisher exact test P-value was computed. P-values below 0.01 are indicated by a bold outline. C LOLA [44] enrichment analysis of the methQTL SNPs for the shared and tissue-specific methQTLs, respectively. ESC embryonic stem cell, AML acute myeloid leukemia

Similar articles

Cited by

References

    1. Durek P, Nordström K, Gasparoni G, Salhab A, Kressler C, de Almeida M, et al. Epigenomic profiling of human CD4+ T cells supports a linear differentiation model and highlights molecular regulators of memory development. Immunity. 2016;45:1148–1161. doi: 10.1016/j.immuni.2016.10.022. - DOI - PubMed
    1. Weber M, Davies JJ, Wittig D, Oakeley EJ, Haase M, Lam WL, et al. Chromosome-wide and promoter-specific analyses identify sites of differential DNA methylation in normal and transformed human cells. Nat Genet. 2005;37:853–862. doi: 10.1038/ng1598. - DOI - PubMed
    1. Reik W, Walter J. Genomic imprinting: parental influence on the genome. Nat Rev Genet. 2001;2:21–32. doi: 10.1038/35047554. - DOI - PubMed
    1. Xie W, Barr CL, Kim A, Yue F, Lee AY, Eubanks J, et al. Base-resolution analyses of sequence and parent-of-origin dependent DNA methylation in the mouse genome. Cell. 2012;148:816–831. doi: 10.1016/j.cell.2011.12.035. - DOI - PMC - PubMed
    1. Fang F, Hodges E, Molaro A, Dean M, Hannon GJ, Smith AD. Genomic landscape of human allele-specific DNA methylation. Proc Natl Acad Sci U S A. 2012;109:7332–7337. doi: 10.1073/pnas.1201310109. - DOI - PMC - PubMed

Publication types