. 2021 Sep 16;9(1):188.
doi: 10.1186/s40168-021-01125-7.

Commensal microbe-derived acetate suppresses NAFLD/NASH development via hepatic FFAR2 signalling in mice

Affiliations

Commensal microbe-derived acetate suppresses NAFLD/NASH development via hepatic FFAR2 signalling in mice

Ryo Aoki et al. Microbiome. .

Abstract

Background: Non-alcoholic liver disease (NAFLD) is the hepatic manifestation of metabolic syndrome, and it can progress to non-alcoholic steatohepatitis (NASH). Alterations in the gut microbiome have been implicated in the development of NAFLD/NASH, although the underlying mechanisms remain unclear.

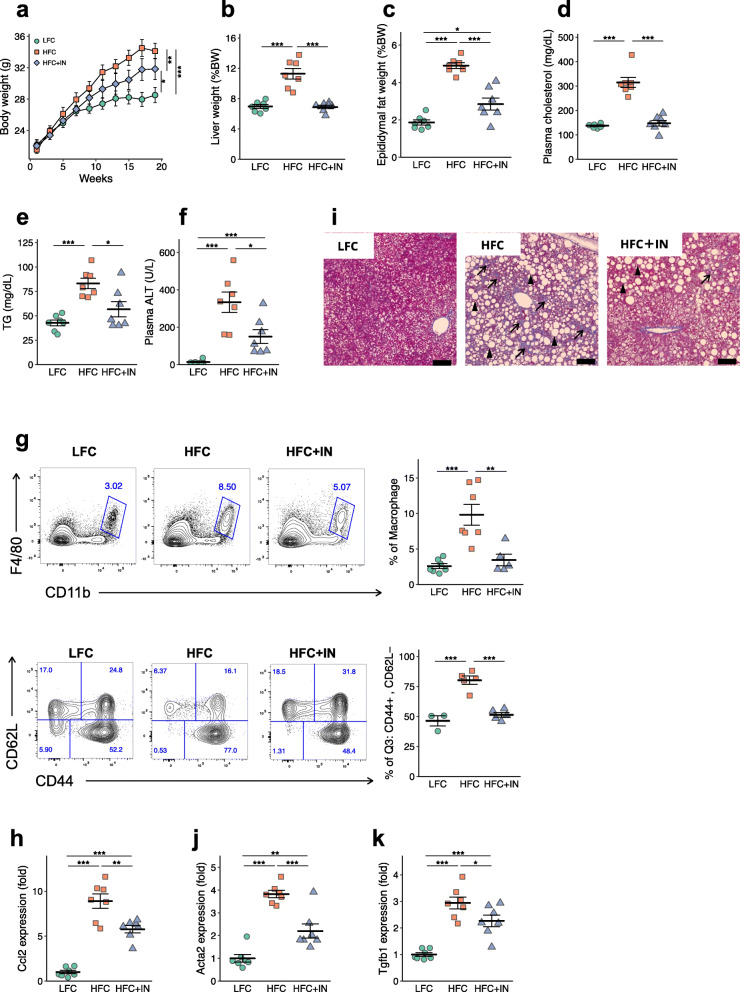
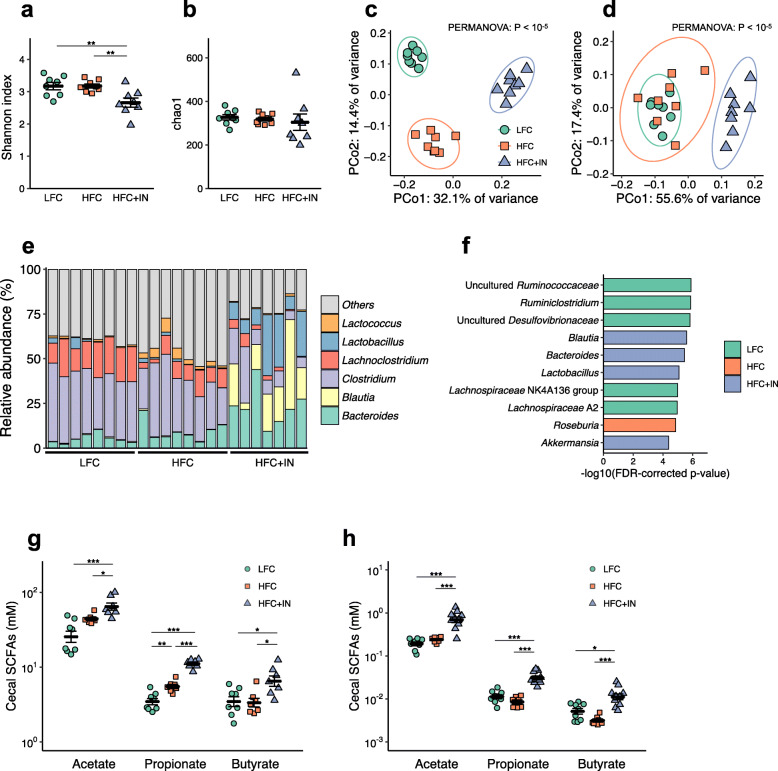
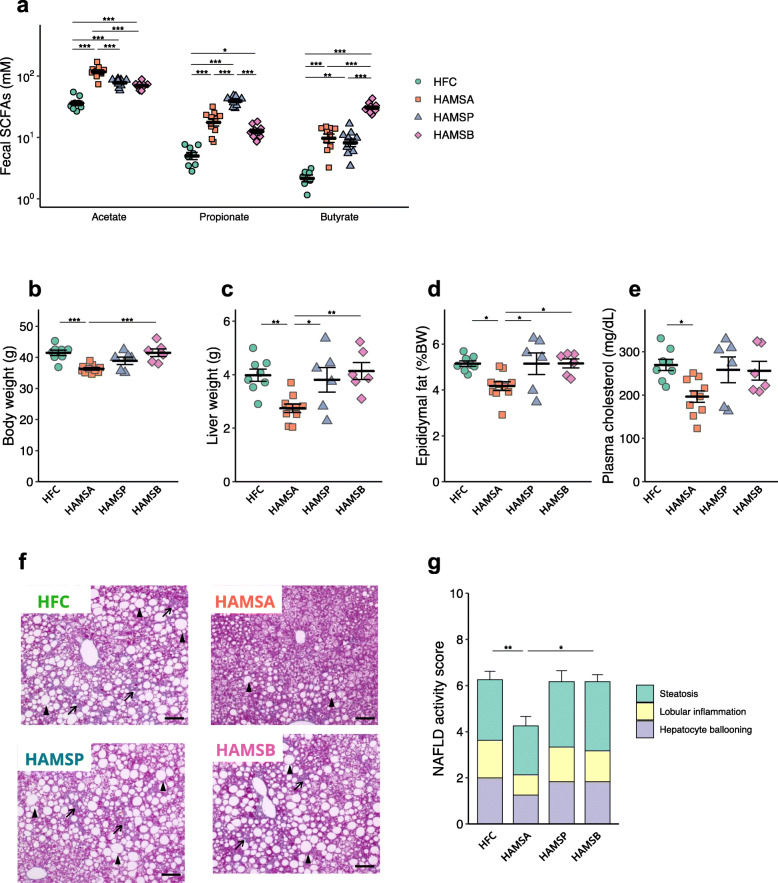
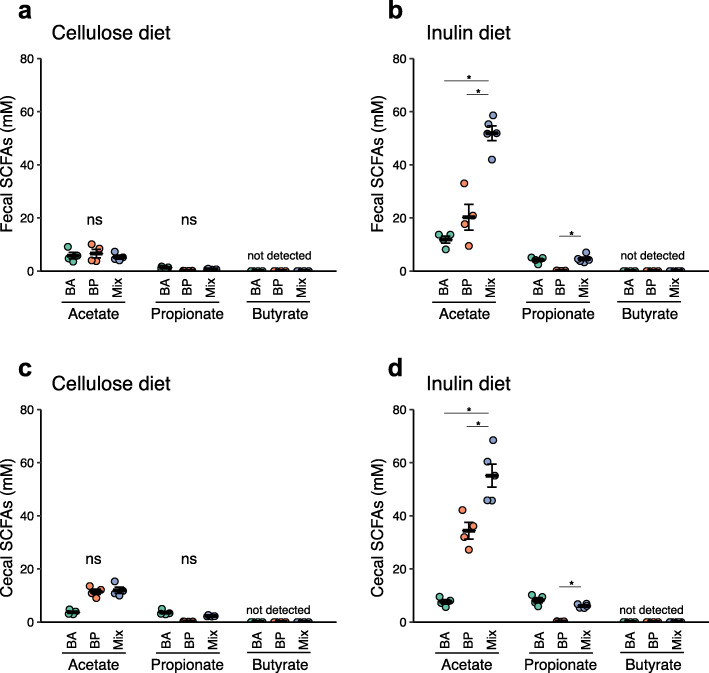
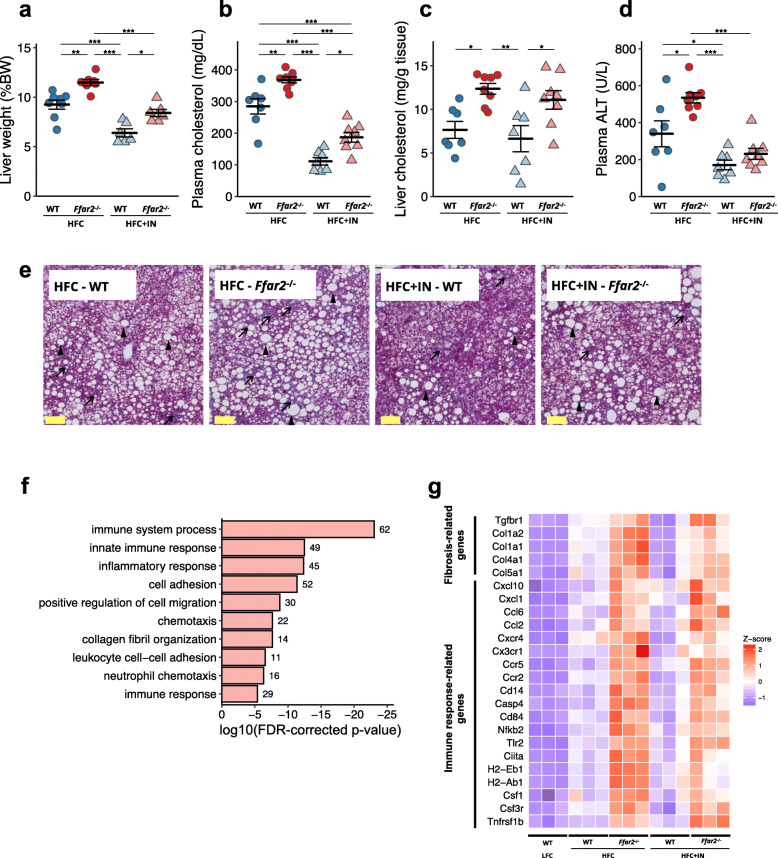
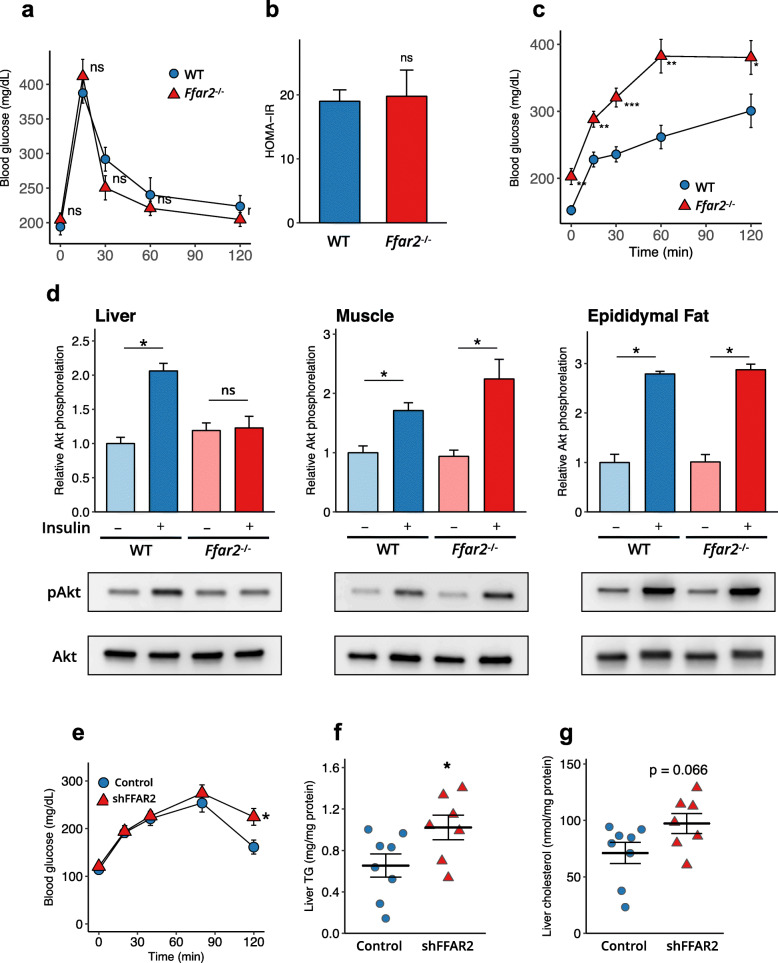
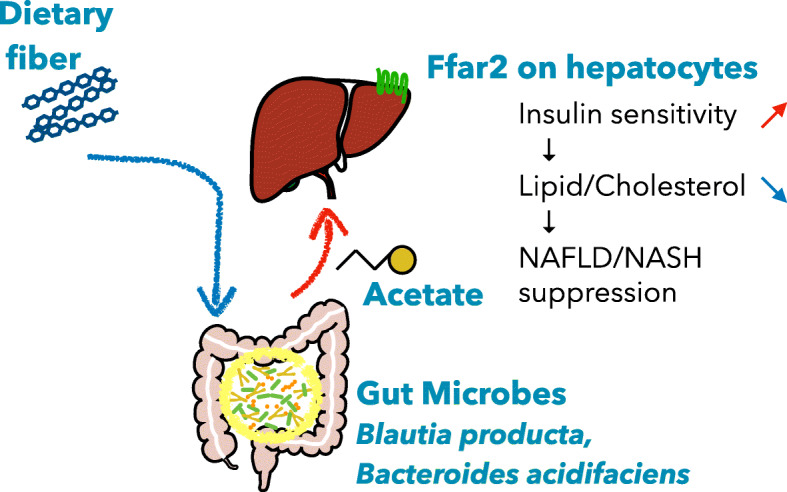
Results: We found that the consumption of the prebiotic inulin markedly ameliorated the phenotype of NAFLD/NASH, including hepatic steatosis and fibrosis, in mice. Inulin consumption resulted in global changes in the gut microbiome, including concomitant enrichment of the genera Bacteroides and Blautia, and increased concentrations of short-chain fatty acids, particularly acetate, in the gut lumen and portal blood. The consumption of acetate-releasing resistant starch protected against NAFLD development. Colonisation by Bacteroides acidifaciens and Blautia producta in germ-free mice resulted in synergetic effects on acetate production from inulin. Furthermore, the absence of free fatty acid receptor 2 (FFAR2), an acetate receptor, abolished the protective effect of inulin, as indicated by the more severe liver hypertrophy, hypercholesterolaemia and inflammation. These effects can be attributed to an exacerbation of insulin resistance in the liver, but not in muscle or adipose tissue.

Conclusion: These findings demonstrated that the commensal microbiome-acetate-FFAR2 molecular circuit improves insulin sensitivity in the liver and prevents the development of NAFLD/NASH. Video abstract.

Keywords: Acetate; Bacteroides; Blautia; FFAR2; Inulin; NAFLD; NASH; Prebiotics; Short-chain fatty acids.


Conflict of interest statement

The authors declare that they have no competing interests.

Figures

Fig. 1
Fig. 1
Prebiotic inulin supplementation prevents NAFLD/NASH development. Mice were fed a low-fat/fructose/cholesterol diet (LFC), a high-fat/fructose/cholesterol diet (HFC) or a 10% (w/w) inulin-supplemented HFC diet (HFC + IN) for 20 weeks. a Body mass of C57BL/6 mice (LFC, n = 8; HFC, n = 7; HFC + IN, n = 7). Data are mean ± SEM. b Liver to body mass ratio (LFC, n = 8; HFC, n = 7; HFC + IN, n = 7). c Epididymal fat to body mass ratio (LFC, n = 8; HFC, n = 7; HFC + IN, n = 7). d Plasma cholesterol. (LFC, n = 8; HFC, n = 7; HFC + IN, n = 7) e Plasma triglyceride (LFC, n = 8; HFC, n = 7; HFC + IN, n = 7). f Plasma ALT (LFC, n = 8; HFC, n = 7; HFC + IN, n = 7). g Representative plots and quantification of the flow cytometric analysis of liver mononuclear cells from LFD, HFC and HFC + IN-fed mice. CD11b+ and F4/80+ cells (LFC, n = 8; HFC, n = 7; HFC + IN, n = 7) and CD44+CD8+CD62L T cells (LFC, n = 3; HFC, n = 5; HFC + IN, n = 5) are shown. i Representative Masson’s trichrome staining of livers from LFC, HFC and HFC + IN mice. Scale bar: 50 μm; black arrows show fibrosis, black arrowheads show hepatocyte ballooning. h, j, k Quantitative PCR analysis of fibrosis-related genes in mRNA isolated from LFC, HFC and HFC + IN mouse livers(LFC, n = 8; HFC, n = 7; HFC + IN, n = 7). Each point in bf and hm represents an individual mouse (thick bars, means; error bars, SEM). The data represent at least two independent experiments with similar results. *P < 0.05, **P < 0.01, ***P < 0.001 (one-way analysis of variance (ANOVA) followed by post hoc Tukey’s test)
Fig. 2
Fig. 2
Inulin supplementation alters the composition of the gut microbiome and increases SCFA concentrations in the gut and portal blood. a Shannon index. b Chao1 index. c Principal coordinate analysis plot generated using an unweighted UniFrac metric. The two components explained 46.5% of the variance. d Principal coordinate analysis plot generated using a weighted UniFrac metric. The two components explained 73.0% of the variance. e Relative abundances of bacterial genera in the caecal contents. f Bacterial taxa at the genus level enriched in LFC, HFC or HFC+IN mice, generated using ALDEx2 analysis. Microbial taxa with the smallest FDR-corrected p values are shown. g SCFA concentrations in the caecum after 20 weeks of diet ingestion. h SCFA concentrations in the portal blood after 20 weeks of diet ingestion. Each point in a, b, f and g represents an individual mouse (thick bars, means; error bars, SEM). LFC, n = 8; HFC, n = 8; HFC + IN, n = 7. *P < 0.05, **P < 0.01, ***P < 0.001 on ANOVA followed by post hoc Tukey’s test (a, b, g and h)
Fig. 3
Fig. 3
Acetate administered in the diet protects against NAFLD development. Mice were fed an HFC control diet (HFC), or HFC supplemented with high-amylose maize starch esterified with acetate (HAMSA), propionate (HAMSP) or butyrate (HAMSB) for 8 weeks (a) or 20 weeks (bg). a Concentrations of acetate, propionate and butyrate in the faeces after 8 weeks consuming diets (HFC, n = 8; HAMSA, n = 9; HAMSP, n = 9; HAMSB = 9). b Body mass. c Liver to body mass ratio. d Epididymal adipose tissue to body mass ratio. e Quantification of plasma cholesterol. f Representative Masson’s trichrome staining of livers. Scale bar: 50 μm; black arrows show fibrosis, black arrowheads show hepatocyte ballooning. g Non-alcoholic fatty liver disease activity score. Each point in ae represents an individual mouse (thick bars, means; error bars, SEM; be and g, HFC, n = 8; HAMSA, n = 9; HAMSP, n = 6; HAMSB = 6. Data are mean ± SEM. *P < 0.05, **P < 0.01, ***P < 0.001 on ANOVA followed by post hoc Tukey’s test (ae) or Kruskal-Wallis followed by Steel-Dwass test (g)
Fig. 4
Fig. 4
Bacteroides acidifaciens and Blautia producta produce acetate from the fermentation of inulin. ad SCFA concentrations Bacteroides acidifaciens (BA), Blautia producta (BP), or BA/BP mixture (mix)-administered mice. The mice were fed a diet containing cellulose (a, c) or inulin (b, d) as a source of dietary fibre for 4 weeks. SCFA content of the faeces in mice (a BA, n = 4; BP, n = 4, mix, n = 4; b BA, n = 4; BP, n = 4, mix, n = 5). SCFA content of the caecal contents (c BA, n = 4; BP, n = 4, mix, n = 4; d BA, n = 4; BP, n = 4, mix, n = 5). Each point represents an individual mouse (thick bars, means; error bars, SEM). *P < 0.05, **P < 0.01, ***P < 0.001 (Kruskal-Wallis followed by Steel-Dwass test)
Fig. 5
Fig. 5
A deficiency in FFAR2 exacerbates the NAFLD/NASH phenotype. C57BL/6 WT or Ffar2−/− mice were fed an HFC or an HFC + IN diet for 20 weeks. a Liver to body mass ratio (WT + HFC, n = 7; Ffar2−/− + HFC, n = 8; WT + IN, n = 6, Ffar2−/− + HFC, n = 6). b Plasma cholesterol (WT + HFC, n = 7; Ffar2−/− + HFC, n = 8; WT + IN, n = 6, Ffar2−/− + HFC, n = 6). c Liver cholesterol (WT + HFC, n = 7; Ffar2−/− + HFC, n = 8; WT + IN, n = 7, Ffar2−/− + HFC, n = 8). d Plasma ALT (WT + HFC, n = 7; Ffar2−/− + HFC, n = 8; WT + IN, n = 7, Ffar2−/− + HFC, n = 8). e Representative Masson’s trichrome staining of livers. Scale bar: 50 μm; black arrows show fibrosis, black arrowheads show hepatocyte ballooning. f Annotated gene ontology (GO) biological processes were assigned to genes upregulated in Ffar2−/− mice versus WT mice in the liver after 20 weeks of consuming the HFC diet. Numbers next to bars represent the number of genes per pathway. g Heat maps of representative immune response- and fibrosis-related genes were constructed for genes differentially expressed in Ffar2−/− mouse liver, as determined by RNA-seq. n = 3 per condition. Each point in af represents an individual mouse (thick bars, means; error bars, SEM). Data represent at least two independent experiments with similar results. *P < 0.05, **P < 0.01, ***P < 0.001 (ANOVA followed by post hoc Tukey’s test)
Fig. 6
Fig. 6
FFAR2 signalling play key roles in hepatic insulin signalling and NAFLD/NASH development. Impairment in the FFAR2-induced enhancement of insulin signalling exacerbates insulin resistance in the liver but not in the adipose tissue or muscle. a Oral glucose tolerance testing performed in WT and Ffar2−/− mice fed an HFC diet for 19 weeks (WT, n = 6; Ffar2−/−, n = 7). b HOMA-IR was calculated according to the following formula: HOMA-IR = {[fasting insulin (mU/ml) − fasting glucose (mg/dl)]/405} (WT, n = 6; Ffar2−/−, n = 7). c Pyruvate tolerance testing performed in WT and Ffar2/− mice fed an HFC diet for 20 weeks (WT, n = 6; Ffar2−/−, n = 7). d Insulin-stimulated Akt phosphorylation at Ser473 in the liver, muscle and epididymal fat of Ffar2−/− mice fed an HFC diet, after 6 h of fasting (n = 3 each). e Adenovirus-mediated Ffar2 knockdown in the liver increases insulin resistance and triglyceride accumulation in the liver. Male 8-week-old C57BL/6 mice were administered with a control or Ffar2 shRNA adenovirus (Control, n = 8; shFFAR2, n = 7) and were fed an HFC diet for 4 weeks. Pyruvate tolerance testing performed after 16 h of fasting. f Liver triglyceride. g Liver cholesterol. Data represent mean ± SEM. *P < 0.05, **P < 0.01, ***P < 0.001 (unpaired Student’s t test)
Fig. 7
Fig. 7
Proposed model for the protective effect of acetate derived from carbohydrate fermentation against NAFLD/NASH in mice

References

    1. Smits MM, Ioannou GN, Boyko EJ, Utzschneider KM. Non-alcoholic fatty liver disease as an independent manifestation of the metabolic syndrome: results of a US national survey in three ethnic groups. J Gastroenterol. Hepatol. 2013;28:664–670. doi: 10.1111/jgh.12106. - DOI - PubMed
    1. Fan J-G, Zhu J, Li X-J, Chen L, Li L, Dai F, Li F, Chen SY. Prevalence of and risk factors for fatty liver in a general population of Shanghai, China. J Hepatol. 2005;43:508–514. doi: 10.1016/j.jhep.2005.02.042. - DOI - PubMed
    1. Chalasani N, Younossi Z, Lavine JE, Diehl AM, Brunt EM, Cusi K, et al. The diagnosis and management of non-alcoholic fatty liver disease: practice guideline by the American Gastroenterological Association, American Association for the Study of Liver Diseases, and American College of Gastroenterology. Gastroenterology. 2012;142:1592–1609. doi: 10.1053/j.gastro.2012.04.001. - DOI - PubMed
    1. Loomba R, Seguritan V, Li W, Long T, Klitgord N, Bhatt A, et al. Gut microbiome-based metagenomic signature for non-invasive detection of advanced fibrosis in human nonalcoholic fatty liver disease. Cell Metab. 2017;25:1054–1062.e5. doi: 10.1016/j.cmet.2017.04.001. - DOI - PMC - PubMed
    1. Goel A, Gupta M, Aggarwal R. Gut microbiota and liver disease. J Gastroenterol Hepatol. 2014;29:1139–1148. doi: 10.1111/jgh.12556. - DOI - PubMed

Publication types

Supplementary concepts