. 2021 Sep;9(9):e002408.
doi: 10.1136/jitc-2021-002408.

Intratumoral combination therapy with poly(I:C) and resiquimod synergistically triggers tumor-associated macrophages for effective systemic antitumoral immunity

Affiliations

Intratumoral combination therapy with poly(I:C) and resiquimod synergistically triggers tumor-associated macrophages for effective systemic antitumoral immunity

Clément Anfray et al. J Immunother Cancer. 2021 Sep.

Abstract

Background: Tumor-associated macrophages (TAMs) play a key immunosuppressive role that limits the ability of the immune system to fight cancer and hinder the antitumoral efficacy of most treatments currently applied in the clinic. Previous studies have evaluated the antitumoral immune response triggered by (TLR) agonists, such as poly(I:C), imiquimod (R837) or resiquimod (R848) as monotherapies; however, their combination for the treatment of cancer has not been explored. This study investigates the antitumoral efficacy and the macrophage reprogramming triggered by poly(I:C) combined with R848 or with R837, versus single treatments.

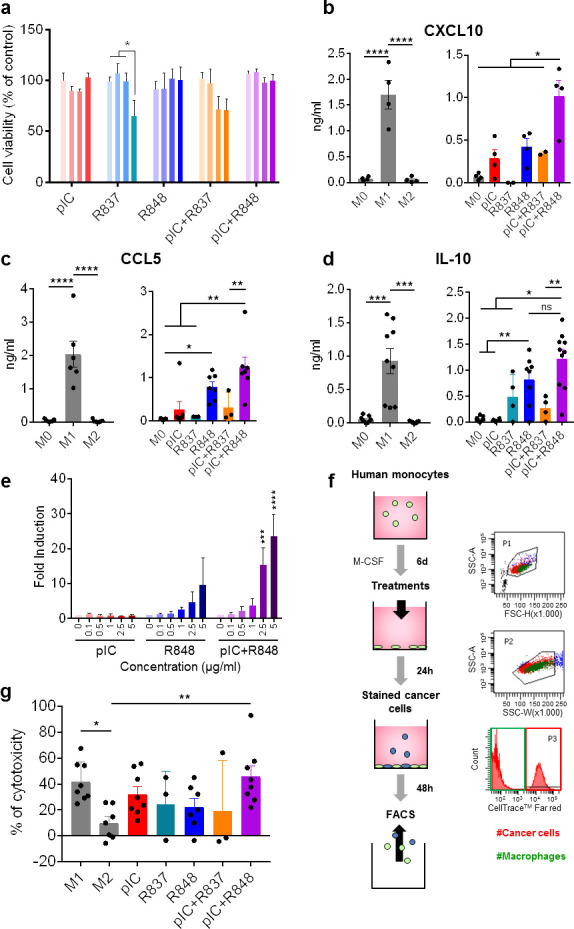
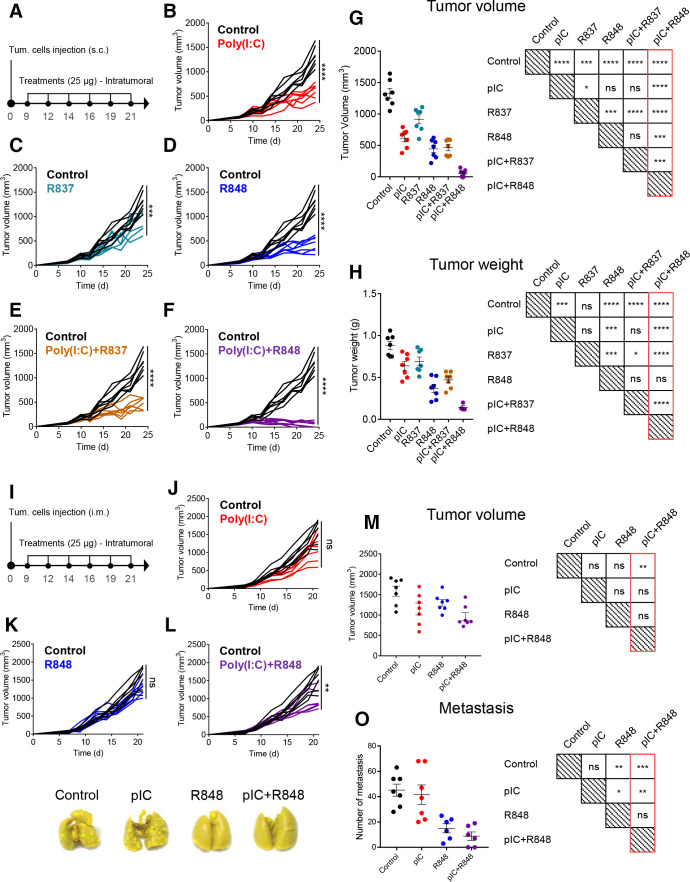
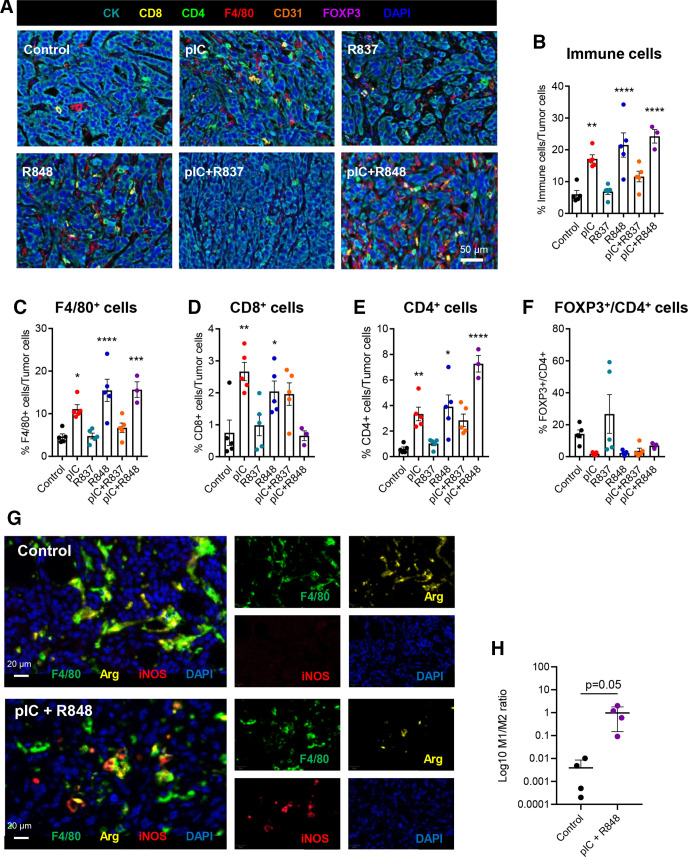
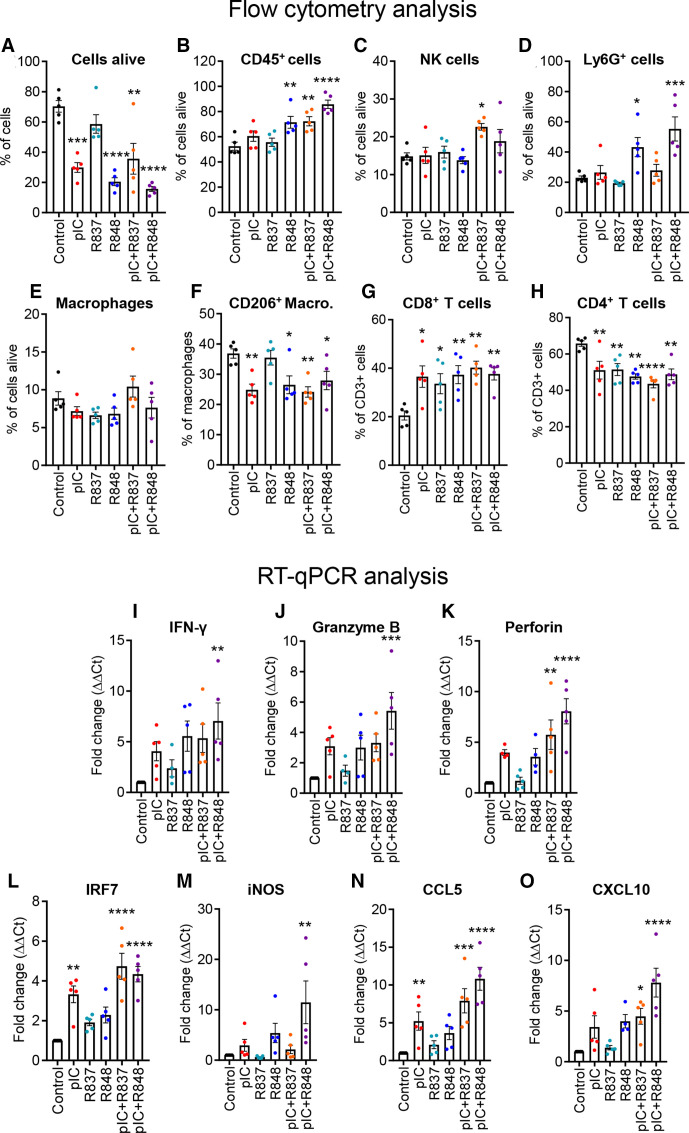
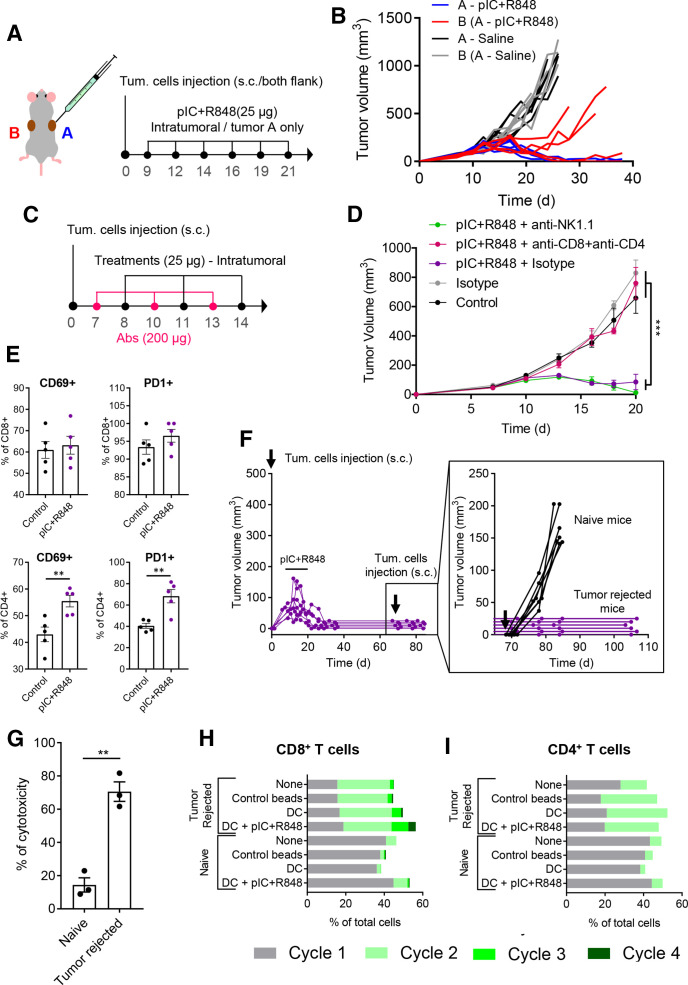
Methods: TLR agonist treatments were evaluated in vitro for toxicity and immunostimulatory activity by Alamar Blue, ELISA and flow cytometry using primary human and murine M-CSF-differentiated macrophages. Cytotoxic activity of TLR-treated macrophages toward cancer cells was evaluated with an in vitro functional assay by flow cytometry. For in vivo experiments, the CMT167 lung cancer model and the MN/MCA1 fibrosarcoma model metastasizing to lungs were used; tumor-infiltrating leukocytes were evaluated by flow cytometry, RT-qPCR, multispectral immunophenotyping, quantitative proteomic experiments, and protein-protein interaction analysis.

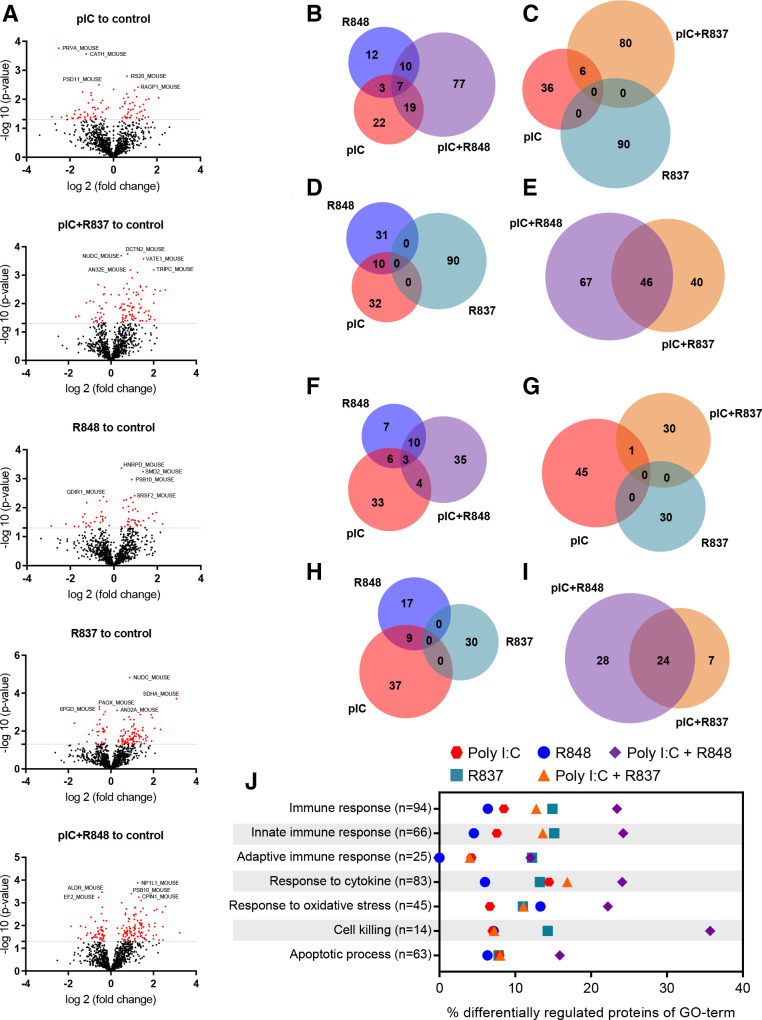
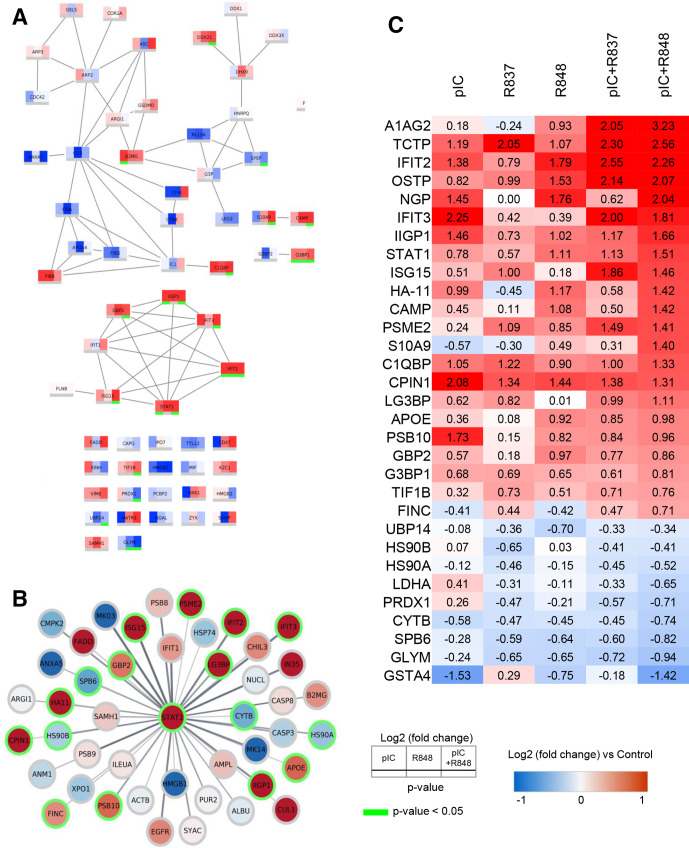
Results: Results demonstrated the higher efficacy of poly(I:C) combined with R848 versus single treatments or combined with R837 to polarize macrophages toward M1-like antitumor effectors in vitro. In vivo, the intratumoral synergistic combination of poly(I:C)+R848 significantly prevented tumor growth and metastasis in lung cancer and fibrosarcoma immunocompetent murine models. Regressing tumors showed increased infiltration of macrophages with a higher M1:M2 ratio, recruitment of CD4+ and CD8+ T cells, accompanied by a reduction of immunosuppressive CD206+ TAMs and FOXP3+/CD4+ T cells. The depletion of both CD4+ and CD8+ T cells resulted in complete loss of treatment efficacy. Treated mice acquired systemic antitumoral response and resistance to tumor rechallenge mediated by boosted macrophage cytotoxic activity and T-cell proliferation. Proteomic experiments validate the superior activation of innate immunity by poly(I:C)+R848 combination versus single treatments or poly(I:C)+R837, and protein-protein-interaction network analysis reveal the key activation of the STAT1 pathway.

Discussion: These findings demonstrate the antitumor immune responses mediated by macrophage activation on local administration of poly(I:C)+R848 combination and support the intratumoral application of this therapy to patients with solid tumors in the clinic.

Keywords: immunity; immunotherapy; innate; lung neoplasms; macrophages.


Conflict of interest statement

Competing interests: None declared.

Figures

Figure 1
Figure 1
Toxicological and immunomodulatory evaluation in vitro of intracellular TLR agonists alone or combined using primary human macrophages. Macrophages were in vitro differentiated from purified monocytes stimulated with 25 ng/mL of recombinant human macrophage colony-stimulating factor for 6 days (M0); M1 and M2 polarized macrophages were obtained by stimulation with 100 ng/mL of lipopolysaccharide+50 ng/mL of interferon-γ or 20 ng/mL of IL-4, respectively, for 24 hours. (A) Cell viability (Alamar blue) of M0 macrophages exposed 24 hours to TLR agonists alone or in different combinations. concentrations used were 5, 10, 20 and 50 µg/mL, represented by color gradient from left to right. (B–D) cytokine secretion (ELISA) of (B) CXCL10, (C) CCL5, and (D) IL-10 by macrophages exposed for 24 hours to 5 µg/mL of TLR agonists or untreated M0 macrophages. In each panel, M1 and M2 polarized macrophages from the same individuals are shown as reference populations. Each dot corresponds to macrophages from each blood donor. (E) THP-1-Lucia cells for monitoring the NF-kB signal transduction pathway were exposed for 16 hours to pIC and/or R848 at indicated concentrations. Bars represent mean±SD, n=3. (F, G) Cytotoxic activity of TLR-treated macrophages toward human Panc1 cancer cells stained with CellTrace. Each dot corresponds to macrophages from each blood donor. Bars represent mean±SEM. Statistical comparison was performed using one-way analysis of variance followed by Tukey’s multiple comparison test. Statistically significant differences are represented as follows: *p<0.05, **p<0.01, ***p<0.001, and ****p<0.001. IL, interleukin; NF-kB, nuclear factor-kappa B; ns, non-significant; pIC, poly(I:C); R837, imiquimod; R848, resiquimod; TLR, toll-like receptor.
Figure 2
Figure 2
antitumoral and antimetastatic efficacy of intratumoral injections of pIC, R837 and R848, alone or combined, in the immunocompetent lung cancer murine model CMT167 and fibrosarcoma murine model MN/MCA1. (A) Schematic representation of the experimental protocol. CMT167 cells were injected subcutaneously in the flank. From day 9 to day 21, mice received 6 intratumoral injections of TLR agonists (25 µg) as monotherapy or in combination. Control mice received only saline. (B–F) Evolution of tumor growth of mice treated with (B) pIC, (C) R837, (D) R848, (E) combination of pIC+R837, and (F) combination of pIC+R848. (G) Comparison of tumor volume and (H) tumor weight at sacrifice and graphical visualization of the statistical differences (right). Representative experiment of two performed. (I) Schematic representation of the experimental protocol. MN/MCA1 cells were injected intramuscularly in the thigh. From day 9 to day 21, mice received six intratumoral injections of pIC and R848 (25 µg) as monotherapy or in combination. Control mice received only saline. (J–L) Evolution of tumor growth in mice treated with (J) pIC, (K) R848, or (L) pIC+R848. (M) Comparison of tumor volume and (N) the number of surface lung macrometastasis at sacrifice and graphical visualization of the statistical differences (right). (O) Representative pictures of lungs from each treatment group. Bars represent mean±SEM, n=7 per group. Statistical comparison was performed using one-way analysis of variance followed by Tukey’s multiple comparison test. Statistically significant differences are represented as follows: *p<0.05, **p<0.01, ***p<0.001, and ****p<0.001 vs control. ns, non-significant; pIC, poly(I:C); R837, imiquimod; R848, resiquimod; TLR, toll-like receptor.
Figure 3
Figure 3
Multiplexed immunofluorescence analysis of immune infiltration in CMT167 tumors treated with TLR agonist monotherapies or combinations. Immunofluorescence analysis of CMT167-derived tumors at sacrifice, on intratumoral treatment with six injections of TLRs agonists, as indicated in figure 2A. (A) Representative images of tumors. (B–F) Quantification of (B) total immune cells, (C) macrophages (F4/80+), (D) CD8+ T cells, (E) CD4+ T cells, and (F) FOXP3+/CD4+ T cells in treated tumors. n=5 per group except pIC+R848, n=3. (G, H) Multiplexed immunofluorescence analysis of TAM polarization in tumors treated with six injections of pIC and R848. (G) Representative images of control and pIC+R848-treated tumors. (H) Ratio of M1 (F4/80+, iNOS+):M2 (F4/80+, Arg1+) macrophages. n=4 per group. Each dot corresponds to a single animal. Bars represent mean±SEM. Statistical comparison was performed using one-way analysis of variance followed by Dunnett’s multiple comparison test. Statistically significant differences are represented as follows: *p<0.05, **p<0.01, ***p<0.001, and ****p<0.0001 vs control. iNOS, inducible nitric oxide synthase; pIC, poly(I:C); R837, imiquimod; R848, resiquimod; TAM, tumor-associated macrophage; TLR, toll-like receptor.
Figure 4
Figure 4
Profiling of immune cell populations and gene expression evaluation in the TME of the CMT167 tumors treated with TLR agonist monotherapies or combinations. CMT167 tumors were intratumorallly treated with two injections of TLR agonists as monotherapy or in combination. Intratumoral leukocytes were analyzed with flow cytometry for the proportion of (A) living cells (LIVE/DEAD Cell Stain) in total cells, (B) leukocytes (CD45+) in living cells, (C) NK cells (NK1.1+), (D) Ly6G+ cells (Ly6G+), (E) macrophages (CD11b+, F4/80+), (F) M2-type macrophages (CD206+) in total macrophages, (G) CD8+ T lymphocytes, and (H) CD4+ T lymphocytes in total T lymphocytes. (I–O) Gene expression analysis of tumors by RT-qPCR of (I) IFN-γ, (J) granzyme B, (K) perforin, (L) IRF7, (M) iNOS, (N) CCL5, and (O) CXCL10 in the TME. Results are expressed as fold change over control. Bars represent mean±SEM. Each dot corresponds to a single animal. n=5 per group. Statistical comparison was performed using one-way analysis of variance followed by Dunnett’s multiple comparison test. Statistically significant differences are represented as follows: *p<0.05), **p<0.01), ***p<0.001, and ****p<0.001 vs control. IFN, interferon; iNOS, inducible nitric oxide synthase; pIC, poly(I:C); R837, imiquimod; R848, resiquimod; TLR, toll-like receptor; TME, tumor microenvironment.
Figure 5
Figure 5
Intratumoral treatment with the pIC+R848 combination activates systemic and memory adaptive antitumor immune responses in mice rejecting tumors. (A, B) pIC+R848 treatment in a two-tumor model. (A) Schematic representation of the experimental protocol. CMT167 cells were subcutaneously injected in the right (A, in blue) and left (B, in red) flanks. From day 9 to day 21, mice received intratumoral injection of pIC+R848 combination (25 µg of each drug) only in one tumor (A). Control mice received only saline. (B) Evolution of each tumor growth (right tumor in blue (A) and left tumor in red (B)) in mice treated with pIC+R848 versus control. n=5 per group. (C, D) Tumor growth in mice depleted for CD4+ and CD8+ T cells or NK cells and treated with pIC+R848. Mean±SEM. n=7 per group. Statistical comparison was performed using one-way analysis of variance followed by Tukey’s multiple comparison test. Statistically significant differences are represented as ***p<0.001. (E) CMT167 tumors intratumorally treated with two injections of pIC+R848 were analyzed with flow cytometry for the proportion of CD69+ and PD1+ cells in CD4+ and CD8+ T cells. n=5 per group. Bars represent mean±SEM. Statistical comparison was performed using a t-test. Statistically significant differences are represented as **p<0.01. (F) Evolution of tumor growth in mice treated with six intratumoral injections of pIC+R848 combination, as indicated in figure 2A. Mice with no sign of tumor growth (tumor rejected mice) were rechallenged with CMT167 tumor cells at day 70 and did not receive any treatments afterward. Tumor growth of individual mice (inset) up to day 105 and comparison with a control group of naïve mice receiving tumor cell injection. (G) In vitro cytotoxicity of spleen macrophages derived from tumor-rejected or tumor-bearing naïve mice in coculture experiments with CMT167 lung cancer cells. Bars represent mean±SEM. Statistical comparison was performed using a t-test. Statistically significant differences are represented as **p<0.01. (H, I) Proliferation of (H) CD8+ or (I) CD4+ T cells from CellTrace stained splenocytes from tumor-bearing naïve or tumor-rejected mice, cocultured for 72 hours with syngeneic healthy naïve mice-derived DCs, which were previously exposed to CMT167 cell lysate with or without pIC+R848. Untreated splenocytes and CD3/CD28 beads were used as controls. DC, dendritic cell; pIC, poly(I:C); R848, resiquimod.
Figure 6
Figure 6
Quantitative proteomic analysis of antitumor immune responses triggered in tumors treated with TLR agonist monotherapies or combinations. Immunocompetent lung cancer murine CMT167 subcutaneous tumors were treated with two intratumoral injections of TLR agonists alone or in combination, as indicated in online supplemental figure 6A. (A) Volcano plots of the SWATH analysis of proteins comparing TLR-treated versus control tumors. X-axis shows log2 (fold change) and Y-axis shows the statistical significance through −log10 (p value). The gray lines represent the cut-off (p≤0.05). Significantly upregulated and downregulated proteins are indicated by red dots. (B–I) Quantitative Venn diagrams showing the number of (B–E) upregulated and (F–I) downregulated proteins versus control, found in the tumor samples of treated mice (p≤0.05). (J) Differential protein expression for GO terms of interest. Each row represents the proportion of significantly changed proteins (p<0.05) involved in the process compared with control. n indicates the number of measured proteins for the process. n=3 tumors per group of treatment. GO, Gene Ontology; pIC, poly(I:C); R837, imiquimod; R848, resiquimod; TLR, toll-like receptor.
Figure 7
Figure 7
PPI network analysis and heatmap displaying the most significantly altered protein expression. (A) PPI network analysis of innate immune response, with a confidence score of >0.7, showing the differences in protein expression induced by pIC, R848 or pIC+R848 intratumoral treatments. (B) STAT1 centered PPI network, with a confidence score of >0.4, showing the proteins affected by the pIC+R848 combination therapy. (C) Heatmap table showing quantitative protein expression data for selected proteins. Red and blue indicate increased and decreased log2 (fold change) compared with control, respectively. Green color indicates significance (p<0.05). pIC, poly(I:C); PPI, protein–protein interaction; R837, imiquimod; R848, resiquimod.

References

    1. Mantovani A, Marchesi F, Malesci A, et al. . Tumour-Associated macrophages as treatment targets in oncology. Nat Rev Clin Oncol 2017;14:399–416. 10.1038/nrclinonc.2016.217 - DOI - PMC - PubMed
    1. Cassetta L, Pollard JW. Targeting macrophages: therapeutic approaches in cancer. Nat Rev Drug Discov 2018;17:887–904. 10.1038/nrd.2018.169 - DOI - PubMed
    1. Anfray C, Ummarino A, Andón FT, et al. . Current strategies to target Tumor-Associated-Macrophages to improve anti-tumor immune responses. Cells 2019;9:46. 10.3390/cells9010046 - DOI - PMC - PubMed
    1. DeNardo DG, Ruffell B. Macrophages as regulators of tumour immunity and immunotherapy. Nat Rev Immunol 2019;19:369–82. 10.1038/s41577-019-0127-6 - DOI - PMC - PubMed
    1. Lebegge E, Arnouk SM, Bardet PMR, et al. . Innate immune defense mechanisms by myeloid cells that hamper cancer immunotherapy. Front Immunol 2020;11:1395. 10.3389/fimmu.2020.01395 - DOI - PMC - PubMed

Publication types